Building a CANSAT: A Comprehensive Guide to Telemetry and Data Visualization
In the world of engineering and space technology, CANSATs represent an exciting and practical challenge. I embarked on a journey to design…
Building a CANSAT: A Comprehensive Guide to Telemetry and Data Visualization
In the world of engineering and space technology, CANSATs represent an exciting and practical challenge. I embarked on a journey to design and build a CANSAT. In this post, I’ll walk you through the process, from the initial concept to data visualization, and share the insights I gained along the way.
What is a CANSAT?
A CANSAT is a small, can-sized satellite model used for educational purposes to simulate the functions of a real satellite. It is equipped with sensors to collect data, which is then transmitted to a ground station for analysis. The primary goal of my CANSAT project was to build a system that could effectively collect and visualize telemetry data using various sensors.
Project Overview
Objective: The objective of my CANSAT project was to develop a telemetry system that could collect data from different sensors and visualize it using Python. The sensors used in the project included:
- DHT11: Measures temperature and humidity.
- MPU6050: Measures acceleration and gyroscope data.
- GPS: Provides location coordinates, and measures altitude, and pressure.
- ESP32: Acts as the microcontroller for data acquisition and transmission.
Components: - CANSAT Body: Custom-built to house all the components.
- Data Transmission System: For sending data from the CANSAT to the ground station.
- Data Visualization Tools: Python libraries for visualizing the collected data.
Design and Assembly
1. Assembling the CANSAT: The CANSAT was designed to fit within a can-sized enclosure. It included mounting points for the sensors and connectors for wiring. Special care was taken to ensure that all components were securely fixed.
2. Integrating Sensors: Each sensor was connected to the ESP32 on a perfboard, which handled data acquisition and transmission. The DHT11 and MPU6050 sensors were connected via I2C, while the GPS module used serial communication.
Telemetry System
1. Data Collection: The ESP32 continuously collected data from the sensors and prepared it for transmission. The data was sent in real-time to the ground station using a wireless communication protocol — ESPNOW.
2. Data Transmission: A reliable transmission protocol was implemented to ensure that data was sent accurately and in real time. Error-checking mechanisms were incorporated to handle any potential data loss or corruption.
Data Visualization
1. Visualization Tools: Python was used to create visualizations of the collected data. Matplotlib library was employed to generate graphs and charts that provided insights into the telemetry data.
2. Insights Gained: The visualizations revealed trends and patterns in the data, such as temperature fluctuations, acceleration changes, and GPS coordinates. These insights were crucial for understanding the performance of the CANSAT and the behavior of the sensors.
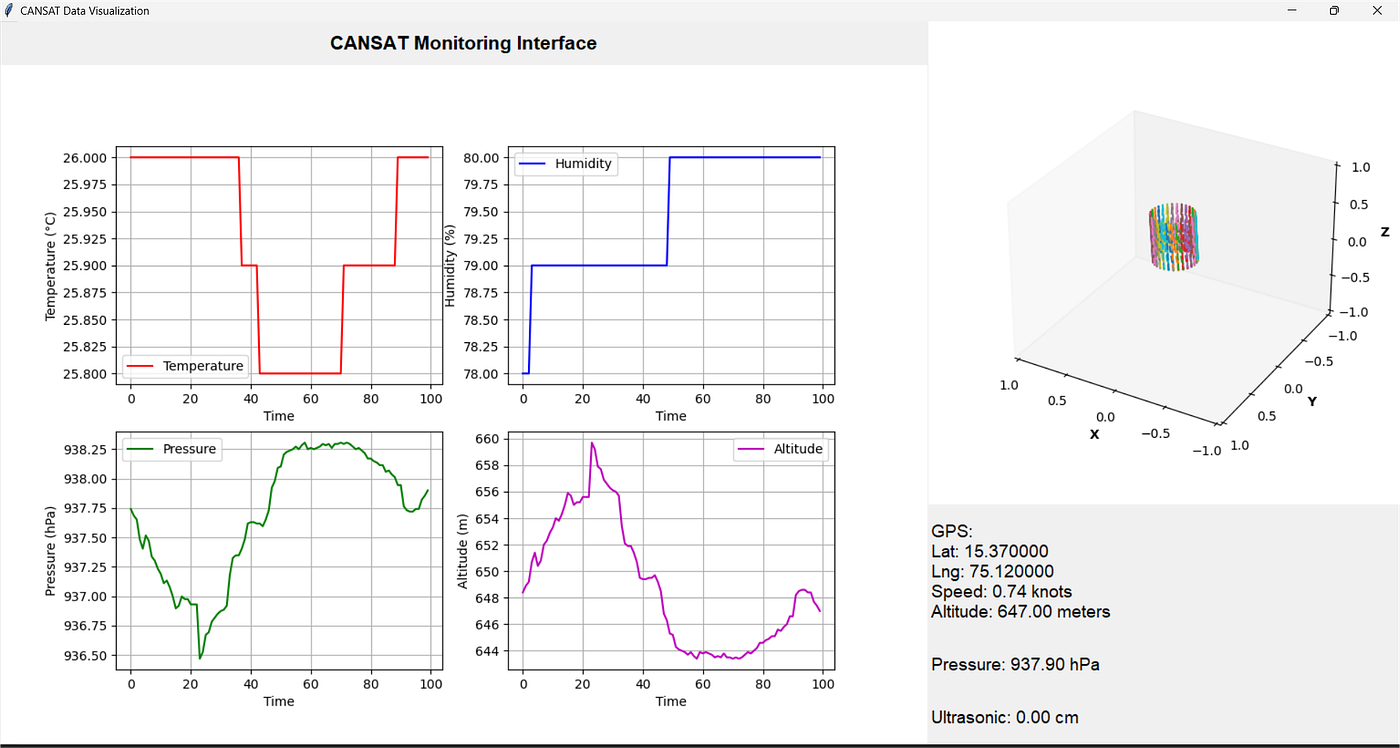
The image shows the ‘Cansat monitoring interface’
Challenges and Solutions
1. Technical Challenges: One of the main challenges was ensuring accurate data transmission over the wireless link. This was addressed by optimizing the transmission protocol and implementing error-checking mechanisms.
2. Sensor Integration: Integrating multiple sensors and ensuring they worked harmoniously with the ESP32 was another challenge. This was resolved through careful calibration and testing of each sensor individually before combining them.
Conclusion
Building a CANSAT has been a rewarding experience that combined technical skills with creativity. The project provided valuable insights into telemetry systems, sensor integration, and data visualization. It also highlighted the importance of rigorous testing and problem-solving in engineering projects.
Future Work
In the future, I plan to explore further improvements to the CANSAT, such as enhancing data transmission reliability and incorporating additional sensors for more comprehensive data collection. I also aim to continue my journey in space technology and engineering, applying the knowledge gained from this project to new and exciting challenges.
메타데이터
- post_id
- e7b4e5a3cbb7
- slug
- building-a-cansat-a-comprehensive-guide-to-telemetry-and-data-visualization-e7b4e5a3cbb7
- url
- https://medium.com/@rishipkulkarni/building-a-cansat-a-comprehensive-guide-to-telemetry-and-data-visualization-e7b4e5a3cbb7
- canonical_url
- https://medium.com/@rishipkulkarni/building-a-cansat-a-comprehensive-guide-to-telemetry-and-data-visualization-e7b4e5a3cbb7
- author_url
- https://medium.com/@rishipkulkarni
- status
- ok
- fetched_at
- 2026-07-23 07:01:10