Cardinals By The Numbers: 06/30/2025
Cardinals By The Numbers: 06/30/2025

Cardinals By The Numbers: 06/30/2025
Cardinals By The Numbers: Rebound
What a good 2 weeks for the team; they won by any means necessary and both the hitting and pitching looked better than the previous couple of weeks.
The team went 10–3 over the last 14 days against the White Sox, Reds, Cubs, and Indians, including sweeps in the first and last series. They had a +27 run differential in that time, up over the -12 from the previous 2 weeks.
WLPct4738.553

I’m sure there is a large percentage of the fanbase that can’t believe this team is over .500 at this point of the season, and that they’ve been over .500 since May 9th (47 games). They jumped .039 in win percentage in the last 2 weeks. At the rate they are playing, they could end the season 90–72 (the .553 win percentage times 162 games).
HomeRoadWLPctWLPct2917.6301821.462
Most of the last 2 weeks was at home; they White Sox series was in Chicago, so the sweep definitely helped the road numbers. A 7–3 homestand helped to keep their good home numbers up.
WLTPct15102.600
They were 3–0–1 in series over the last 2 weeks, splitting the 4-games series with the Cubs. That pushes them to a .600 winning percentage for series, a healthy number for almost any team.
RARARDpWpLpPct403358454738.553


With the recent success, the team has seen it’s run differential jump from +18 to +45. That’s tied for the highest it’s been this season (May 19, May 28). The run differential also supports the current record; the Pythagorean Wins of 47 matches their actual wins. It also supports the 90 win season.
RS/GRA/GPrevious Column4.235.15Last 2 Week5.773.69Season4.744.21

The previous column talked about the decline in offense and pitching over that 2 week period; they completely flipped it around. They scored 1.55 more runs per game while allowing 1.46 fewer runs. That brought the season runs/game up .18 and dropped the runs allowed by .10.
RSTotalWLPctRATotalWLPct10+77 (+1)01.00010+505.000953 (+1)2.6009303.000855 (+3)01.0008303 (+1).000763 (+1)3.500772 (+1)5.28661110 (+2)1.909632 (+2)1.667598 (+2)1.8895157 (+1)8.46741147.3644106 (+1)4 (+1).6003422.50031275 (+1).5832844.5002106 (+2)4.600114113 (+1).071177 (+1)01.0000505 (+2).00001010 (+2)01.000
Every one of the Cardinals wins and losses have a direct correlation to runs scored; when they scored 5 or more, they won and when they scored less than 2, they lost. Pretty simple. The runs allowed was a little different since they allowed anywhere from no runs to 8; it was expected that allowing 8 runs would be a lost, but it’s more questionable when they only allowed 3–4 runs, especially with the offense firing pretty much the whole time.
RDTotal10 or more2 (+1)908177 (+1)63 (+1)56 (+2)4135 (+1)27 (+1)115 (+3)00–112–24–310 (+2)-44–50–63–71–82 (+1)-90–10 or more2
The Cardinals are 15–12 in 1-run games; I don’t have the numbers in front of me, but that was a point where they struggled in the recent past.

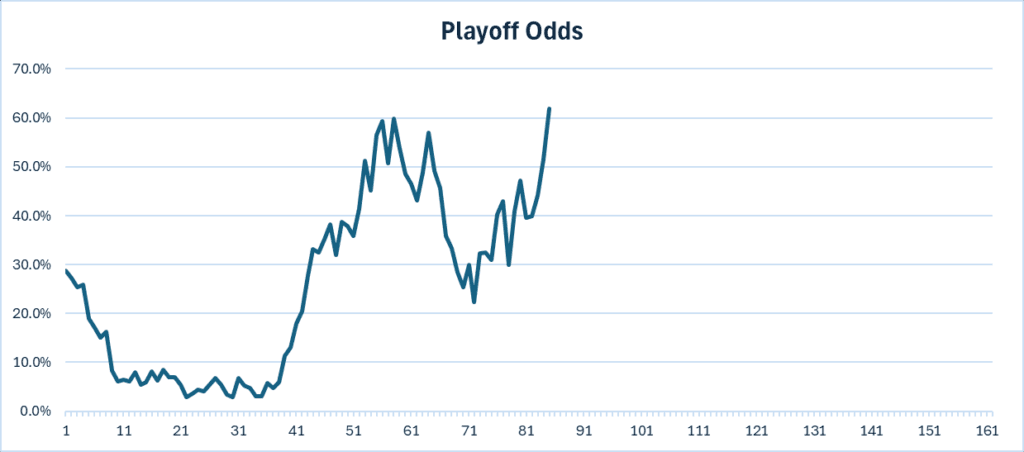
After the previous 2 weeks, the Cardinals have seen their playoff odds shoot up; they went up by almost 40% in this period alone and are the highest they’ve been all season. There is still a long way to go, so it’s not a guarantee yet.
PlaceTeamWLPctGB1Chicago Cubs4935.583–2Milwaukee Brewers4737.5602.03St. Louis Cardinals4738.5532.54Cincinnati Reds4440.5245.05Pittsburgh Pirates3550.41214.5
Everyone caught the Cubs a little bit; unfortunately the Brewers stayed right in front of the Cardinals pretty much the whole time.
TeamWLPctGBNew York Mets4837.565+1.0Milwaukee Brewers4737.560+0.5St. Louis Cardinals4738.553 — San Diego Padres4538.5421.0San Francisco Giants4539.5361.5Cincinnati Reds4440.5242.5Arizona Diamondbacks4142.4945.0Atlanta Braves3845.4588.0Miami Marlins3745.4518.5Washington Nationals3549.41711.5Pittsburgh Pirates3550.41212.0Colorado Rockies1965.22627.5
The Cardinals have played into a wild card spot by a little bit; there are 3 teams within 4 games of them. It’ll be a hard road to hang onto though; the Giants have already started to upgrade and the Padres and Reds should be buyers too. I still maintain that the Braves are too good to continue being this bad.
Now onto the player performances.
RankPlayerOPS+ LastOPS+ NowChange1Ivan Herrera158156–22Alec Burleson (+2)114122+83Brendan Donovan131122–94Willson Contreras (+1)110112+25Yohel Pozo (NR)100108+8
I’m holding off on putting Jose Fermin (464) on the top, as he’s only played in a handful of games; I’ll add him in 2 weeks if he continues to hit. Thomas Saggese fell out of the top 5 after being called back up; he dropped from 143 to 89.
It’s too bad that the team will be without their best hitter for an extended period; the team announce Herrera has a Grade 2 hamstring strain. It’ll hurt, but it will also give the team more options at DH.
The rest of the top 5 has pretty much been the same, with Pozo cracking the top 5; he’s been playing well in limited time and should continue to spell Pedro Pages every few days.
Nolan Gorman and Masyn Winn are the only other players above average right now, which is surprising because of how well this team is hitting. 8 of the 16 guys on the roster during that period all saw their OPS+ go up, so that would explain the past 2 weeks.
RankPlayerOPS+ LastOPS+ NowChangeRyan Vilade-18–1801Jose Barrero3530–52Michael Siani585802Jordan Walker (-1)6558–74Pedro Pages7176+55Victor Scott II8288+6
I threw Vilade where he would rank if he were still with the team; I’ll do the same thing next time with Barrero. Other than that, nothing changed as far as names; we did see Walker drop to be tied with Siani for 2nd worst on the team. Walker is back on the IL but already rehabbing in Memphis, so we’ll see him back soon.
Garrett Hampson should have enough at bats to be added; he was sitting at a 13 OPS+ after 5 games since he was claimed on waivers.
RankPlayerERA+ LastERA+ NowChange1Andre Granillo (NR)NA321+3212Phil Maton (-1)201246+452Riley O’Brien (NR)109187+784JoJo Romero138149+115Kyle Leahy (-3)177147–30
McGreevy struggled in his most recent promotion, so he fell off the list going from 136 to 99. Steven Matz also dropped off the list; his fall from 177 to 123 wasn’t as drastic since he’s still pitching at an above average level.
This bullpen is crazy good; they went from an early season liability to one of the better ‘pens in baseball. Matt Svanson (130) and Ryan Helsley (122) are both pitching well and can’t crack this list.
The rotation has Sonny Gray and Matthew Liberatore doing well, then average or below average guys; Andre Pallante at least improved this past period (84 > 93), but Miles Mikolas continues to fall off (94 > 87).
RankPlayerERA+ LastERA+ NowChange1Ryan Fernandez3738+12Roddery Munoz4554+93Chris Roycroft (+1)6061+14Gordon Graceffo (-1)5663+75Miles Mikolas (NR)9487–7
As mentioned above, Pallante has pitched better recently, and it was good enough to get out of the bottom 5 of ERA+; he switched places with Mikolas. Everything else was pretty much the same with just a flip flop at 3 and 4 and everyone but Mikolas getting better (although Fernandez’s increase was due to league average changing).
RankPlayerWAR LastWAR NowChange1Brendan Donovan2.32.4+0.12Victor Scott II (+1)1.71.8+0.12Sonny Gray (+1)1.21.8+0.64Willson Contreras (+1)1.11.4+0.35Masyn Winn (NR)0.91.3+0.46Nolan Arenado (+1)1.01.2+0.26Alec Burleson (NR)0.51.2+0.76Matthew Liberatore (NR)0.51.2+0.76Phil Maton (NR)0.71.2+0.56Lars Nootbaar (+1)1.01.2+0.2
I’m expanding this week to a top 10 because it’s a combination of pitchers and hitters. 7 through 10 were Arenado (t7th), Nootbaar (t7th), Herrera (9th), and Matz (10th).
Erick Fedde fell off the expanded list; he dropped from 1.3 to 0.8. Leahy was tied at 5th last week and fell off the expanded list as well; he dropped from 1.1 to 0.9.
There’s been a lot of fluctuation at the bottom of the list; we’ve seen some big jumps of half a win or more in Burleson, Liberatore, and Maton.
RankPlayerWAR LastWAR NowChange1Ryan Fernandez-1.0–1.00.01Jordan Walker-0.6–1.0–0.42Gordon Graceffo-0.6–0.60.03Chris Roycroft (-1)-0.6–0.5+0.159 playersNA-0.1NA
Michael Siani and Munoz were tied last week with -0.2 for the 5th spot; this week, they joined Vilade, Saggese, Mikolas, Hampson, Barrero, John King, and Luken Baker at -0.1. That’s everyone that has cost the team wins as of right now; the rest of the roster is positive or 0.0.
I hate to see Walker drop almost a half a win; like I said, he’s on the IL and hopefully back soon to his pre-wrist injury form where he looked like he was turning the corner. We’ll see.
I’ll be back in 2 weeks with updated numbers.
메타데이터
- post_id
- e8db09eb7e03
- slug
- cardinals-by-the-numbers-06-30-2025-e8db09eb7e03
- url
- https://medium.com/@wolverine0712/cardinals-by-the-numbers-06-30-2025-e8db09eb7e03
- canonical_url
- https://medium.com/@wolverine0712/cardinals-by-the-numbers-06-30-2025-e8db09eb7e03
- author_url
- https://medium.com/@wolverine0712
- status
- ok
- fetched_at
- 2026-07-24 00:02:31