You Don’t Have a Traffic Problem. You Have a Clarity Problem
Every week on Indie Hackers, a founder posts something like this: “613 visits, 20 signups, 3.3% conversion. Bad idea or bad landing page?”…
You Don’t Have a Traffic Problem. You Have a Clarity Problem
Every week on Indie Hackers, a founder posts something like this: “613 visits, 20 signups, 3.3% conversion. Bad idea or bad landing page?” The comments say fix the page. The founder has already moved on to “how do I get more traffic.”
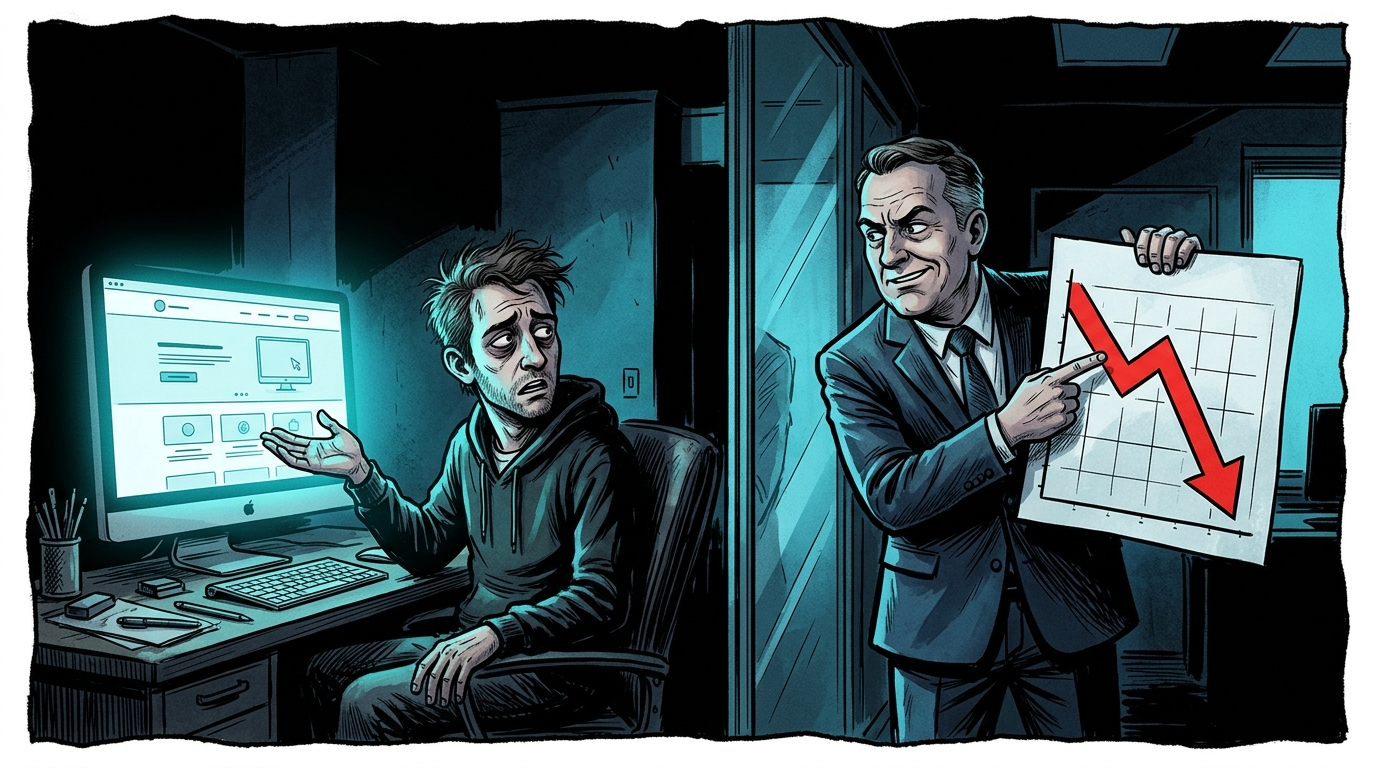
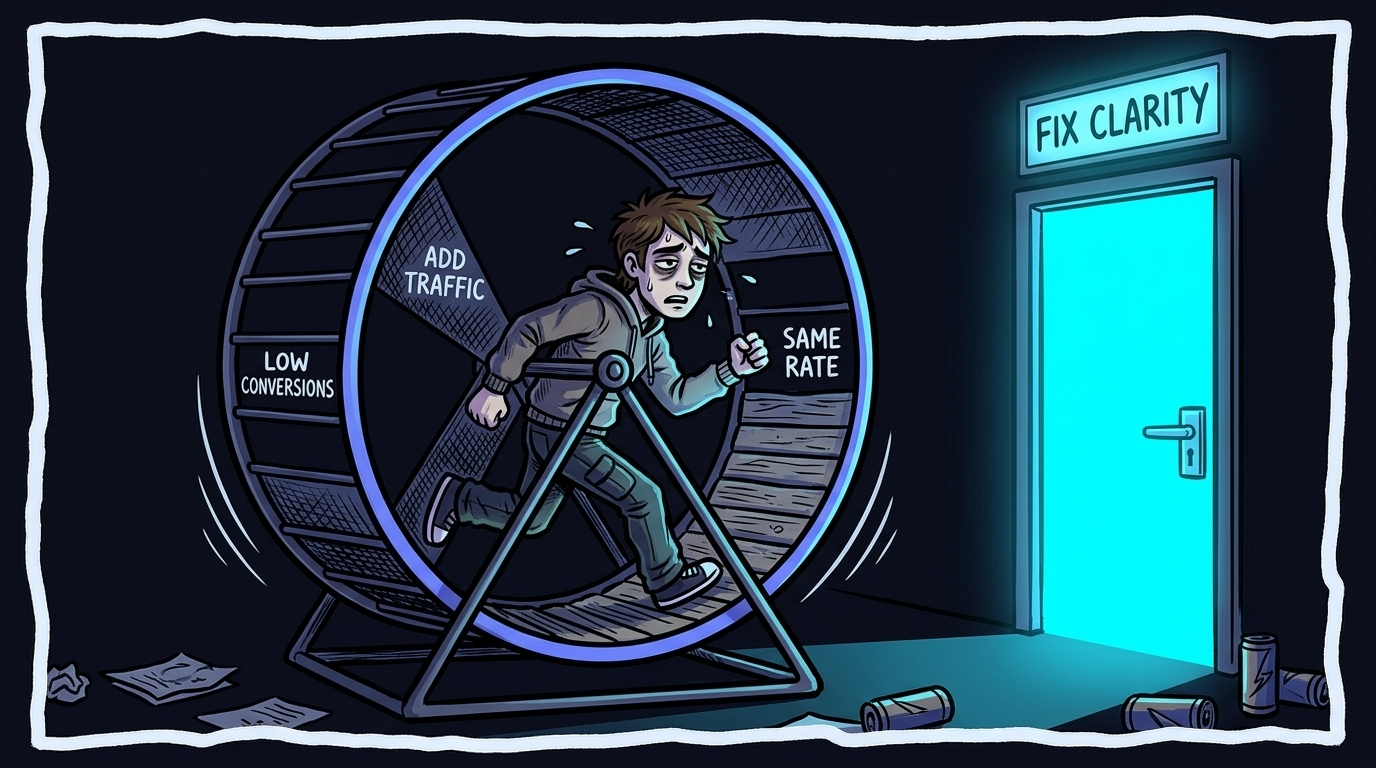
This is the founder loop. Launch. Low conversions. Conclude you need more traffic. Spend three months on SEO and paid ads. Triple the visitors. See the same 1–2% conversion rate. Conclude the idea is bad. Move on. The page was never the suspect. It looked fine. Looking fine and communicating clearly are not the same thing.
The average conversion rate is 2.35%. The other 97.65% aren’t saying no. They’re saying “I don’t understand.”
Why “I Need More Traffic” Is Almost Always the Wrong Diagnosis
A page converting at 1% does not become a page converting at 3% when you triple the traffic. It becomes a page converting at 1% with 3x the ad spend.
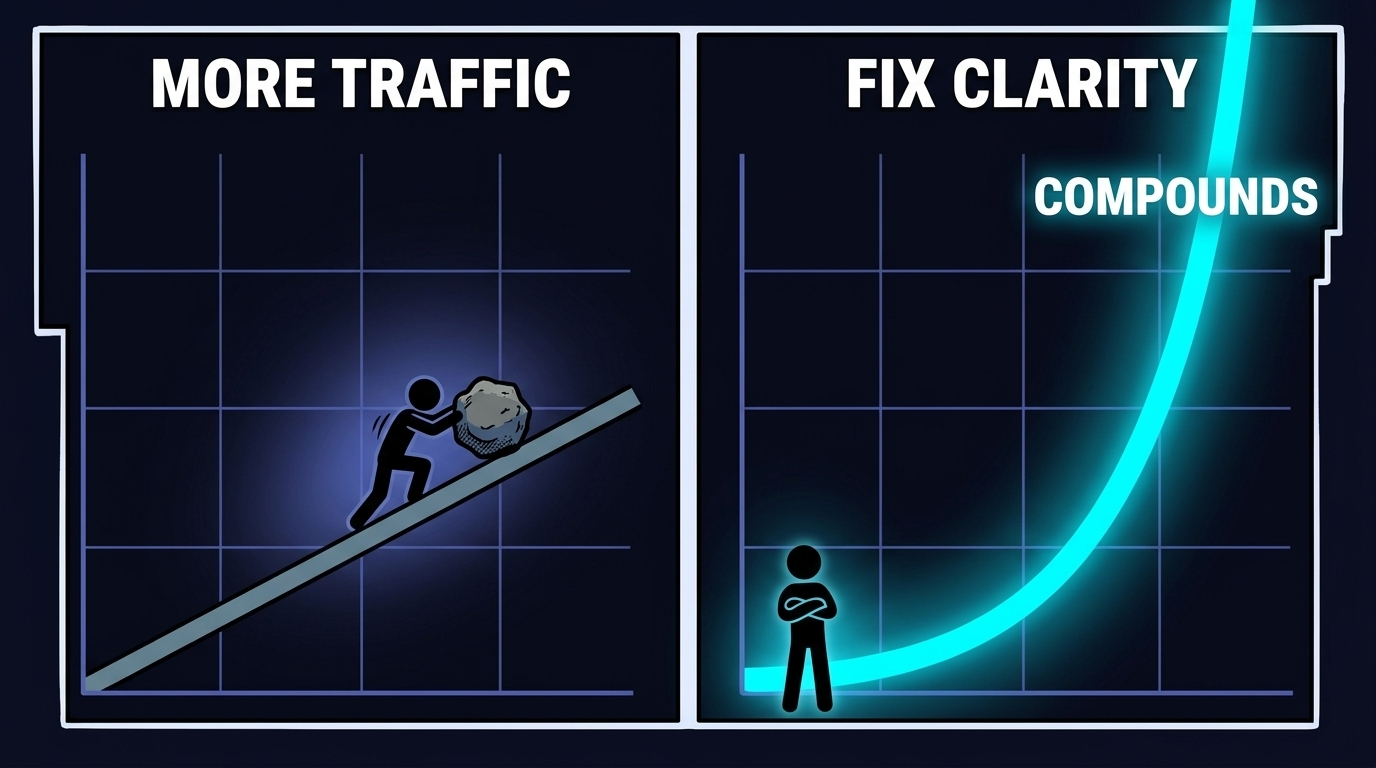
The math is simple. Double traffic from 500 to 1,000 visitors at 0.5%: 2.5 extra conversions. Fix clarity to 2% on the same 500 visitors: 7.5 more. Traffic is linear. Clarity compounds. Every future visitor also converts at the new rate.
3.8% Median SaaS landing page conversion rate. Top quartile: 11.6%. (Unbounce, 41,000 landing pages, 2024)
Unbounce analyzed 41,000 landing pages and found the SaaS median conversion rate is 3.8%. The top 25% convert at 11.6% or higher. The gap between 3.8% and 11.6% is not explained by traffic volume. It is explained by page quality, message-market fit, and clarity. The top-quartile pages are not getting better visitors. They are communicating more clearly with the same ones.
Here is the part that should concern you: the same page converts at wildly different rates depending on traffic source. Email traffic converts at 19.3% for SaaS. PPC converts at 0.7%. Same page. Same copy. Same CTA. A 27x difference from traffic source alone. Traffic source determines whether the visitor arrives with enough context to understand what they are looking at. When they do, the page works. When they do not, it fails.
“Traffic is not the problem anymore,” wrote one conversion consultant. “Conversion is. You don’t need more traffic. You need better performance from the traffic you already have.”
— -
What Clarity Actually Means (and How to Measure It)
Clarity is not “does the page look clean.” Clarity is: can a stranger identify what you do, who it is for, and why they should care within 8 seconds?
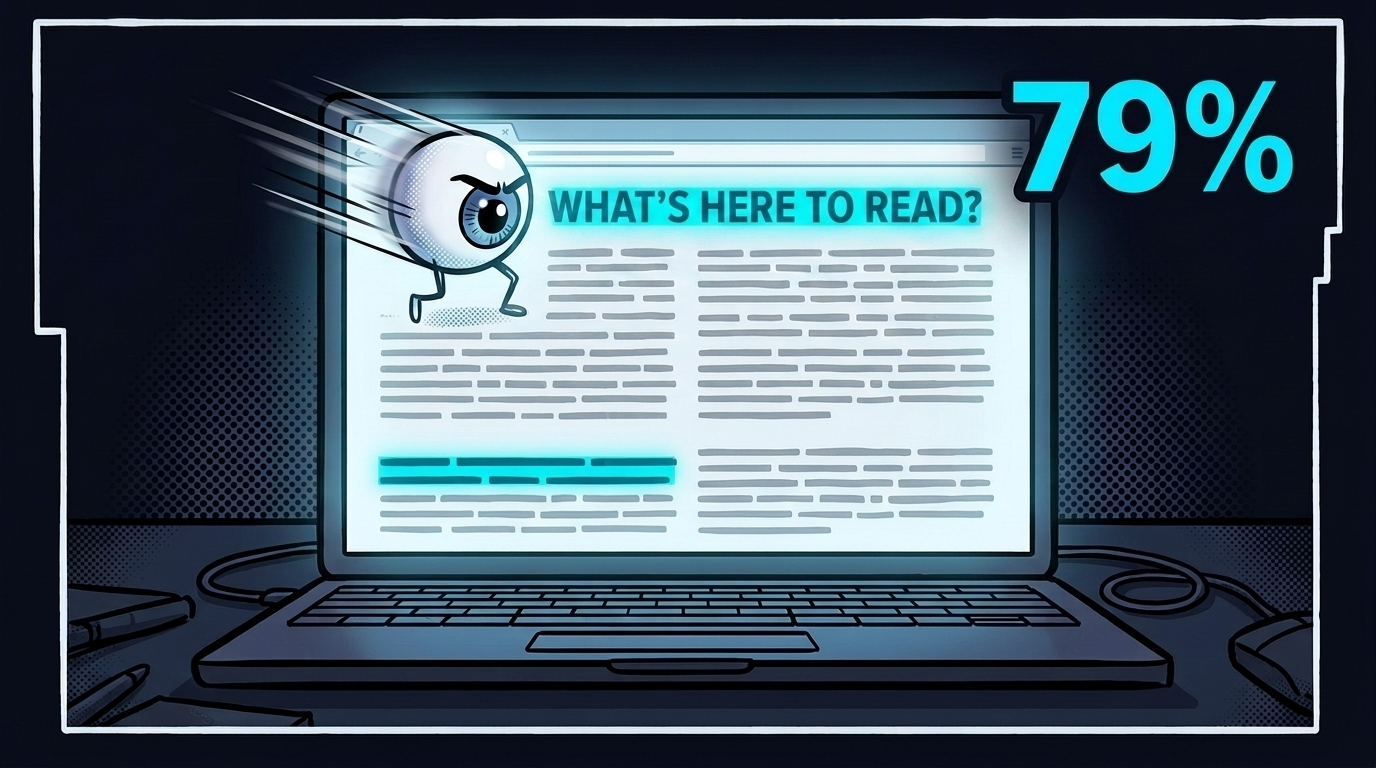
Nielsen Norman Group found that users read at most 20% of text on the average web page. 79% of users scan rather than read. They are not parsing your copy for accuracy. They are scanning for recognition: do I see my problem reflected back at me? If they do not see it in the first 10 seconds, they leave. Not because the copy is wrong. Because it does not feel like it was written for them.
79% of visitors scan rather than read. Only 16% read word-by-word. (Nielsen Norman Group)
NNG’s landmark copy study found that making text concise improved usability by 58%. Making it scannable improved it by 47%. Making it objective improved it by 27%. Combining all three produced a 124% usability improvement. These are not design changes. These are clarity changes. The content stayed the same. The way it was communicated changed.
A clarity score measures how consistently different visitor types understand your value proposition on first contact. A price-sensitive buyer scanning for pricing, a technical evaluator looking for specs, and a skeptical researcher looking for proof will each experience a different version of your page. Most pages are clear to one of these visitors and invisible to the other two.
— -
What Are the 4 Clarity Failures That Kill Conversion?
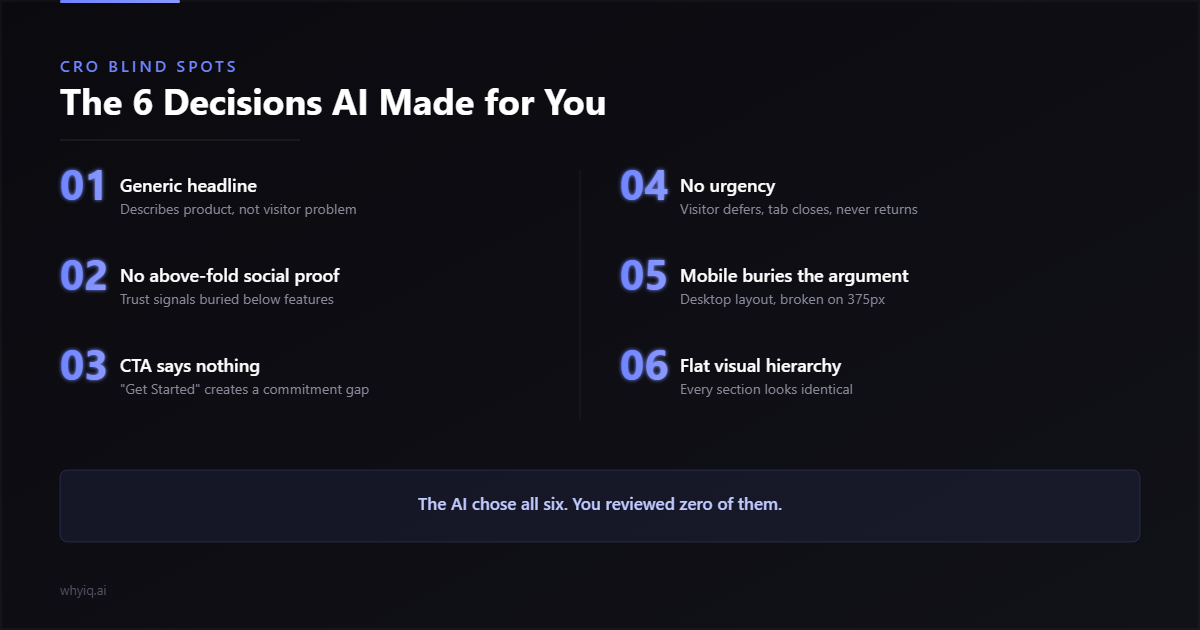
Four failures. Responsible for most low-traffic conversion problems. None of them are fixed by adding more visitors.
1. The headline describes features, not outcomes
“Smart Project Automation” tells the visitor what category the product is in. It does not tell them what problem it solves or what changes in their life if they use it. A headline that says “Stop losing 5 hours a week to manual status updates” names a specific pain, quantifies it, and implies an outcome. The first headline is accurate. The second one is clear. Headline optimization alone delivers conversion lifts of 27–104% across thousands of A/B tests.
There is no answer to “who is this for?” above the fold
Visitors self-select within seconds. They are looking for a signal that this page is for someone like them. If the page addresses “teams” or “businesses” or “professionals,” nobody feels specifically addressed. If it says “for SaaS founders burning through ad spend with no signups,” a very specific person recognizes themselves. The narrower the targeting, the stronger the recognition. Recognition is the prerequisite for reading further.
The CTA uses product jargon the visitor does not know yet
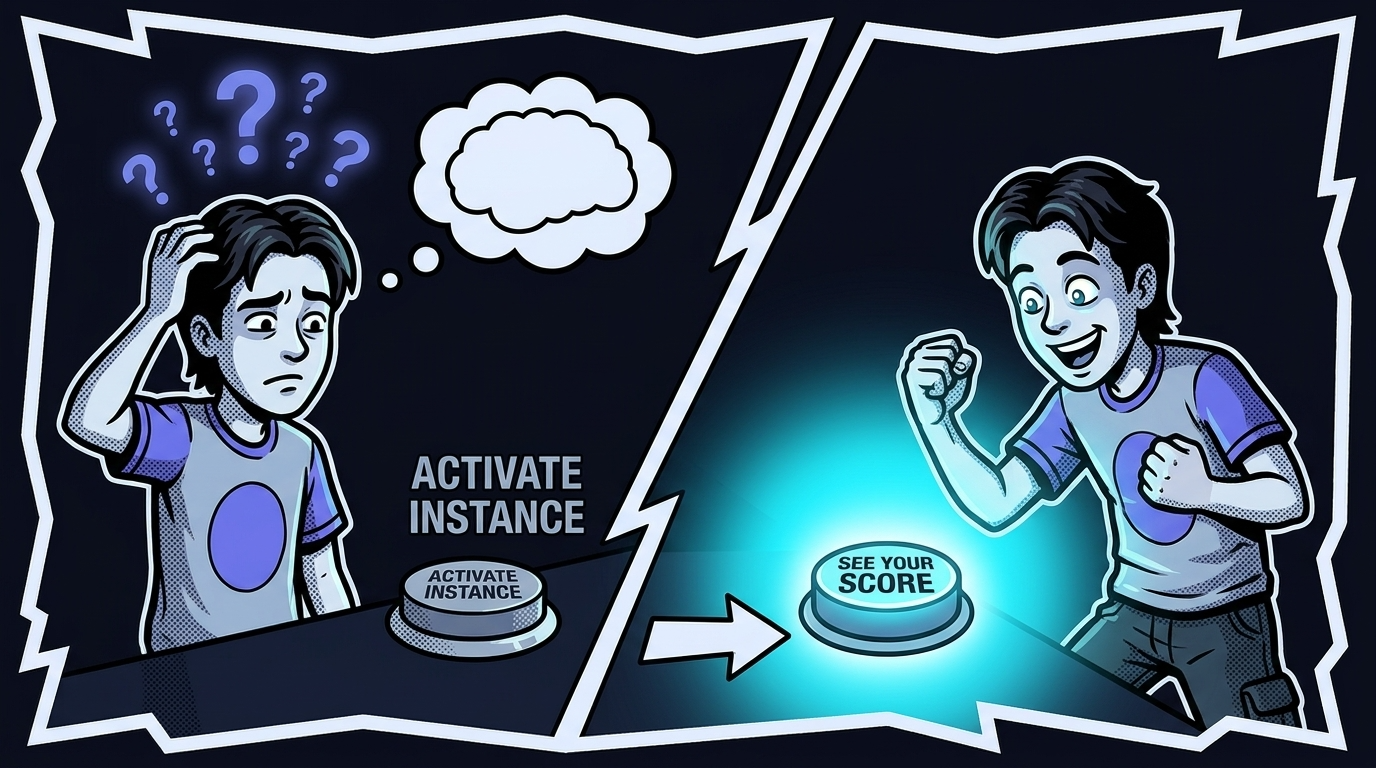
“Start your workspace.” “Launch your pipeline.” “Activate your instance.” These CTAs assume the visitor already understands your product model. They arrived 30 seconds ago. They have not decided if this is even relevant to them. A CTA that says “See how your page scores in 30 seconds” tells the visitor exactly what they get, how long it takes, and what the output is. The gap between a jargon CTA and a clear CTA is often the entire conversion rate.
4. Social proof is generic instead of specific
“Trusted by thousands of companies” with no logos, no names, no numbers, no outcomes. This is not social proof. It is a claim with no evidence. A single testimonial that says “We cut our bounce rate from 68% to 31% in three weeks” with a real name and company is more persuasive than ten generic quotes. Specificity is the trust signal.
— -
At What Traffic Level Does A/B Testing Even Work?
The A/B testing advice you read everywhere assumes you have enterprise traffic. You almost certainly do not.
To detect a 20% relative improvement on a 3% baseline conversion rate at 95% statistical confidence, you need approximately 13,900 visitors per variation. That is 27,800 total visitors across two variants. At 1,000 monthly visitors, this test takes 28 months. At 500 visitors a month, it takes over four years.
28 months to run one A/B test at 1,000 visitors/month (3% baseline, 20% MDE, 95% confidence). (Optimizely / VWO calculators)
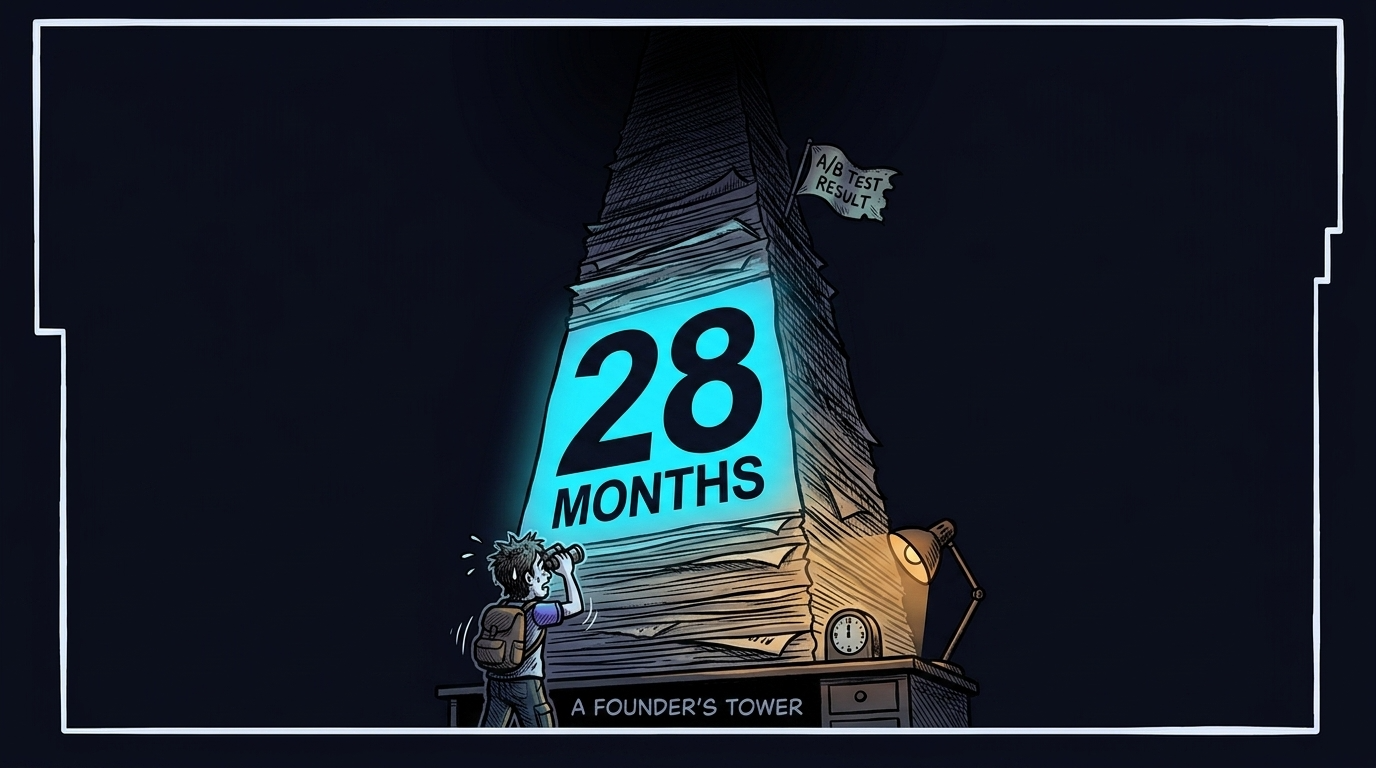
The industry rule of thumb for a reliable test is a minimum of 30,000 visitors and 3,000 conversions per variation. Most pre-PMF SaaS founders have 500 to 5,000 monthly visitors. A/B testing is not a viable optimization strategy at these volumes. Not “difficult.” Not “slow.” Mathematically impossible within a meaningful timeframe.
The “just run it for two weeks” advice makes it worse. At 1,000 visitors a month, two weeks gives you 500 total visitors: 250 per variant at a 3% conversion rate. That is 7.5 conversions each. The difference between your A and B variant will be random noise.
At 1,000 visitors a month, a single A/B test takes over two years. Your startup may not exist by then.
— -
How to Diagnose Clarity Without Traffic
You cannot test your way to a clearer page at low traffic. You need to diagnose your way there. Three methods work at any volume, including zero.
The five-second test
Show your landing page to five people who match your target audience. Give them five seconds. Remove the page. Ask two questions: what does this product do? Who is it for? If they cannot answer both accurately, you have a System 1 failure. The headline and visual hierarchy are not doing their job. This test catches the failures that no amount of copy editing will fix, because the problem is comprehension speed, not copy quality.
The mom test for landing pages
Show the page to someone outside your industry. Not for design feedback. For comprehension. If your mom, your neighbor, or anyone without domain knowledge cannot explain what the page offers after reading the first screen, a first-time visitor from Google cannot either. You have written the page in your vocabulary, not theirs. The gap between what you think is clear and what a stranger finds clear is where most conversion failures live.
Multi-persona simulation
Run 50 different visitor types through your page simultaneously. Each persona has different goals, different skepticism levels, different technical knowledge, and different device contexts. A price-sensitive buyer will notice different problems than a technical evaluator. A skeptical researcher will flag different failures than an impulse-action visitor. The failures that appear across multiple persona types are the ones to fix first, because they affect the largest share of your real traffic.
This is what WhyIQ does. Instead of waiting 28 months for one A/B test result, you get feedback from 50 visitor types in 30 seconds. The output is not “change your headline.” The output is: this specific persona could not identify what you do, this one did not trust the proof, this one left because pricing was missing. Different visitors. Different failures. Different fixes.
— -
Why the Traffic You Already Have Is Enough
Even 100 monthly visitors carry signal if the page is clear enough for them to act on.
The case studies all tell the same story. CXL rewrote a truck driving landing page: +79.3%, same traffic. Going changed three words in their CTA from “Sign up for free” to “Trial for free”: +104% trial starts. L’Axelle rewrote one headline: +93%. The Weather Channel decluttered their homepage: +225%. California Closets aligned their headline with their ad copy: +115% form submissions.
104% increase in trial starts from changing three words in the CTA. (Going, via Unbounce)
None of these required more traffic. All of them required the same thing: understanding what was unclear on the page and fixing it. The conversion lift came from clarity, not volume.
The 2.35% average conversion rate that everyone cites comes from a 2014 WordStream analysis of Google Ads accounts. It is a median, not an average. It is not SaaS-specific. It is not current. WordStream’s own 2024 update puts the figure at 7.52%. The SaaS-specific top quartile, per Unbounce, converts at 11.6%. Using the 2014 number as your benchmark gives you false comfort that an underperforming page is normal. “We’re about average” becomes “we’re leaving 3–8x on the table.”
The goal is not to get more visitors. The goal is to make the visitors you have understand the page. Once clarity is fixed, traffic acquisition becomes dramatically more efficient. A page converting at 4% instead of 1% means every ad dollar works 4x harder. Every blog post drives 4x the signups. Every Product Hunt launch produces 4x the results. The traffic you already have is enough. The page just needs to be clear enough to convert them.
— -
Want to know what your current visitors don’t understand? Run a free scan at WhyIQ. 50 visitor personas will tell you exactly where clarity breaks down, no login required.
Originally published at whyiq.ai
메타데이터
- post_id
- e98b08091dad
- slug
- you-dont-have-a-traffic-problem-you-have-a-clarity-problem-e98b08091dad
- url
- https://medium.com/@apeoid/you-dont-have-a-traffic-problem-you-have-a-clarity-problem-e98b08091dad
- canonical_url
- https://medium.com/@apeoid/you-dont-have-a-traffic-problem-you-have-a-clarity-problem-e98b08091dad
- author_url
- https://medium.com/@apeoid
- status
- ok
- fetched_at
- 2026-06-10 18:44:10