Stock Market Soars — Dow Jones Hits Record High Amid Fed Rate Cuts and Election Buzz
Technical market recap for the week of Sep 23–27, 2024. Dow Jones hits record high amid Fed rate cuts. Analyze market trends, sector…
Stock Market Soars — Dow Jones Hits Record High Amid Fed Rate Cuts and Election Buzz
Technical market recap for the week of Sep 23–27, 2024. Dow Jones hits record high amid Fed rate cuts. Analyze market trends, sector performance, and potential election impact. Trade idea: GLNG

Economic data sources: investor.com | Edward Jones | MarketWatch | SPDR ETFs
Summary
The stock market closed out last week with mixed results. However, all indexes are remaining in a bullish momentum.
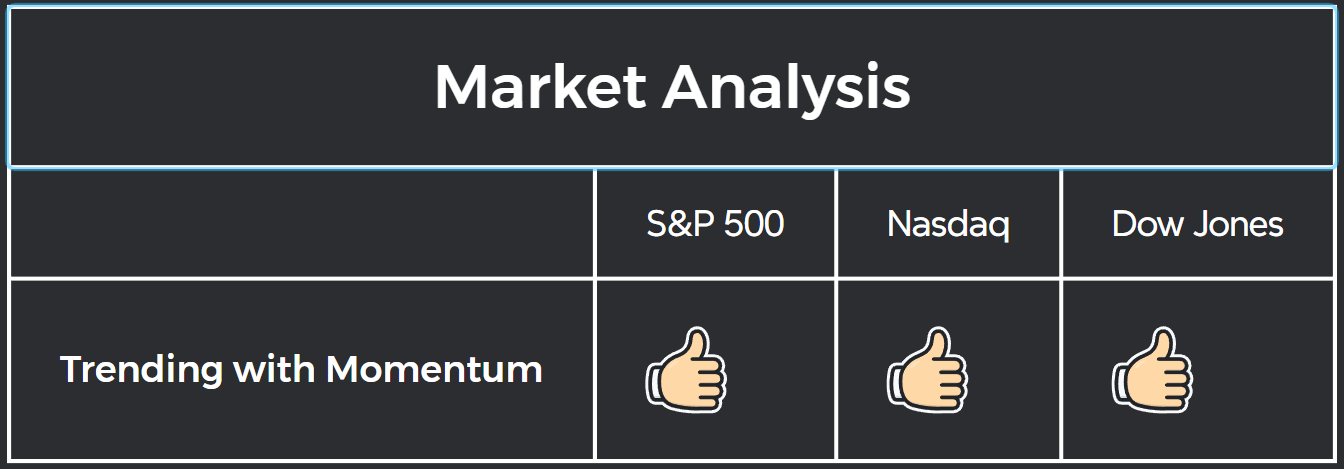
All three indexes are remaining in a bullish momentum
For more info on how momentum is determine, you can view it here.
The Dow Jones Industrial Average stole the spotlight, hitting a new record high and closing up 0.6% for the week.
Meanwhile, the S&P 500 mirrored the Dow’s performance, also notching a 0.6% gain for the week. The index now boasts an impressive 20.3% increase year-to-date.
Last week brought encouraging news on the inflation front, further supporting the Federal Reserve’s recent decision to cut rates.
The Personal Consumption Expenditure (PCE) Price Index, a key inflation gauge closely watched by the Fed, rose just 0.1% in August. This increase was in line with economists’ expectations and represents a 2.2% year-over-year rise, slightly below the anticipated 2.3%.
Key Takeaways:
- Dow Jones hit a record high, closing at 42,313.
- S&P 500 and Nasdaq both up over 20% year-to-date
- Russell 2000 underperformed, ending the week in negative territory
- Technology sector continued to lead, while energy stocks lagged
- Upcoming week features crucial PMI report, Consumer Credit, and September job data.
- China announced new economic stimulus measures on Tuesday (24Sep2024), targeting monetary policy and the property market to boost its sluggish economy. — People’s Bank of China is cutting 50 basis points from its reserve ratio, which determines how much cash banks need to keep on hand. — This freed up $142 billion in liquidity, which resulted in price surges for BABA, NIO, and JD (to name a few). — These are not our trade candidates because they’re either too extended or face too much overhead supply/resistance.
- Trade Ideas: GLNG
Background: Key Events Driving Market Movement
Inflation Data: A Cooling Trend
- PCE Price Index rose 0.1% in August, 2.2% year-over-year
- Core PCE also up 0.1% month-over-month, 2.7% annually — Both figures are aligned with projection — Suggests inflationary pressures are easing
- For upcoming rate cuts, the focus will shift more to job and employment data
Market Analysis
Recent S&P 500 Performance
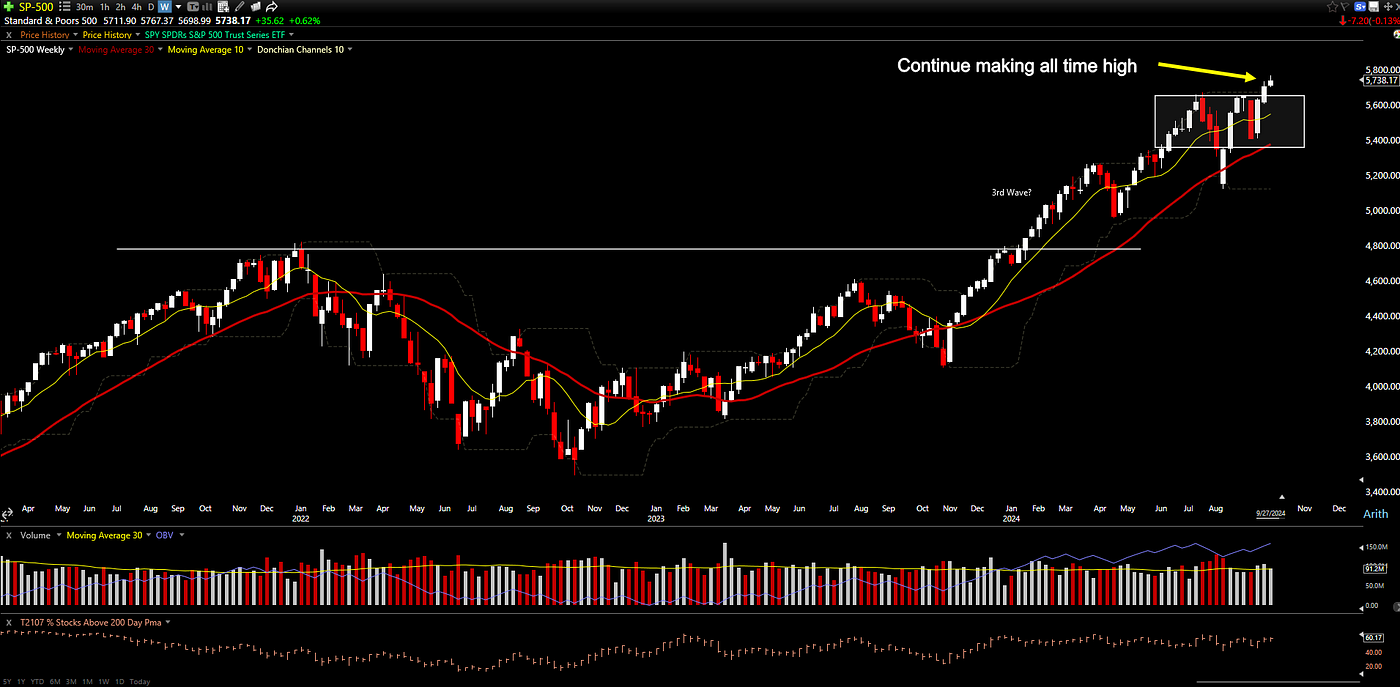
S&P 500 continues making all time high
Performance Metrics:
- Weekly Performance: 0.6%
- Year-to-Date Performance: 20.3%
Technical Indicators:
- The index continues to trade above its 10-week/ 50-day moving average, indicating a strong short-term trend.
- It also remains comfortably above the 30-week and 200-day moving average, suggesting a robust long-term uptrend.
- Support levels appear to be holding steady around the 5,600 mark.
Volume:
- Trading volume remained consistent with recent averages.
Market Breadth:
- Percentage of companies above 200 SMA: 60.17%
- This means the majority of Fortune 500 companies are joining in the rally, not just the mega-cap companies.
Comparison with Other Major Indices
Nasdaq
The tech-heavy Nasdaq outperformed its peers last week, reflecting continued enthusiasm for technology and growth stocks.
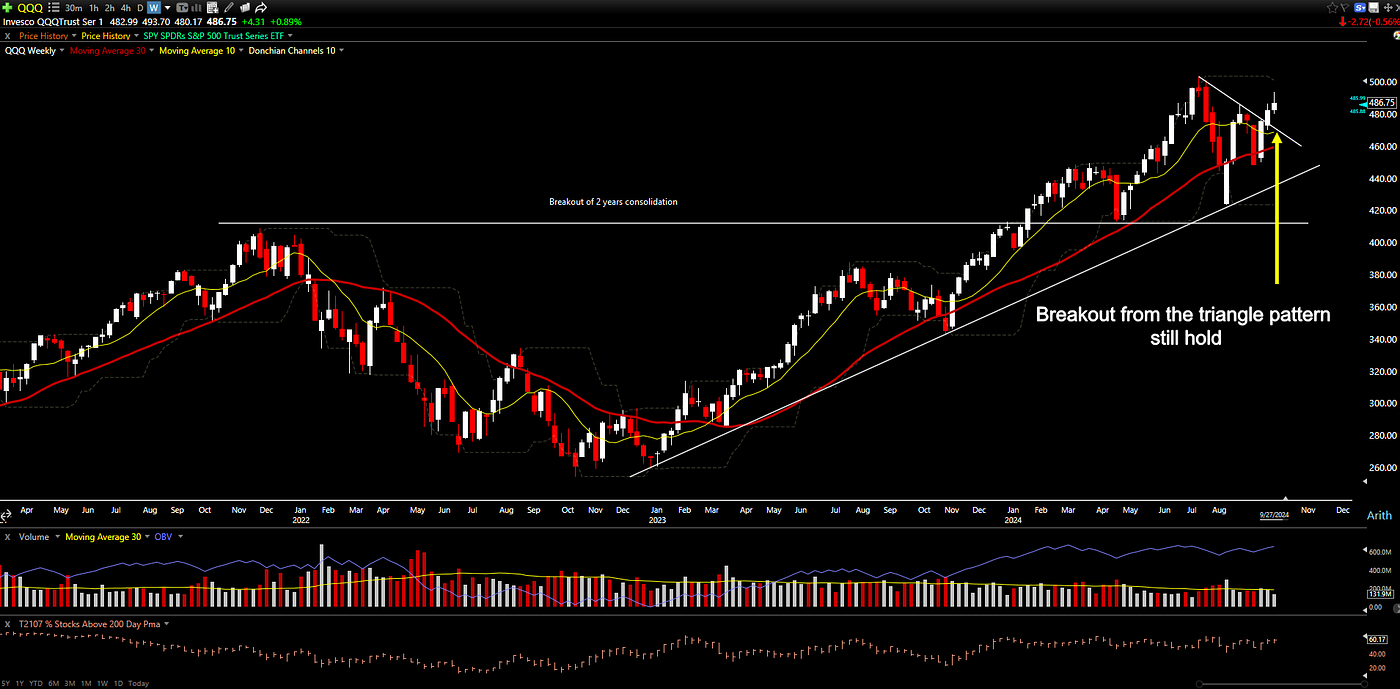
Nasdaq continues with a breakout from the triangle pattern
Performance Metrics:
- Weekly Performance: 1.0%
- Year-to-Date Performance: 20.7%
Technical Indicators:
- The index confirmed the breakout from the week before.
- It is above both short-term and long-term momentum/moving averages.
- We are clear for new buys. However, we need to watch how it reacts when it gets near all time high resistance.
Dow Jones Industrial Average
The Dow Jones was the star performer last week, hitting a new all-time high.
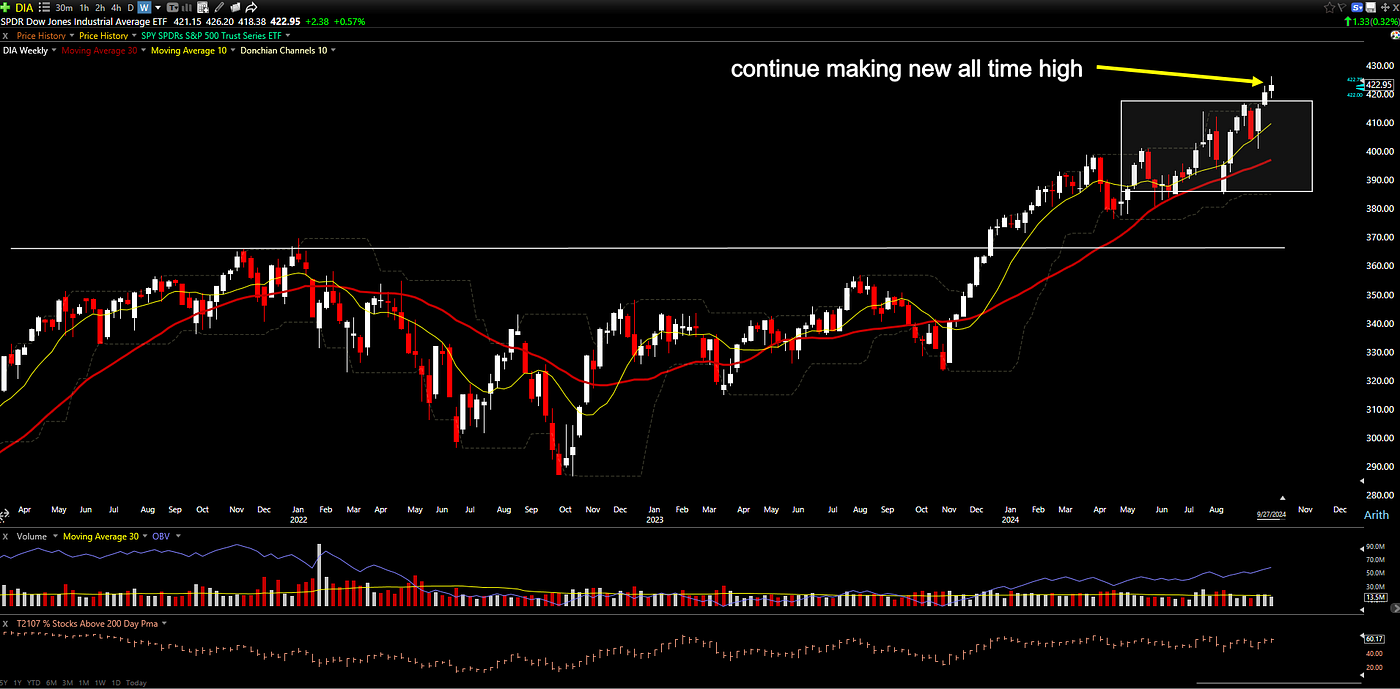
Dow Jones Industrial Average continues making all time high
Performance Matrix:
- Weekly Performance: +0.6%
- Year-to-Date Performance: +12.3%
Technical Indicators:
- The index has broken out above previous resistance, now trading at record levels.
- Both the 10-week and 30-week moving averages are sloping upward, confirming the bullish trend.
- Support has formed around the $417.85 mark on the ETF.
- We are looking at the ETF for data on volume.
Russel 2000
Small-cap stocks, as represented by the Russell 2000, underperformed the broader market last week.
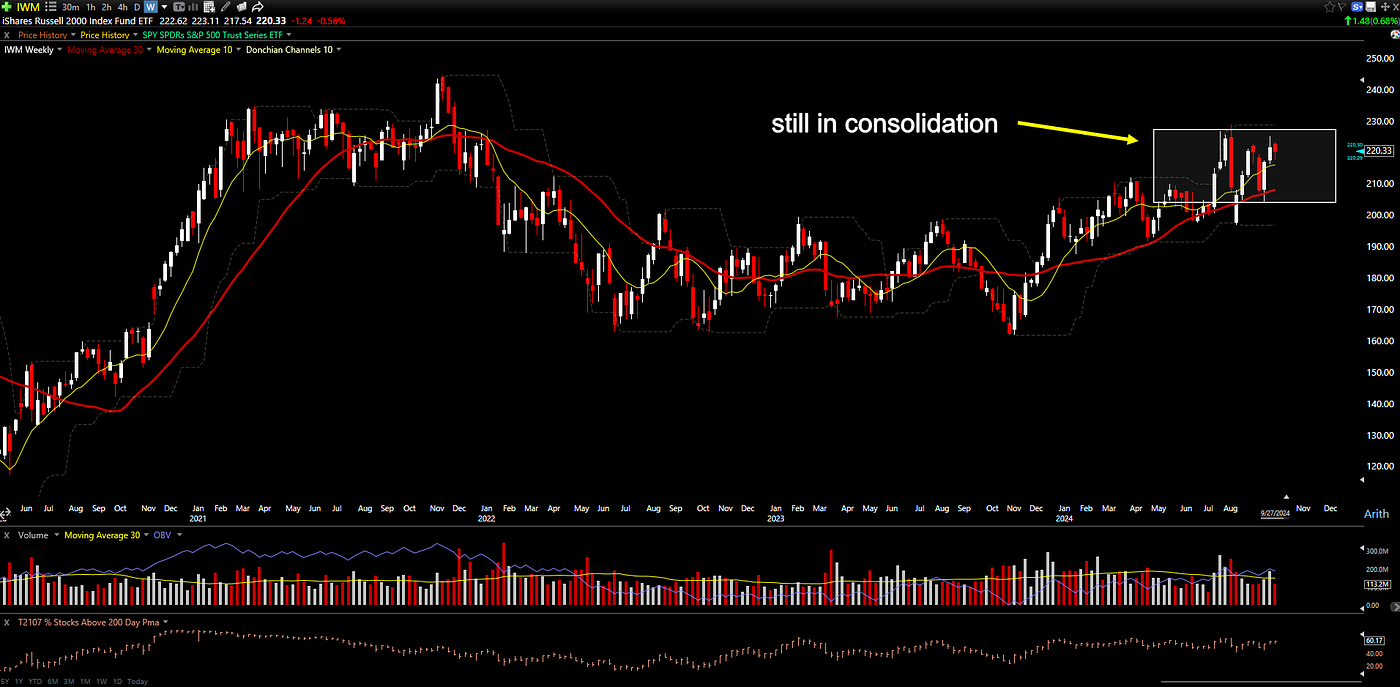
Small Cap has no clear direction. It is remaining in a consolidation.
Performance Matrix:
- Weekly Performance: -0.14%
- Year-to-Date Performance: 9.75%
Technical Indicators:
- The index is struggling to stay above its 10-week moving average, indicating some short-term weakness.
- It remains above the 30-week moving average, suggesting the long-term uptrend is still intact.
- The index still remains in consolidation.
- This has resulted in lighter volume for small-cap stocks, reflecting a preference for larger, more established companies in the current market environment.
Market Sector Rotation: Weekly and YTD Return
Performance sorted by YTD return.
Outperforming Sectors
- Utilities: 0.42% | YTD: 26.99%
- Communication Services: 1.27% | YTD: 23.14%
- Financial Services: -1.10% | YTD: 20.08%
- Industrial: 1.24% | YTD: 18.28%
- Technology: 1.15% | YTD: 16.95%
- Consumer Staple: -0.04% | YTD: 15.26%
Underperforming Sectors
- Basic Material: 3.03% | YTD: 13.50%
- Consumer Discretionary: 2.21% | YTD: 12.32%
- Healthcare: -1.46% | YTD: 12.20%
- Energy: -1.77% | YTD: 4.00%
- Real Estate: -0.87% | YTD: 10.41%
End of Month Analysis
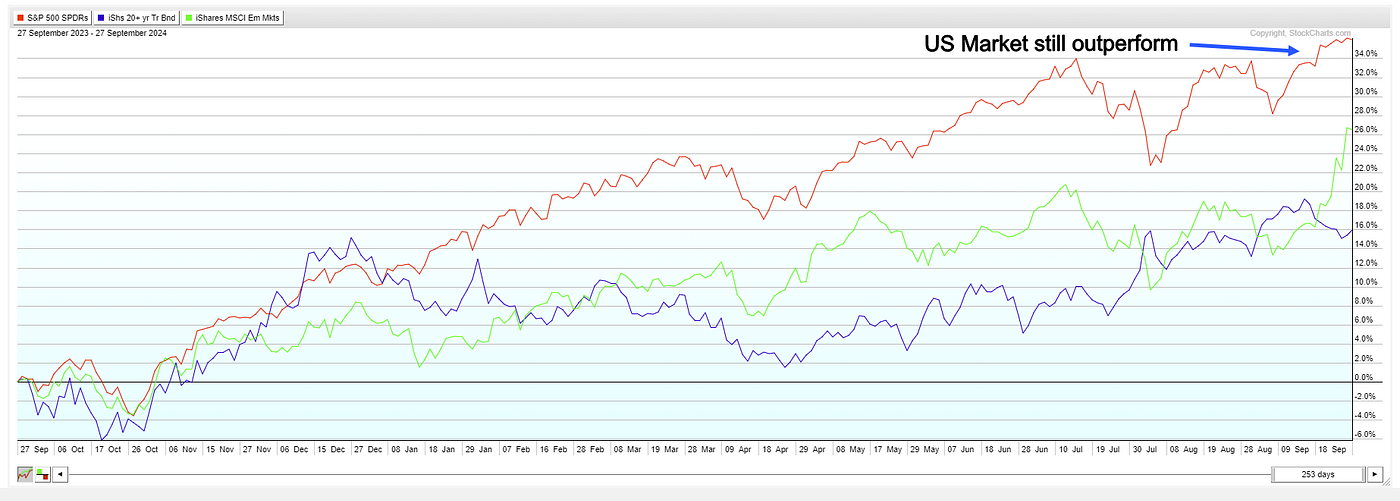
Funds remain in US market
Quick look at the rotation of money: US stocks are still leading the way for September. This means there is low risk in staying invested in the US, even though the election is approaching. However, if you prefer value investing, then emerging market investments through China do make sense after the recent stimulus.
Special Focus: Presidential Election Market Impact
As we approach the November presidential election, investors are increasingly focused on its potential impact on financial markets. In a short-term focus, elections can create volatility and influence sector performance.
Historical Market Volatility During Election Periods
- Pre-Election Uncertainty — Historically, market volatility tends to increase in the months leading up to a presidential election. — The CBOE Volatility Index (VIX) has shown an average increase of 16% in the month preceding elections since World War II.
- Post-Election Resolution — Volatility typically subsides quickly after election day as uncertainty clears. — In the 2020 election, the VIX declined by 36% in the 10 days following the Trump-Biden contest.
- Long-Term Performance — Over the past 80 years, the stock market has been positive from election day through year-end in all but three instances. — The market has shown an average gain of over 10% in the year following presidential elections.
Key Economic Indicators to Watch
As we enter a new week, several important economic indicators are on the horizon. These reports have the potential to significantly impact market sentiment and drive trading activity.
- ISM Services PMI — Date: Wednesday, 02 Oct 2024 — Importance: The services sector, which accounts for a significant portion of the U.S. economy, will be in focus with this report. It provides insights into business activity, new orders, and employment in the services sector.
- Weekly Jobless Claims — Date: Thursday, 03 Oct 2024 — Importance: This high-frequency data point offers a near real-time view of the labor market. Analysts will be watching for any signs of increasing layoffs or continued resilience in employment.
- September Jobs Report — Date: Friday, 04 Oct 2024 — Importance: Forecast to rise by 142,000 — Unemployment Rate: Expected to come in at 4.2% — This report is crucial as it will provide insights into the labor market’s strength and could influence the Federal Reserve’s future policy decisions. A stronger-than-expected report might reignite inflation concerns, while a weaker report could reinforce expectations of further rate cuts.
- Consumer Credit — Date: Friday, 04 Oct 2024 — Importance: Released after the jobs report, this indicator will show changes in consumer borrowing. It can provide insights into consumer confidence and spending patterns.
Trade Idea: GLNG
Golar LNG (GLNG) — Buy
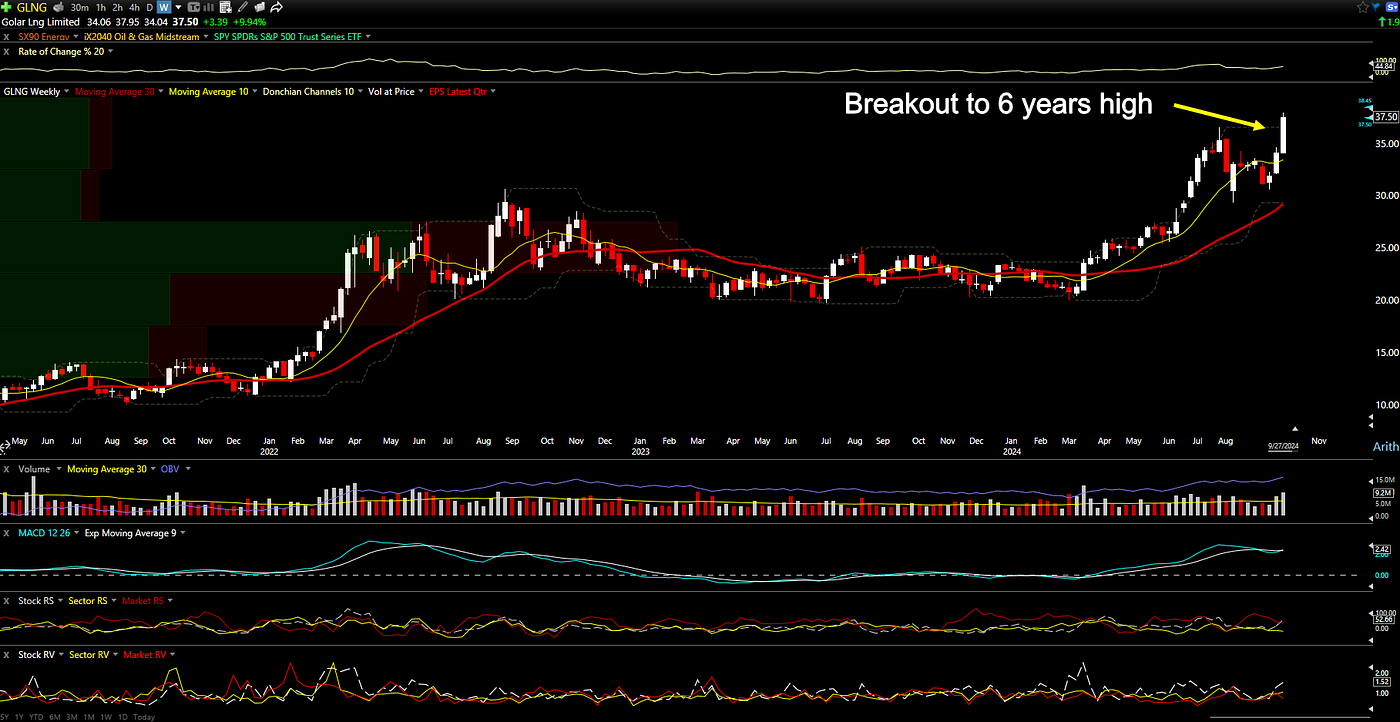
GLNG breaks out to a 6 years high
Who are they?
- Golar LNG (GLNG) is a company that turns natural gas into liquid form, moves it on ships, and provides floating facilities to store and turn it back into gas.
Technical Analysis:
- Breakout on both daily and weekly charts.
- The current price is at a six-year high.
- Volume increased for the breakout, which confirmed the momentum.
- Relative strength and volume are above sector and market.
- ROC is above 30%, confirming the stock is in a trend.
Point of Concern:
- GLNG is an energy stock, and this sector has underperformed throughout 2024.
- It is unclear how much momentum it will have. However, for value investors, this could be a positive aspect.
Trade Outline: This is what’s working for me. Please do your own risk management.
- Entry: $37.50 (or current price)
- Initial stop (depending on how aggressive you are, here are some suggestions): — The low of the breakout week: $34.04 — Below the support level at: $31.23 — 30% from the current price: $26.25
For the trade layout, I will use my normal trading trailing stop rule to determine the position size, which is 30% from the current price:
- Risk 2% of the portfolio (based on a $100,000 account): $2,000
- Stop loss: $26.25
- Risk per share: $37.50 — $26.25 = $11.25
- Number of shares allowed for this trade: $2,000 / $11.25 = 177 shares
- Total cost for the trade: $37.50 * 177 = $6,637.50
Conclusion
- Markets mixed: Dow hit record high (42,313), S&P 500 up 20.3% YTD. Cooling inflation (PCE 2.2% YoY) fuels rate cut optimism.
- Sector performance: Tech and Utilities leading (23%+ YTD), Energy lagging (4% YTD). Small caps struggling to keep pace.
- Election impact: Volatility likely short-term; historically, markets gain 10%+ in year following elections.
- Economic indicators to watch: ISM Services PMI, September jobs report (142K forecast), weekly jobless claims, consumer credit.
- GLNG trade idea: Breakout on high volume, 6-year high. Caveat: Energy sector underperformance in 2024.
- Investment strategy: Maintain US stock exposure; consider emerging markets (especially China) for value plays post-stimulus.
Thank you for joining me this week. Best wishes for everything that you do. Have an enjoyable week, ladies and gents.
If you like what present here, do consider my substack: datnguyenwrite.substack.com
Disclaimer
The information provided here is for educational and entertainment purposes only and should not be construed as financial advice. I am not a licensed financial advisor, and the content presented does not constitute professional financial guidance. Any financial decisions you make should be based on your own research, judgment, and consultation with qualified professionals. The material shared here may not be suitable for all individuals or situations. Always consider your personal circumstances and seek personalized advice from a certified financial expert before making any investment or financial choices.
메타데이터
- post_id
- e9cd4511cb19
- slug
- stock-market-soars-dow-jones-hits-record-high-amid-fed-rate-cuts-and-election-buzz-e9cd4511cb19
- url
- https://medium.com/@datng8/stock-market-soars-dow-jones-hits-record-high-amid-fed-rate-cuts-and-election-buzz-e9cd4511cb19
- canonical_url
- https://medium.com/@datng8/stock-market-soars-dow-jones-hits-record-high-amid-fed-rate-cuts-and-election-buzz-e9cd4511cb19
- author_url
- https://medium.com/@datng8
- status
- ok
- fetched_at
- 2026-07-22 16:32:05




