Active reconnaissance
26.06.2026
Active reconnaissance
26.06.2026
Task 1: Introduction
Active reconnaissance is the process of directly interacting with a target system or network to gather information about it. Passive reconnaissance collects data from public sources without sending any traffic to the target. Active reconnaissance, by contrast, requires transmitting packets, making connections, and probing services. The distinction matters because active techniques leave traces in the form of log entries, IDS alerts, WAF blocks, and honeypot triggers.
Passive reconnaissance involves checking public data such as DNS records, WHOIS results, certificate logs, and Shodan queries without sending packets to the target.
Active reconnaissance involves making direct contact by visiting websites, pinging hosts, tracing routes, and connecting to ports. This can reveal live services, open ports, banners, and network paths, but it leaves footprints.
Learning Objectives
By the end of this room, you will be able to:
- Use a web browser and its Developer Tools to inspect headers, JavaScript source files, and certificates for reconnaissance purposes
- Use
pingto test host reachability and infer operating system details from TTL values - Use
tracerouteandmtrto map network paths and discover intermediate hops - Use
telnetfor legacy banner grabbing and understand why modern alternatives are preferred - Use
netcat(nc) to perform banner grabbing, basic port probing, and simple client-server communication
Task 2: Web Browser
The web browser is one of the most convenient and least suspicious tools for active reconnaissance. It is present on virtually every system, and its traffic blends in with normal user activity. This makes it difficult for defenders to distinguish reconnaissance from legitimate browsing.
Transport-Level Basics
Browsers connect to TCP port 80 by default for plain HTTP, though this is now rare because almost all sites automatically redirect to HTTPS. TCP port 443 is the standard for HTTPS and is used by nearly all websites today.
Many modern sites also support HTTP/3, which uses the QUIC protocol. QUIC is a transport protocol originally developed by Google that combines the functions of TCP and TLS into a single protocol running over UDP port 443. The result is faster and more reliable connections than traditional TCP+TLS. You can identify HTTP/3 traffic in the browser’s Network tab, where the protocol column displays h3.
Developer Tools
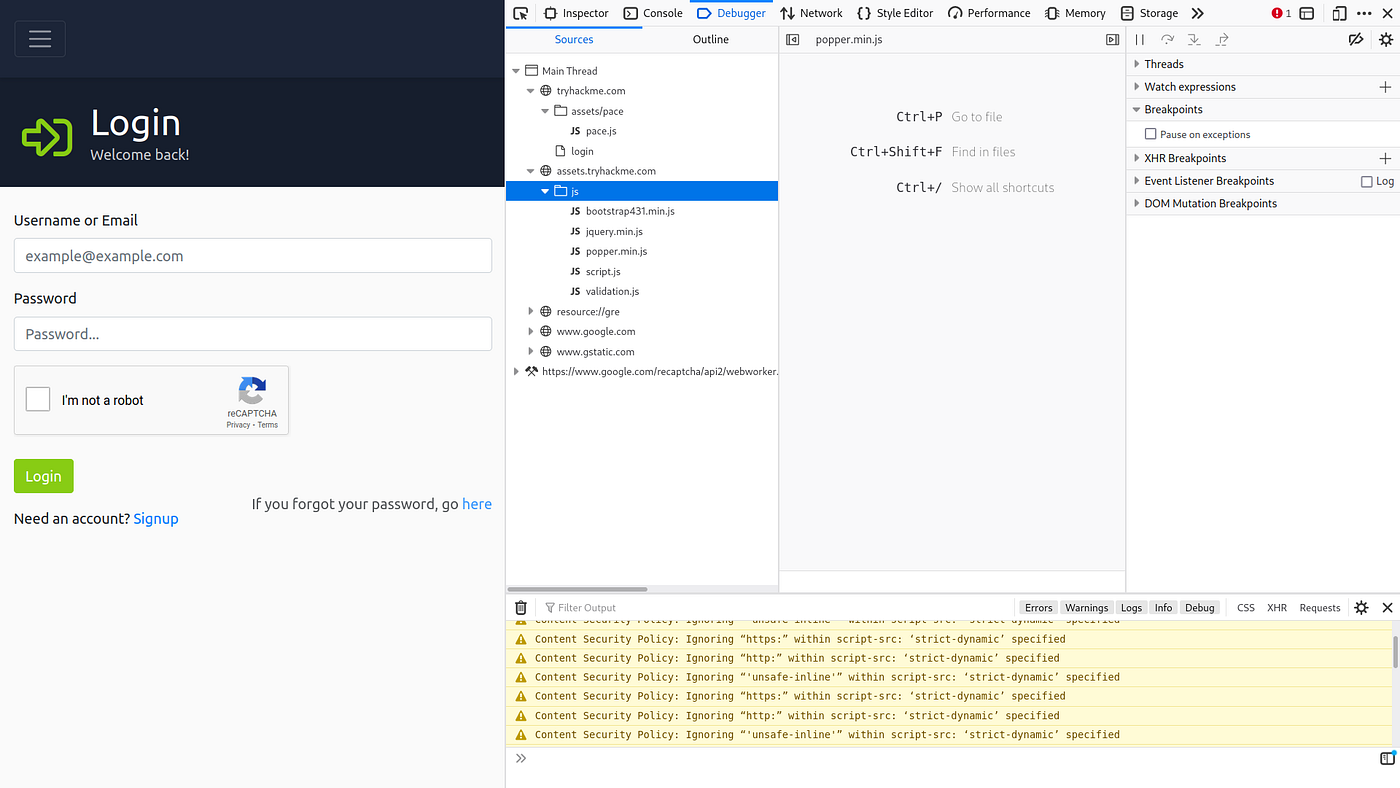
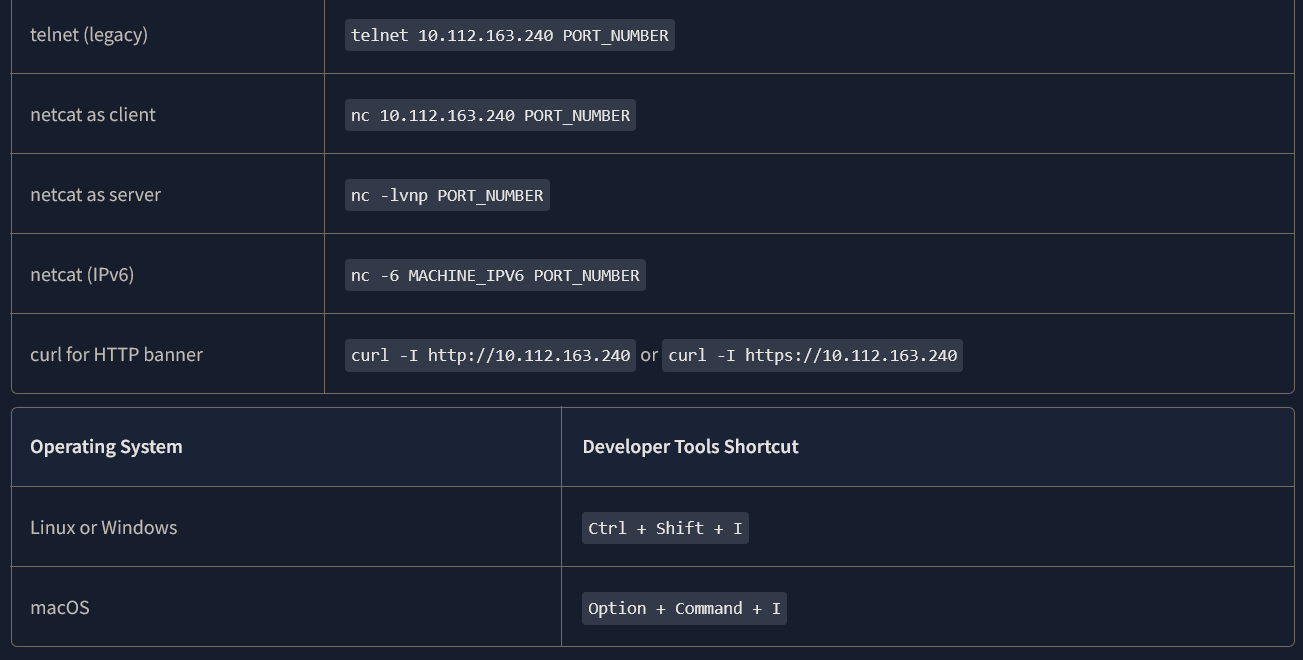
Press Ctrl + Shift + I on Windows and Linux, or Option + Command + I on macOS, in Firefox, Chrome, Edge, or most Chromium-based browsers to open Developer Tools. Several of the tabs available are directly useful for reconnaissance.
The Network tab displays all requests and responses in real time. This includes request and response headers such as Server, X-Powered-By, and Content-Security-Policy, along with timing data, status codes, and cookies sent and received.
The Console tab allows you to execute JavaScript snippets directly in the page context, view errors, and interact with the DOM.
The Sources tab lets you browse JavaScript, CSS, and HTML files loaded by the page. This is one of the most practical reconnaissance techniques available through the browser. JavaScript source files frequently contain hardcoded API endpoints, directory structures, references to internal services, and developer comments that were never intended to be public. Inspecting these files can surface information that is invisible in the rendered page. You will use this technique in the questions below.
The Application tab, under the Storage section, lets you inspect cookies, Local Storage, and Session Storage. These storage areas sometimes contain session tokens, API keys accidentally exposed client-side, tracking IDs, or authentication data.
The Security tab provides certificate details including the issuer, validity period, and Subject Alternative Names (SANs). SANs frequently reveal additional subdomains or related domains belonging to the same organisation.
Below is a screenshot of Firefox Developer Tools. Chrome and Edge provide a very similar interface.
Browser Extensions
Browser extensions can extend the browser into a more capable reconnaissance platform. The following are currently popular and actively maintained.
FoxyProxy (opens in new tab) allows you to switch between proxies such as Burp Suite, Zap, and SOCKS5 tunnels. This is useful when intercepting or routing traffic through different tools during an engagement.
User-Agent Switcher and Manager (opens in new tab) changes the User-Agent string to emulate different browsers, operating systems, or devices. You can present as mobile Safari or an older browser version to discover mobile-specific endpoints or version-specific behaviour. However, many modern WAFs and CDNs detect suspicious or rapid User-Agent changes.
Wappalyzer (opens in new tab) automatically identifies technologies used on the site, including CMS platforms, web servers, JavaScript frameworks, analytics tools, CDNs, and databases. It runs passively while you browse and is one of the most widely used extensions for quick technology fingerprinting.
Answer the questions below
Browse to the following website (opens in new tab) and ensure that you have opened your Developer Tools on AttackBox Firefox, or the browser on your computer. Using the Developer Tools, figure out the total number of questions.
Solution: Inspect the webpage and check the Debugger: script.js
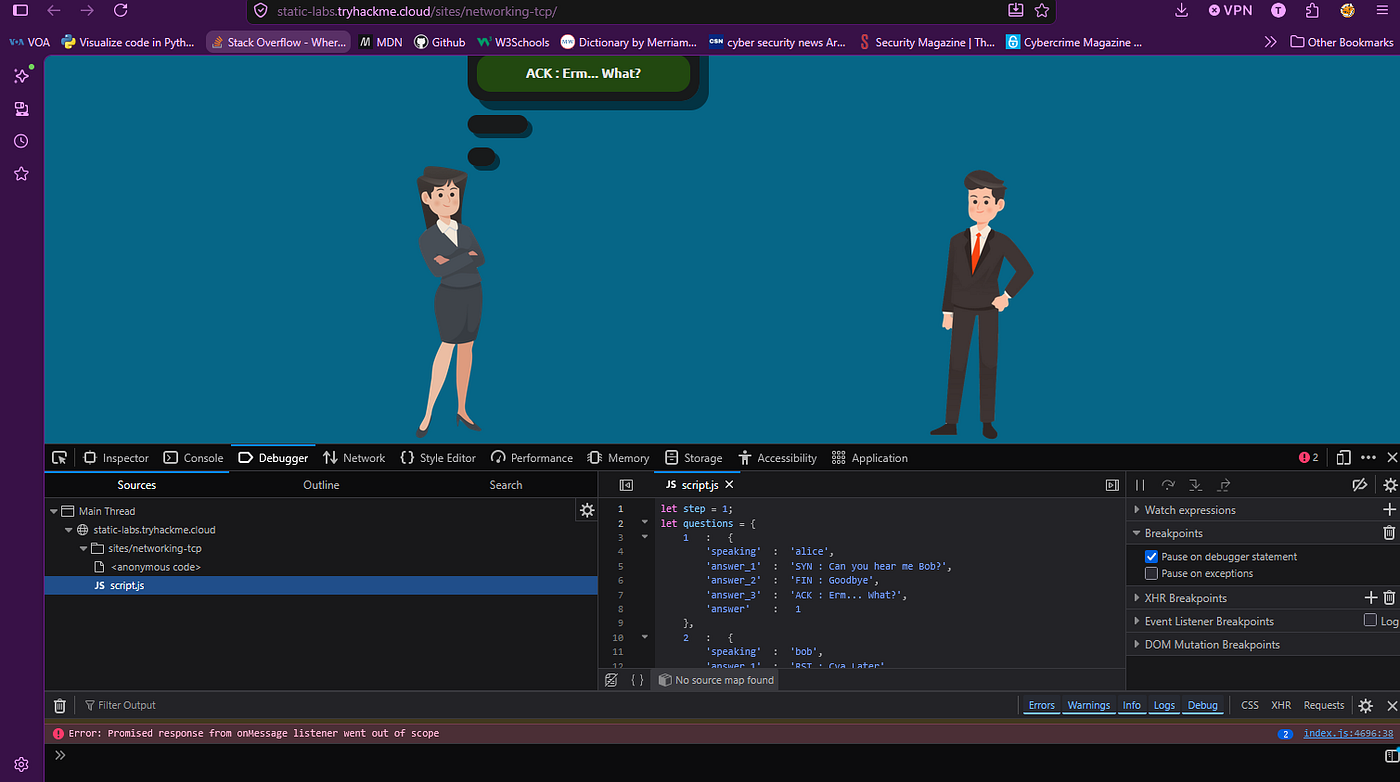
Answer: 8
Task 3: Ping
The name ping comes from the sound of a sonar pulse. You send out a signal and listen for the echo to come back. In networking, the ping command does the same thing. It sends a small test packet to a remote host and waits for a reply. This simple exchange tells you whether the target is reachable over the network and whether it is online and responding.
How Ping Works
Ping uses the ICMP protocol (Internet Control Message Protocol). It sends an ICMP Echo Request packet (type 8). If the target receives the packet and is permitted to answer, it sends back an ICMP Echo Reply (type 0). This exchange is very lightweight and fast, which is why ping became the standard first check before spending time on more detailed scanning.
Basic Usage
On Linux and macOS, use the -c flag to specify the number of packets to send.
ping -c 5 MACHINE_IPYou can also ping a hostname, in which case DNS resolution happens first.
ping -c 5 tryhackme.comOn Windows, the equivalent flag is -n.
ping -n 5 MACHINE_IPIf you omit the count on Linux, ping runs indefinitely. Press Ctrl+C to stop it.
nterpreting the Output: Successful Ping
The following example shows a target that is alive and allows ICMP.
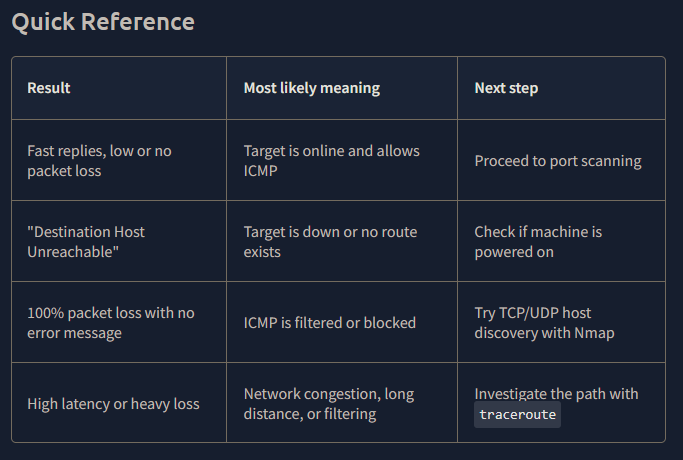
user@AttackBox$ ping -c 5 MACHINE_IP
PING MACHINE_IP (MACHINE_IP) 56(84) bytes of data.
64 bytes from MACHINE_IP: icmp_seq=1 ttl=64 time=0.512 ms
64 bytes from MACHINE_IP: icmp_seq=2 ttl=64 time=0.478 ms
64 bytes from MACHINE_IP: icmp_seq=3 ttl=64 time=0.491 ms
64 bytes from MACHINE_IP: icmp_seq=4 ttl=64 time=0.503 ms
64 bytes from MACHINE_IP: icmp_seq=5 ttl=64 time=0.485 ms
--- MACHINE_IP ping statistics ---
5 packets transmitted, 5 received, 0% packet loss, time 4098ms
rtt min/avg/max/mdev = 0.478/0.494/0.512/0.012 msThe target answered all five requests, confirming it is online and reachable. The 0% packet loss confirms a clean network path. The round-trip time of approximately 0.5 ms is very low, indicating the target is likely on the same local network.
The TTL (Time To Live) field deserves particular attention. TTL Although “Time” appears in the name, actually represents the maximum number of routers (hops) a packet can pass through before being dropped. Each router along the path decrements the TTL by one. The initial TTL value is set by the operating system, which makes it a useful indicator for OS fingerprinting. Linux typically uses a starting TTL of 64, while Windows typically uses 128.
Qn: Which option would you use to set the size of the data carried by the ICMP echo request?
Answer: -s
Qn: What is the size of the ICMP header in bytes?
Answer: 8
Qn: Does MS Windows Firewall block ping by default? (Y/N)
Answer: Y
Qn: Deploy the VM for this task and using the AttackBox terminal, issue the command ping -c 10 10.112.160.201. How many ping replies did you get back?
Answer: 10
Task 4: Traceroute
The traceroute command traces the route that packets take from your system to a target host. Its purpose is to discover the IP addresses of the routers (hops) along the path and to determine how many of them sit between you and the destination. This information is useful for understanding network topology, identifying where filtering or latency occurs, and mapping infrastructure.
However, the route packets take is not fixed. Many routers use dynamic routing protocols such as BGP or OSPF that adapt to network changes. Modern networks also employ load balancing and anycast routing, meaning packets can take different paths even in consecutive runs of the same command.
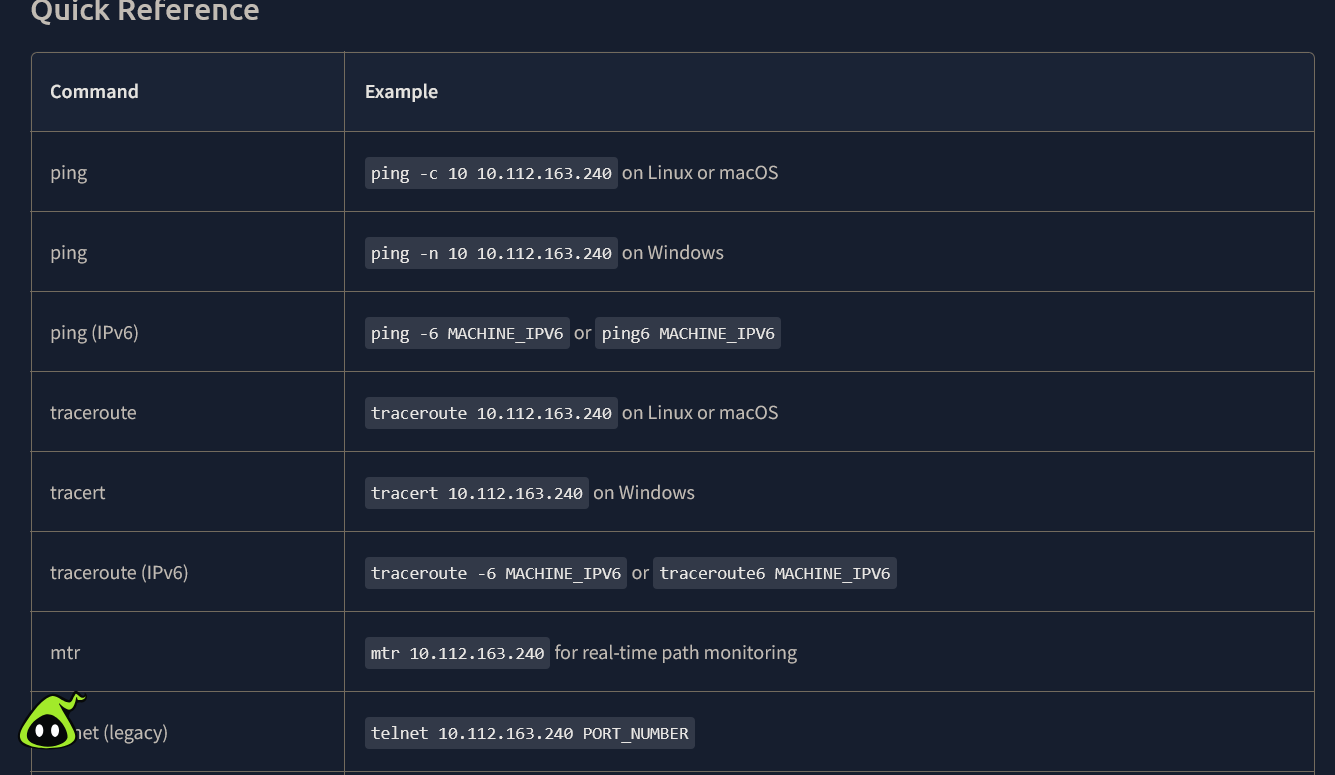
On Linux and macOS, the command is traceroute 10.113.155.185. On Windows, it is tracert 10.113.155.185. For IPv6, use traceroute -6 MACHINE_IPV6 or the standalone traceroute6 command.
How Traceroute Works
There is no direct way to discover the full path from your system to a target. Instead, traceroute exploits the TTL (Time To Live) field in the IP header. Each router that handles a packet decrements the TTL by one before forwarding it. When the TTL reaches 0, the router drops the packet and sends an ICMP Time-to-Live Exceeded message back to the sender.
The following diagram illustrates a packet leaving a system with a TTL of 64. After passing through four routers, each decrementing the TTL by one, the packet arrives at the target with a TTL of 60.
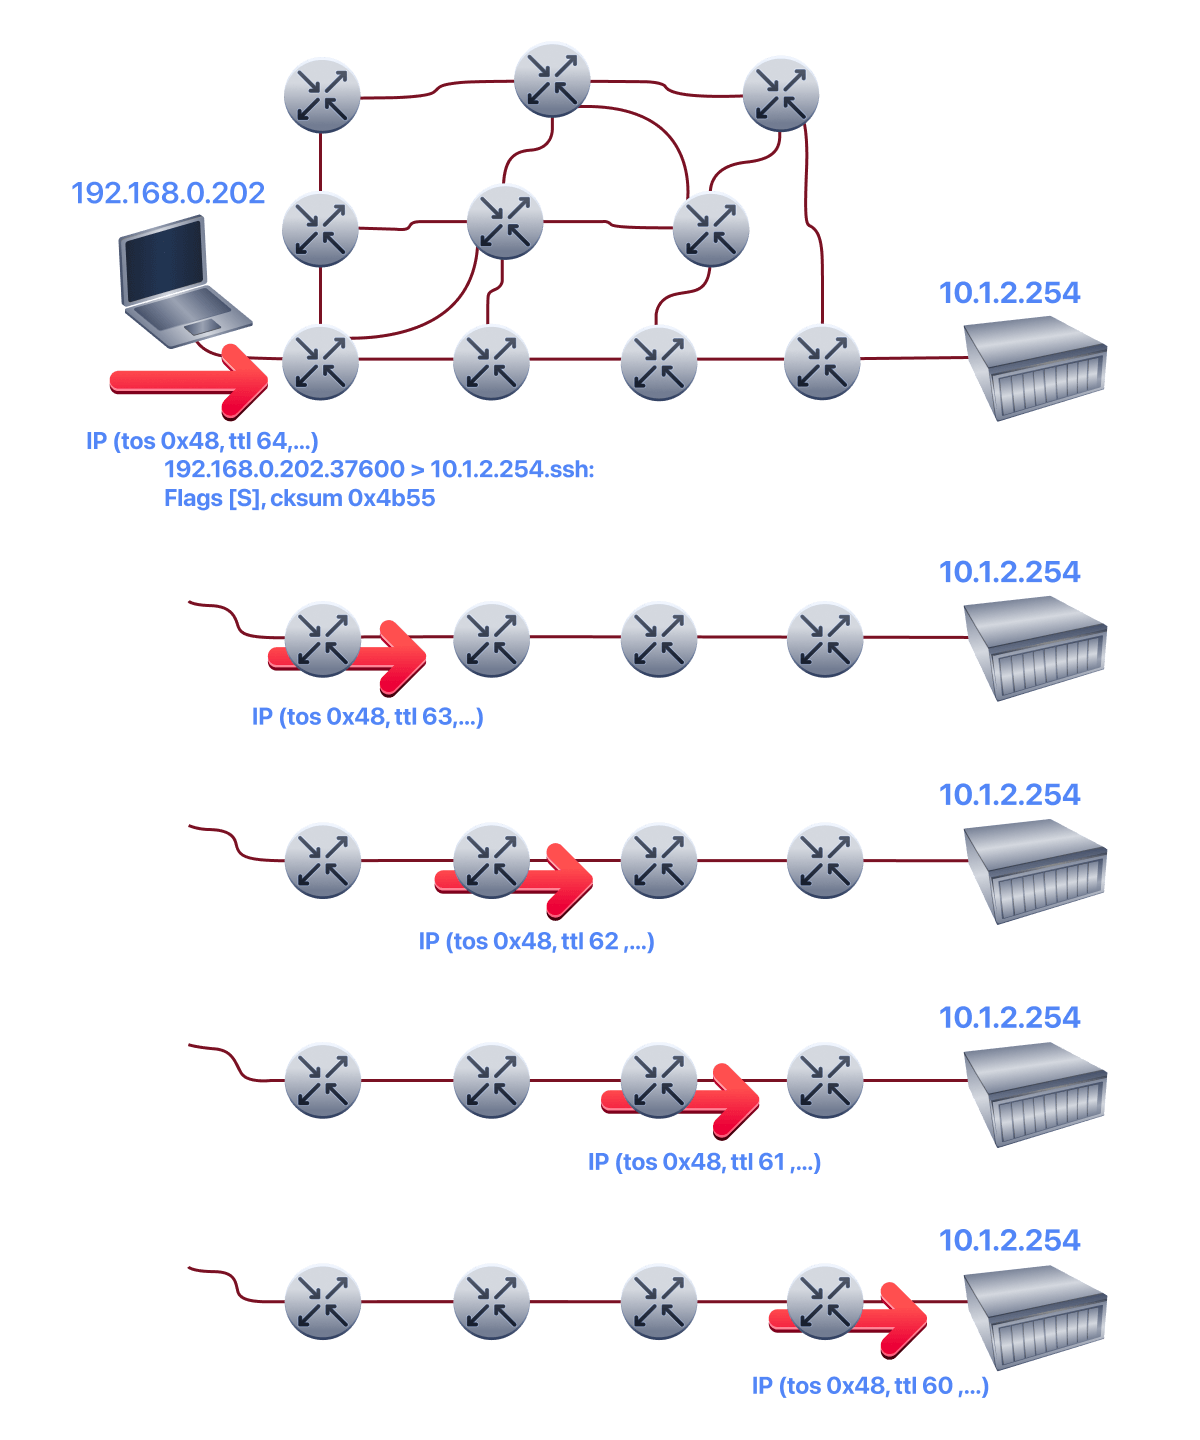
Some routers are configured not to send ICMP Time-to-Live Exceeded messages. This is common in secure environments intended to prevent reconnaissance. These routers appear as * in the traceroute output.
On Linux, traceroute sends UDP datagrams by default. To switch to TCP-based tracing, which is useful for bypassing UDP filters, use traceroute -T 10.113.155.185. For ICMP-based tracing, use traceroute -I 10.113.155.185.
Reading the Output
The following two examples show traceroute tryhackme.com run twice from TryHackMe's AttackBox. They demonstrate how routes can change between consecutive runs.
Traceroute A
user@AttackBox$ traceroute tryhackme.com
traceroute to tryhackme.com (172.67.69.208), 30 hops max, 60 byte packets
 1 ec2-3-248-240-5.eu-west-1.compute.amazonaws.com (3.248.240.5) 2.663 ms * ec2-3-248-240-13.eu-west-1.compute.amazonaws.com (3.248.240.13) 7.468 ms
 2 100.66.8.86 (100.66.8.86) 43.231 ms 100.65.21.64 (100.65.21.64) 18.886 ms 100.65.22.160 (100.65.22.160) 14.556 ms
 3 * 100.66.16.176 (100.66.16.176) 8.006 ms *
 4 100.66.11.34 (100.66.11.34) 17.401 ms 100.66.10.14 (100.66.10.14) 23.614 ms 100.66.19.236 (100.66.19.236) 17.524 ms
 5 100.66.7.35 (100.66.7.35) 12.808 ms 100.66.6.109 (100.66.6.109) 14.791 ms *
 6 100.65.14.131 (100.65.14.131) 1.026 ms 100.66.5.189 (100.66.5.189) 19.246 ms 100.66.5.243 (100.66.5.243) 19.805 ms
 7 100.65.13.143 (100.65.13.143) 14.254 ms 100.95.18.131 (100.95.18.131) 0.944 ms 100.95.18.129 (100.95.18.129) 0.778 ms
 8 100.95.2.143 (100.95.2.143) 0.680 ms 100.100.4.46 (100.100.4.46) 1.392 ms 100.95.18.143 (100.95.18.143) 0.878 ms
 9 100.100.20.76 (100.100.20.76) 7.819 ms 100.92.11.36 (100.92.11.36) 18.669 ms 100.100.20.26 (100.100.20.26) 0.842 ms
10 100.92.11.112 (100.92.11.112) 17.852 ms * 100.92.11.158 (100.92.11.158) 16.687 ms
11 100.92.211.82 (100.92.211.82) 19.713 ms 100.92.0.126 (100.92.0.126) 18.603 ms 52.93.112.182 (52.93.112.182) 17.738 ms
12 99.83.69.207 (99.83.69.207) 17.603 ms 15.827 ms 17.351 ms
13 100.92.9.83 (100.92.9.83) 17.894 ms 100.92.79.136 (100.92.79.136) 21.250 ms 100.92.9.118 (100.92.9.118) 18.166 ms
14 172.67.69.208 (172.67.69.208) 17.976 ms 16.945 ms 100.92.9.3 (100.92.9.3) 17.709 ms
This output contains 14 numbered lines, each representing one hop. The system sends three packets at each TTL value, which is why you see up to three IP addresses and three round-trip times per line. Some lines show different IP addresses for the same hop number because load balancing caused each of the three packets to take a slightly different path.
Additional Techniques
Use mtr 10.113.155.185 (My Traceroute) for a real-time, continuous view that combines traceroute with ping-like statistics, showing packet loss and latency per hop. For bypassing filters, try TCP mode with traceroute -T 10.113.155.185 or ICMP mode with traceroute -I 10.113.155.185. For IPv6, the standalone traceroute6 command ensures compatibility with dual-stack networks.
Answer the questions below
Qn: In Traceroute A, what is the IP address of the last router/hop before reaching tryhackme.com?
Answer: 172.67.69.208
Qn: In Traceroute B, what is the IP address of the last router/hop before reaching tryhackme.com?
Answer: 104.26.11.229
Qn: In Traceroute B, how many routers are between the two systems?
Answer: 25
Qn: Start the attached VM from Task 3 if it is not already started. On the AttackBox, run traceroute 10.113.155.185. Check how many routers/hops are there between the AttackBox and the target VM.
No answer is needed.
Task 5: Telnet
The TELNET (Teletype Network) protocol was developed in 1969 to communicate with a remote system via a command-line interface. The telnet command uses this protocol for remote administration, with a default port of 23. From a security perspective, telnet sends all data in cleartext, including usernames and passwords. This makes it trivial for anyone with access to the communication channel to intercept login credentials. The secure alternative is SSH (Secure Shell), which encrypts all traffic and is the standard for remote CLI access today.
Despite its security shortcomings, the telnet client has a useful property for reconnaissance. Because it operates over TCP, you can use it to connect to any TCP port and observe the server’s response. This technique is known as banner grabbing. You connect to a service and read the initial response, called the “banner”, that the server sends back. Banners frequently reveal the software name and version running on that port.
If telnet is not installed on your system, you can install it on Debian and Ubuntu with apt install telnet. However, netcat (nc) and curl are generally preferred alternatives that provide similar functionality with more flexibility.
The example below demonstrates banner grabbing against a web server on port 80. You connect with telnet 10.113.165.66 80, then issue a minimal HTTP request. The command GET / HTTP/1.1 followed by host: example and two presses of the Enter key is sufficient to elicit a response.
Note: The terminal output below uses an example web server running nginx for illustration purposes. The VM attached to this task runs a different web server. When you perform the exercise, your output will differ from this example.
pentester@TryHackMe$ telnet 10.113.165.66 80
Trying 10.113.165.66...
Connected to 10.113.165.66.
Escape character is '^]'.
GET / HTTP/1.1
host: telnet

HTTP/1.1 200 OK
Server: nginx/1.6.2
Date: Tue, 17 Aug 2021 11:13:25 GMT
Content-Type: text/html
Content-Length: 867
Last-Modified: Tue, 17 Aug 2021 11:12:16 GMT
Connection: keep-alive
ETag: "611b9990-363"
Accept-Ranges: bytes
...
The field of interest here is Server: nginx/1.6.2, which reveals the type and version of the web server software. This is exactly the kind of information that active reconnaissance aims to uncover. Software versions can be cross-referenced against known vulnerabilities in databases such as CVE and Exploit-DB.
This same banner-grabbing technique works against any TCP-based service. If you connect to a mail server, you would use SMTP or POP3 commands instead of HTTP. If you connect to an FTP server on port 21, the server typically sends its banner immediately upon connection without requiring any commands at all. The underlying principle is always the same. Connect to the port, read what the server sends back, and optionally issue protocol-specific commands to extract further information.
In modern environments, many services enforce encryption. For example, SMTPS runs on port 465, and HTTPS runs on port 443. Telnet cannot handle encrypted connections. For HTTPS, use curl --head https://10.113.165.66 or openssl s_client -connect 10.113.165.66:443. For other TLS-wrapped services, openssl s_client or ncat --ssl are the appropriate tools.
Answer the questions below
Qn: Start the attached VM from Task 3 if it is not already started. On the AttackBox, open the terminal and use the telnet client to connect to the VM on port 80. What is the name of the running server?
Answer: Apache
Qn: What is the version of the running server (on port 80 of the VM)?
use the following command and replace the IP Address:
curl -i http://10.113.165.66/ | sed -n '1,20p'Answer: 2.4.61
Task 6: Netcat
Netcat (or simply nc) is a versatile networking utility that supports both TCP and UDP protocols. It can function as a client that connects to a listening port, or as a server that listens on a port of your choice. This dual capability makes it useful for banner grabbing, port probing, simple file transfers, and basic client-server communication. Modern versions such as ncat from the Nmap project also support IPv6 and SSL encryption, making it more versatile than legacy tools like telnet.
Banner Grabbing with Netcat
The banner-grabbing technique described in the previous task works identically with nc. The syntax is nc 10.112.163.240 PORT. You connect to the target port, then issue protocol-appropriate commands to read the server's response. Note that you might need to press Shift+Enter after the GET line.
In this example, nc 10.112.163.240 80 opens a TCP connection to port 80. The HTTP request GET / HTTP/1.1 followed by host: netcat produces a response that includes Server: nginx/1.6.2, revealing the web server software and version.
This same approach applies to any TCP-based service. Connecting to an FTP server on port 21 with nc 10.112.163.240 21 will typically produce an immediate banner showing the server software and version without requiring any commands. Connecting to an SMTP server on port 25 produces a banner identifying the mail server. The principle is consistent across protocols. Connect, read the banner, and optionally issue protocol-specific commands.
Listening with Netcat
Netcat can also act as a server, listening on a specified port. This is useful for testing connectivity, transferring simple data, or setting up basic communication channels during an engagement.
On the server system, run nc -vnlp 1234 to start listening on port 1234. On the client system, run nc 10.112.163.240 1234 to connect. Once the connection is established, any text typed on one side is transmitted to the other. As you may recall from the Linux Fundamentals module, the exact order of the flags does not matter as long as the port number is preceded directly by -p.
The -p flag must appear directly before the port number. The -n flag avoids DNS lookups and associated warnings. Port numbers below 1024 require root privileges to listen on. For IPv6 listening, add the -6 flag with nc -6 -lp 1234. If you need encryption for sensitive data transfer, use ncat --ssl or pair nc with a tool like stunnel.
Answer the questions below
Qn: Start the VM and open the AttackBox. Once the AttackBox loads, use Netcat to connect to the VM port 21. What is the version of the running server?
Use this command:
nc -nv 10.112.163.240 21Answer: 0.17
Task 7: Putting it All Together
This room covered five core tools for active reconnaissance. The web browser with Developer Tools reveals server technologies, headers, JavaScript sources, and certificate details. ping confirms whether a target is reachable and provides TTL-based clues about its operating system. traceroute maps the network path between you and the target, revealing intermediate routers and potential filtering points. telnet and netcat connect to individual ports to grab banners and identify running services along with their versions.
These tools are simple individually, but combining them gives you a structured picture of a target before moving on to more advanced scanners. You might use ping to confirm a host is alive, traceroute to understand the network path, and then nc to probe specific ports and identify services. For HTTP-based services, prefer curl -I 10.112.163.240 or nc 10.112.163.240 PORT over telnet for banner grabbing, as they provide more secure and flexible options
Next Steps
The tools covered in this room represent the foundation of active reconnaissance.
Follow me for more good information and walkthrough on
Linkedin: https://www.linkedin.com/in/rotimi-ishola/
and
메타데이터
- post_id
- e9f4ffdd39e8
- slug
- active-reconnaissance-e9f4ffdd39e8
- url
- https://medium.com/@timiphil9/active-reconnaissance-e9f4ffdd39e8
- canonical_url
- https://medium.com/@timiphil9/active-reconnaissance-e9f4ffdd39e8
- author_url
- https://medium.com/@timiphil9
- status
- ok
- fetched_at
- 2026-08-01 07:12:28