Building a Retail Inventory & Sales Performance Dashboard Using SQL and Tableau
Introduction
Building a Retail Inventory & Sales Performance Dashboard Using SQL and Tableau
Introduction
As part of my journey toward becoming a Data Analyst, I wanted to work on a project that combined SQL, business analysis, and data visualization. Rather than focusing only on technical skills, I wanted to answer real business questions that retail companies face every day.
In this project, I analyzed retail inventory and sales data using MySQL and created an interactive Tableau dashboard to uncover insights related to revenue performance, inventory optimization, demand forecasting, and promotional effectiveness.
Project Objective
The goal of this project was to answer several key business questions:
- Which regions generate the highest revenue?
- Which products contribute the most to sales?
- Which products require restocking?
- Which products may be overstocked?
- How accurate are demand forecasts?
- Do promotions significantly impact sales?
By answering these questions, businesses can make better decisions regarding inventory management and sales strategy.
Dataset
The dataset contains retail inventory and sales information, including:
- Product ID
- Category
- Region
- Inventory Level
- Units Sold
- Revenue
- Demand Forecast
- Promotion Status
This data provides a good foundation for analyzing both sales performance and inventory health.
SQL Analysis
I used MySQL to perform exploratory data analysis and answer business questions.
Some of the analyses included:
Revenue by Region
This analysis helped identify which regions contribute the most revenue to the business.
SELECT region,
       ROUND(SUM(revenue),2) AS total_revenue
FROM retail_store_inventory_dataset
GROUP BY region
ORDER BY total_revenue DESC;
Top Products by Revenue
Understanding top-performing products is essential for sales planning and inventory allocation.
SELECT product_id,
       SUM(revenue) AS total_revenue
FROM retail_store_inventory_dataset
GROUP BY product_id
ORDER BY total_revenue DESC
LIMIT 10;
Products Requiring Restocking
Products with low inventory and high sales may need immediate attention to avoid stockouts.
Forecast Error Analysis
Comparing actual sales with forecasted demand helps evaluate forecasting accuracy and improve planning processes.
Building the Tableau Dashboard
After completing the SQL analysis, I imported the dataset into Tableau and built an interactive dashboard.
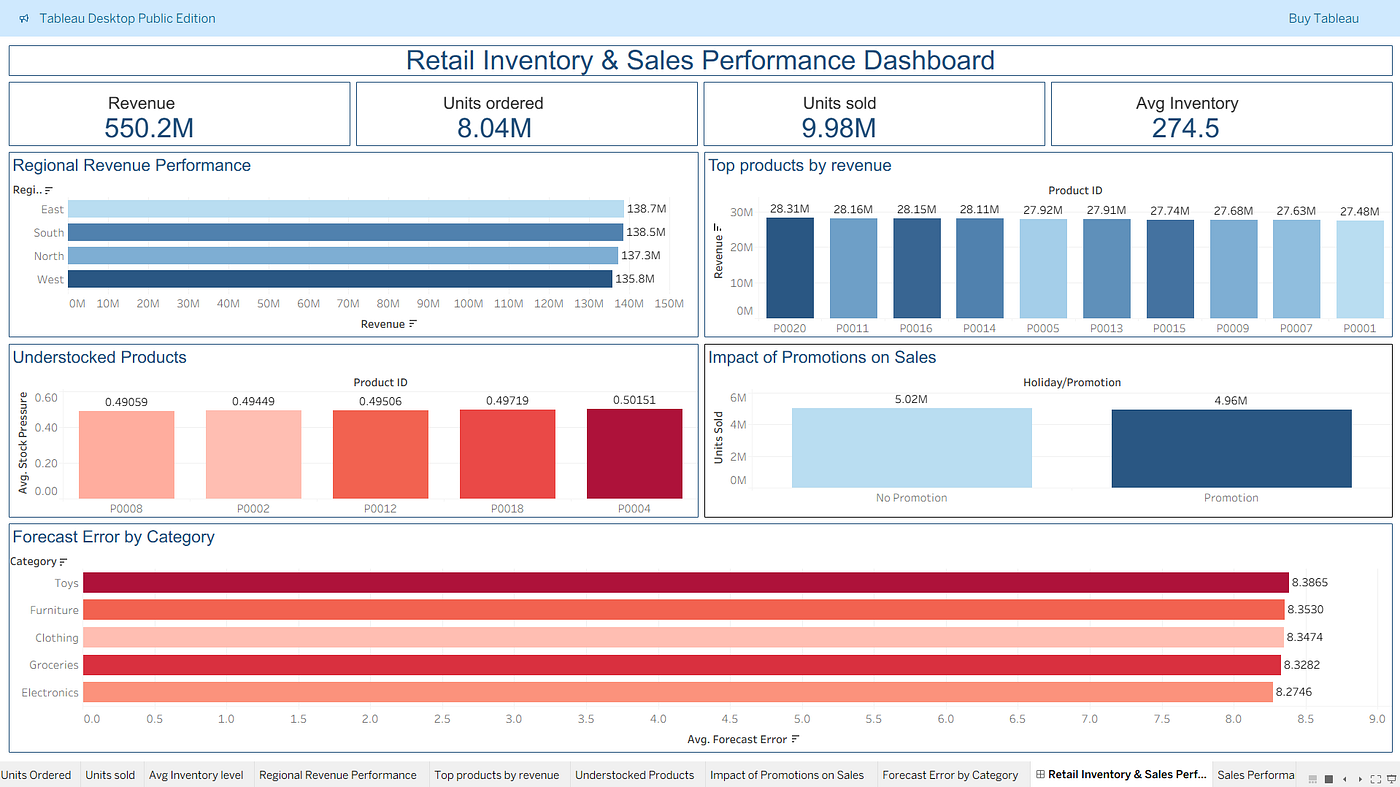
The dashboard includes:
KPI Cards
- Total Revenue
- Total Units Sold
- Average Inventory Level
- Forecast Accuracy
Visualizations
- Regional Revenue Performance
- Top 10 Products by Revenue
- Products Requiring Restocking
- Forecast Error by Category
- Promotion Impact on Sales
The goal was to create a dashboard that provides both executive-level summaries and actionable operational insights.
Key Insights
1. Revenue Distribution Varies Across Regions
Certain regions generated significantly higher revenue, indicating stronger market performance and customer demand.
2. A Small Number of Products Drive Revenue
The top-performing products contributed a large portion of total revenue, highlighting the importance of monitoring these products closely.
3. Inventory Risks Were Identified
Several products showed signs of being understocked, creating a potential risk of lost sales due to stockouts.
4. Forecast Accuracy Differs Across Categories
Some categories exhibited larger forecast errors, suggesting opportunities to improve demand planning models.
5. Promotions Influence Sales Performance
Promotional campaigns generally resulted in increased sales volume, demonstrating their impact on customer purchasing behavior.
Challenges Faced
While building this project, I encountered a few challenges:
- Learning how to translate business questions into SQL queries.
- Designing a dashboard that was informative without becoming cluttered.
- Selecting the most meaningful visualizations from multiple possible options.
- Organizing the project for GitHub and Tableau Public publication.
These challenges helped strengthen both my technical and analytical thinking skills.
What I Learned
This project reinforced several important concepts:
- Writing SQL queries based on business requirements.
- Using aggregations and grouping effectively.
- Designing dashboards that tell a clear business story.
- Communicating insights through data visualization.
- Publishing and documenting projects professionally.
Conclusion
This project was an excellent opportunity to combine SQL analysis with Tableau dashboard development. More importantly, it helped me think like an analyst by focusing on business questions rather than simply creating charts.
I plan to continue building additional analytics projects to improve my skills in SQL, Tableau, Excel, and business intelligence.
Project Links
Tableau Dashboard: [Retail Inventory & Sales Performance Dashboard]
GitHub Repository: [Retail Inventory & Sales Performance Repository]
Thank you for reading. Feedback and suggestions are always welcome.
메타데이터
- post_id
- eac475a6904e
- slug
- building-a-retail-inventory-sales-performance-dashboard-using-sql-and-tableau-eac475a6904e
- url
- https://medium.com/@itsashwinr/building-a-retail-inventory-sales-performance-dashboard-using-sql-and-tableau-eac475a6904e
- canonical_url
- https://medium.com/@itsashwinr/building-a-retail-inventory-sales-performance-dashboard-using-sql-and-tableau-eac475a6904e
- author_url
- https://medium.com/@itsashwinr
- status
- ok
- fetched_at
- 2026-06-23 17:05:31




