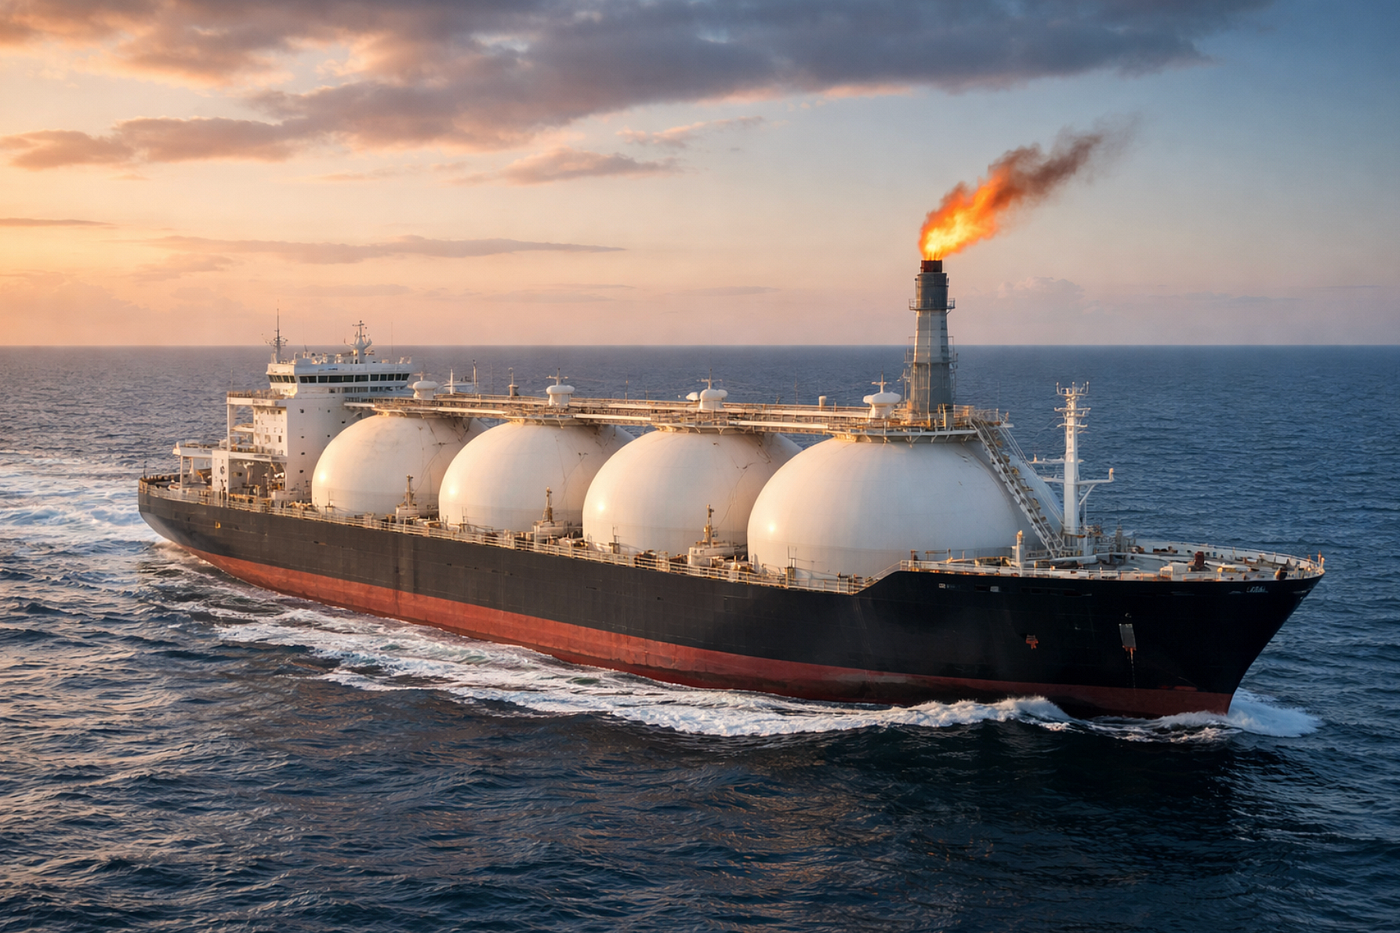
Strait of Hormuz: how potential blockade could affect oil prices
Events in the Persian Gulf pose a real threat of a partial or complete blockade of the Strait of Hormuz, a critical hub in global oil…
Strait of Hormuz: how potential blockade could affect oil prices

Events in the Persian Gulf pose a real threat of a partial or complete blockade of the Strait of Hormuz, a critical hub in global oil logistics.
Approximately 20–21 million barrels of oil per day pass through the strait. These barrels cannot be instantly compensated by alternative routes or strategic reserves. Even a minor disruption triggers a chain reaction: slower deliveries → higher insurance premiums → increased freight costs → local shortages.
Data for analysis
In this study, we refer to the figure provided by the International Energy Agency (Strait of Hormuz Factsheet, IEA, 2025), which indicates a daily throughput of around 20–21 million barrels. Actual volumes may be higher, as open statistics do not capture ship‑to‑ship (S2S) transfers, private deals, or alternative routes.
Price Elasticity of Demand
To estimate how supply disruptions affect price, we need to understand price elasticity of demand.
Price elasticity of demand measures how sensitive consumption is to changes in price:

Where ΔQ/Q is the relative change in consumption and ΔP/P is the relative change in price.
If |ε| < 1, demand is inelastic: consumption hardly decreases when price rises. For the short-term oil market, experts use |ε| ≈ 0.05–0.1. This means consumers cannot quickly reduce oil usage, so even small supply disruptions cause sharp price increases.
Example: if 10% of supply is lost and ε = −0.1, the price must rise roughly 100% to reduce consumption by that amount.
Calculating potential price impact
Baseline: Brent = $62/barrel, global consumption ≈ 100 million b/d
Scenarios:
Partial blockade (50% of throughput, 10 million b/d)

Expected Brent price: $124–186 (including freight and insurance risk premiums).
Full Blockade (100% of throughput, 20 million b/d)

Expected Brent price: $186–310
Disclaimer: the upper price range represents a theoretical maximum, not a market forecast. Strategic reserves, tanker flows, and arbitrage limit actual price spikes.
Why price does not jump instantly
It is important to distinguish between theoretical price levels and market dynamics. Elasticity-based calculations describe the upper-bound equilibrium price under a given supply loss — not the immediate market reaction.
The physical oil market is inertial. Contracts, inventories, shipping schedules, insurance, and alternative routing introduce a time lag between a supply shock and full price realization.
Historically, even severe geopolitical disruptions unfolded over days and weeks, not in a single tick.
Historical precedents
1973 — Arab Oil Embargo Oil prices increased roughly fourfold, but not instantly. The main move took 3–4 months, as the market gradually recognized the scale of the deficit and inventories were drawn down.
1979 — Iranian Revolution About 5% of global supply was lost. Prices rose by more than 150% over 6–8 months, with sharp jumps after it became clear that the disruption would be prolonged.
2019 — Saudi Aramco (Abqaiq) attack Roughly 5.7 million b/d were temporarily removed from the market. Brent opened with a ~15% gap in one day, but further upside was capped by the rapid restoration of production.
Conclusion: markets first price in expectations and risk, and only later fully reprice based on confirmed physical shortages and duration of disruption.
Historical precedents show a consistent pattern: prices rise not because of headlines, but because fewer barrels physically reach the market.
As tanker traffic slows, queues build up, insurance and freight costs increase, and confirmed supply losses emerge, the market reprices oil step by step.
In other words: fewer tankers passing through the strait → less physical supply → higher marginal price required to balance demand.
This allows us to move from historical examples to a condition-based pricing framework, where each price range corresponds to observable, verifiable signals — not to a fixed timeline.
Price evolution under partial blockade

Full blockade scenario (20 mb/d) — stress case

Conclusions
- Throughput through the Strait of Hormuz is material for global balance. Around 20–21 mb/d of crude and condensate flows through the strait. Any sustained reduction directly lowers available physical supply to the market.
- Short-term oil demand is weakly responsive to price changes. With short-run price elasticity |ε| ≈ 0.05–0.1, a given supply loss requires a disproportionately large price increase to restore market balance.
- Elasticity-based calculations define equilibrium levels, not timing. The price levels implied by elasticity reflect the theoretical clearing price under a given supply deficit, not the immediate market reaction.
- Observed price adjustments depend on confirmation of physical loss and duration. Historical cases show that prices adjust as supply losses are verified, inventories decline, and expectations about disruption length stabilize.
- Upper price ranges correspond to low-probability, high-impact conditions. Prices above $200/bbl require confirmation of near-total throughput loss, limited mitigation capacity, and disruption persistence measured in weeks rather than days.
For questions or discussion, reach out on LinkedIn. We track this in real-time at oilradar.io
메타데이터
- post_id
- eaf4c849022b
- slug
- strait-of-hormuz-how-potential-blockade-could-affect-oil-prices-eaf4c849022b
- url
- https://medium.com/@somewho/strait-of-hormuz-how-potential-blockade-could-affect-oil-prices-eaf4c849022b
- canonical_url
- https://medium.com/@somewho/strait-of-hormuz-how-potential-blockade-could-affect-oil-prices-eaf4c849022b
- author_url
- https://medium.com/@somewho
- status
- ok
- fetched_at
- 2026-07-14 16:56:33