Financial Astrology for Swing Trading: Using Charts, Cycles, and Risk Management
Swing trading sits between fast intraday execution and long-term investing. It is not about catching every tick, and it is not about…
Financial Astrology for Swing Trading: Using Charts, Cycles, and Risk Management
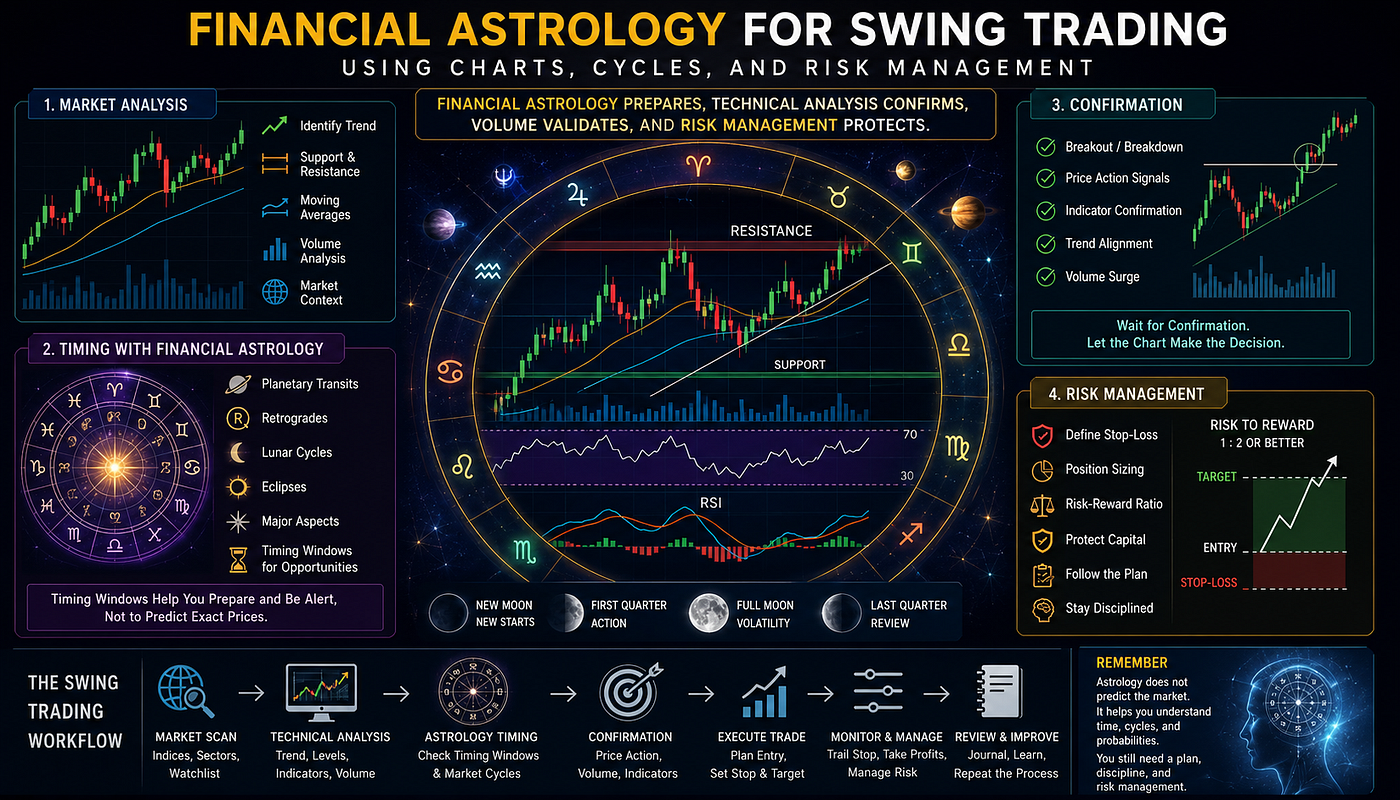
Swing trading sits between fast intraday execution and long-term investing. It is not about catching every tick, and it is not about holding a position for years through every market cycle. Instead, swing trading focuses on capturing meaningful price moves that usually unfold over several days to several weeks. A swing trader studies trend structure, support and resistance, momentum, volume, market sentiment, and risk-reward before entering a trade.
Financial astrology can add another layer to this process. It does not replace technical analysis, market data, volume confirmation, or risk management. It helps traders think about timing windows, emotional cycles, volatility phases, and market rhythm. When used carefully, financial astrology can help a swing trader prepare for periods when price movement may become more active, uncertain, or trend-friendly.
The core principle is simple: Financial astrology prepares, technical analysis confirms, volume validates, and risk management protects.
This means a trader should never buy or sell only because of a planetary cycle. A timing window may suggest that market energy is changing, but the chart must confirm that shift. Price must break a level, hold a zone, form a reversal pattern, or continue a trend. Volume should support the move. Risk must stay controlled through stop-loss placement, position sizing, and clear trade planning.
For swing traders, this combination can be useful because timing matters. Entering a good stock or index too early can lead to unnecessary drawdowns. Entering too late can reduce the risk-reward ratio. Exiting without discipline can turn a profitable setup into a missed opportunity. Financial astrology, when used as a timing layer, can help traders become more aware of windows when markets may be more sensitive to news, sentiment, and momentum shifts.
What Is Swing Trading?
Swing trading is a trading style that aims to profit from short-to-medium-term price swings. A swing trader usually holds positions longer than an intraday trader but shorter than a long-term investor. The goal is to identify a probable price movement, enter near a favorable zone, manage risk, and exit when the trade reaches a target or the setup weakens.
Swing trading often works well in trending markets, range-bound markets, and sector rotation phases. In a strong uptrend, traders may buy pullbacks near support or moving averages. In a downtrend, traders may sell rallies near resistance. In a range, traders may buy near the lower boundary and sell near the upper boundary. The method depends on market context.
A good swing trade usually begins with a clear idea. The trader asks whether the market is trending, consolidating, reversing, or breaking out. Then the trader checks whether price is near a support or resistance zone. After that, indicators such as moving averages, RSI, MACD, Bollinger Bands, or volume can help confirm the setup.
Financial astrology can be added after this core analysis. It may help a trader ask whether the current period supports patience, caution, volatility awareness, or aggressive trend-following. But the chart remains the final decision-maker.
Why Timing Matters in Swing Trading
Timing is one of the biggest challenges in swing trading. A trader may correctly identify a strong stock, but if the entry happens after the move is already extended, the trade may carry poor risk-reward. Another trader may correctly identify a reversal zone, but if the entry happens before confirmation, price may continue falling and trigger a stop-loss.
Timing affects entry, stop-loss distance, position size, target planning, and emotional control. A well-timed trade usually allows a tighter stop-loss and a better risk-reward ratio. A poorly timed trade often forces the trader to tolerate larger volatility or exit early out of fear.
Financial astrology focuses on timing windows. In trading, a timing window does not mean a guaranteed top or bottom. It means the trader should watch price behavior more closely during that period. A timing window may coincide with a breakout, breakdown, reversal, acceleration, or emotional market reaction. The trader still needs confirmation.
This is why the phrase matters: Financial astrology prepares, technical analysis confirms, volume validates, and risk management protects.
A swing trader can use timing windows to prepare a watchlist, mark key price levels, monitor sector strength, and wait for confirmation. The timing layer creates alertness. The chart creates the trade.
Financial Astrology as a Timing Layer
Financial astrology studies the relationship between planetary cycles and market psychology. Markets are not moved by planets in a mechanical or guaranteed way. Markets move because of liquidity, earnings, interest rates, policy, economic data, institutional flows, positioning, and investor behavior. However, financial astrology looks at whether certain planetary periods appear to align with changes in volatility, sentiment, or market rhythm.
For swing trading, the most practical use of financial astrology is timing awareness. A trader may track planetary ingresses, retrograde phases, lunations, eclipses, major aspects, and planetary cycles related to specific asset classes. These periods can be treated as observation windows.
For example, a trader may notice that a stock index is approaching major resistance while a high-volatility timing window is near. The correct action is not to blindly short the market. The correct action is to watch how price behaves near resistance. If price rejects the zone with weak volume, bearish candles, and loss of momentum, the trader may consider a short setup. If price breaks above resistance with strong volume, the timing window may instead support continuation.
The same logic applies to bullish setups. If a stock is near support during a timing window, the trader should not automatically buy. The trader should wait for confirmation such as a reversal candle, higher low, breakout above a short-term trendline, improving RSI, or strong volume.
Financial astrology is most useful when it makes the trader more prepared, not more impulsive.
The Role of Technical Analysis in Swing Trading
Technical analysis gives structure to swing trading. It helps traders define trend, momentum, support, resistance, entries, exits, and invalidation levels. Without technical analysis, financial astrology becomes too abstract for practical trading. A trader needs price levels to manage real money.
The first step is to identify trend direction. A market making higher highs and higher lows is usually in an uptrend. A market making lower highs and lower lows is usually in a downtrend. A market moving sideways between clear support and resistance is range-bound.
Moving averages can help simplify trend analysis. A stock trading above its 20-day and 50-day moving averages often shows short-term strength. A stock trading below those averages may show weakness. However, moving averages should not be used alone. Price structure, volume, and market context matter.
Swing traders also study chart patterns. Breakouts, pullbacks, flags, wedges, double bottoms, double tops, head-and-shoulders patterns, and base formations can all offer potential setups. But every pattern must be judged by location. A breakout near all-time highs may behave differently from a breakout inside a weak sector. A reversal pattern near long-term support may carry more meaning than the same pattern in the middle of a range.
Financial astrology can help a trader decide when to pay closer attention, but technical analysis decides whether the setup is valid.

Support and Resistance in Swing Trading
Support and resistance are the foundation of many swing trading decisions. Support is a zone where buying interest may appear. Resistance is a zone where selling pressure may emerge. These levels are not exact numbers. They are areas where traders, investors, and institutions may react.
A swing trader may use support to plan a long trade. If a stock pulls back to a known support zone and begins to stabilize, the trader can watch for signs of reversal. Those signs may include a bullish candle, rising volume, positive divergence on RSI, or a reclaim of a moving average.
Resistance works the opposite way. If price approaches a major resistance zone and starts to lose momentum, a trader may prepare for a possible short trade or profit-taking opportunity. If price breaks through resistance with strength, the same level may become future support.
Financial astrology can be layered over support and resistance analysis. If a timing window appears while price is near an important level, the trader can pay closer attention. But the level itself matters more than the timing window. Price must respond.
For example, if an index is near a 50-day moving average, previous swing low, or trendline support during a timing window, the trader can watch for a bounce. But if support breaks with high volume, the timing window may instead mark the start of a deeper decline.
The principle remains: Financial astrology prepares, technical analysis confirms, volume validates, and risk management protects.
Using Volume to Validate Swing Trading Setups
Volume tells traders whether participation supports a move. A breakout without volume may fail. A reversal without volume may lack conviction. A pullback on light volume may show healthy profit-taking, while a decline on heavy volume may show distribution.
For swing trading, volume is especially important because trades last multiple sessions. A trader wants to know whether institutions may be participating in the move. Strong volume on breakout days, accumulation near support, and reduced volume on pullbacks can all support bullish setups. Heavy selling volume near resistance or during support breaks can support bearish setups.
Volume also helps traders avoid false signals. A stock may break above resistance briefly, but if volume remains weak, the move may not attract enough follow-through. In that case, the trader should be careful. A failed breakout can trap late buyers and lead to a sharp reversal.
Financial astrology timing windows may point to periods when volatility could increase, but volume tells whether the market is actually responding. If a planetary timing window arrives and volume expands as price breaks a key level, the setup gains credibility. If the timing window arrives but volume stays flat and price remains stuck, the trader should wait.
Volume validates. Without it, timing and patterns are less reliable.
Key Indicators for Swing Trading
Indicators can help traders confirm trend, momentum, volatility, and potential exhaustion. However, indicators should support price analysis, not replace it. Many beginners make the mistake of loading too many indicators on a chart. This creates confusion and delays decision-making.
Moving averages are among the most useful tools for swing trading. The 20-day moving average often reflects short-term trend strength. The 50-day moving average gives a broader swing trading view. The 200-day moving average shows long-term direction. When price holds above key moving averages, buyers often control the trend. When price stays below them, sellers may dominate.
RSI helps measure momentum. A rising RSI may confirm improving strength. A falling RSI may warn of weakening momentum. Overbought readings do not always mean price will fall, especially in strong trends. Oversold readings do not always mean price will bounce, especially in weak markets. RSI works best when combined with support, resistance, divergence, and trend context.
MACD can help traders study momentum shifts. A bullish crossover may support a long setup, while a bearish crossover may support caution. Bollinger Bands can help identify volatility expansion and contraction. When bands tighten, a larger move may be developing. When price expands outside the bands, traders should watch for continuation or exhaustion depending on trend and volume.
Financial astrology can complement these indicators by highlighting timing periods when indicator signals may matter more. For example, if RSI bullish divergence appears near support during a timing window, the trader may prepare for a reversal. But entry should still depend on price confirmation.
Trend Analysis and Market Context
Swing trading works best when the trader understands the larger market environment. A strong individual stock can struggle if the broader market is weak. A weak stock can continue falling even if it appears oversold. Sector rotation, index direction, interest rate expectations, earnings season, and macro news all influence swing trades.
Market context begins with major indices. A trader should check whether the S&P 500, Nasdaq, Dow Jones, Russell 2000, Nifty, or other relevant benchmark is trending higher, consolidating, or breaking down. Then the trader should study sector strength. If technology stocks are leading the market, bullish swing setups in strong tech names may have better odds. If energy is outperforming, oil-related stocks may offer stronger opportunities.
Context also includes volatility. High-volatility markets can create large moves but also wider stop-loss requirements. Low-volatility markets may offer cleaner trends but slower progress. A trader must adjust position size and expectations based on volatility.
Financial astrology can help with market context by identifying periods when sentiment may shift or volatility may expand. But again, the trader should treat it as preparation. If a timing window suggests a possible change, the trader should compare that with index levels, sector rotation, breadth, volume, and price action.
Swing trading becomes stronger when multiple forms of evidence align.

Financial Astrology Timing Windows for Swing Traders
Timing windows are one of the most practical ways to use financial astrology in swing trading. These windows may be based on planetary transits, retrogrades, lunar cycles, eclipses, or major planetary aspects. The idea is not to predict exact prices. The idea is to become more alert during periods when market behavior may change.
A timing window can be used before a trade, during a trade, or near an exit. Before a trade, it can help a trader prepare a watchlist and mark important support and resistance levels. During a trade, it can help the trader stay alert for volatility or acceleration. Near an exit, it can help the trader watch for exhaustion, reversal candles, or volume spikes.
For example, if a swing trader is holding a profitable long position and a major timing window approaches while price is near resistance, the trader may tighten the stop-loss, reduce position size, or watch for profit-taking signals. This does not mean the trader must exit. It means the trader should manage the trade with greater awareness.
If a trader is waiting for an entry and a timing window appears near support, the trader can watch for a reversal setup. If no confirmation appears, there is no trade. This discipline prevents emotional entries.
Financial astrology works best when it creates patience. It should not create overconfidence.
Combining Charts, Cycles, and Confirmation
The strongest swing trading setups often combine chart structure, cycle awareness, and confirmation. A trader may start with a watchlist of stocks or indices that are near important levels. Then the trader checks whether a timing window is active or approaching. After that, the trader waits for confirmation.
Confirmation may come from price closing above resistance, reclaiming a moving average, forming a higher low, breaking a downtrend line, or showing strong accumulation volume. It may also come from sector strength, relative strength versus the index, or improving breadth.
A bullish setup may look like this in practice. A stock is in a longer-term uptrend. It pulls back to the 50-day moving average. RSI cools down but does not collapse. Volume decreases during the pullback. A timing window approaches. Then price forms a bullish reversal candle and closes above the previous day’s high with higher volume. This creates a more complete setup.
A bearish setup may look different. An index rallies into resistance after a weak recovery. RSI fails to make a new high. Volume is weak during the rally. A timing window arrives. Price rejects resistance and closes below a short-term support level with rising volume. This may support a short setup or a defensive decision.
The trader should still define risk before entering. A strong setup without risk management is still dangerous.
Risk Management for Swing Trading
Risk management is the most important part of swing trading. A trader can have a strong strategy and still lose money if risk is uncontrolled. Swing trades can gap overnight, react sharply to news, or reverse quickly near key levels. This makes planning essential.
A stop-loss defines where the trade idea becomes invalid. For a long trade, the stop-loss may sit below support, below a swing low, or below a moving average. For a short trade, it may sit above resistance or above a recent swing high. The stop-loss should be placed where the setup no longer makes sense, not where the trader feels comfortable emotionally.
Position sizing connects the stop-loss to account risk. If the stop-loss is wide, the position size should be smaller. If the stop-loss is tight and logical, the position size may be larger. Many disciplined traders risk only a small percentage of capital on each trade. This allows them to survive losing streaks and stay objective.
Risk-reward matters before entry. A trade risking $1 to make $1 may not be attractive unless the probability is very high. A trade risking $1 to make $2 or $3 gives the trader more room to be wrong. Swing traders should look for setups where the target is meaningful compared to the risk.
Financial astrology cannot remove risk. It can only help identify timing awareness. Risk management protects the account when the market behaves differently than expected.
Stop-Loss Discipline and Trade Invalidation
A stop-loss is not a sign of failure. It is part of professional trading. Every trade is based on a thesis. If price invalidates that thesis, the trader should exit and preserve capital.
Many beginners move stop-losses because they do not want to accept a loss. This is dangerous. A small planned loss can become a large unplanned loss. Swing trading requires discipline because positions remain open beyond one session. Overnight news, earnings, geopolitical events, and macro data can create gaps.
A good stop-loss should be based on structure. If a trader buys near support, the stop may go below that support. If price breaks support with strong volume, the setup is no longer valid. If a trader buys a breakout, the stop may go below the breakout level or below the base. If price falls back into the base and volume weakens, the breakout may have failed.
Financial astrology timing windows can help traders become more alert near stop levels. If a volatile timing window is approaching and price is close to invalidation, the trader may choose to reduce size, tighten risk, or avoid adding exposure.
The goal is not to be right on every trade. The goal is to protect capital and keep trading when better setups appear.
Position Sizing for Swing Traders
Position sizing determines how much capital a trader puts into a trade. It is one of the most overlooked parts of swing trading. Many traders spend hours studying charts but enter positions randomly. This creates inconsistent results.
A trader should decide how much of the account they are willing to risk before entering. For example, if a trader risks 1% of capital on a trade, the position size depends on the distance between entry and stop-loss. A wider stop means fewer shares or contracts. A tighter stop means more shares or contracts, but only if the stop is logical.
Position sizing should also reflect market conditions. In uncertain markets, traders may reduce size. During high-volatility timing windows, smaller size can help manage emotional pressure. During clean trends with strong confirmation, traders may use normal size but still avoid overexposure.
Financial astrology can support position sizing decisions indirectly. If a timing window suggests potential volatility, the trader may reduce size or avoid crowded trades. But the actual size should come from risk calculation, not prediction.
Professional swing trading depends on consistency. Position sizing creates that consistency.
Risk-Reward Planning and Profit Targets
A swing trader should know the target before entering the trade. Profit targets may come from previous resistance, measured moves, Fibonacci levels, moving averages, or trend channels. Targets should be realistic and based on chart structure.
For a long trade, the first target may be the nearest resistance zone. A second target may be a higher resistance level if momentum remains strong. For a short trade, the first target may be support, while the second target may be a deeper breakdown level.
Some traders scale out of positions. They may sell part of the position at the first target and hold the rest with a trailing stop. This approach can reduce pressure and allow participation in larger moves. Others prefer full exits at predetermined targets. The best method depends on personality, strategy, and market conditions.
Financial astrology timing windows can help with target management. If price reaches a major resistance zone near a timing window, the trader may watch for exhaustion. If price breaks through resistance with high volume, the trader may hold longer. The timing window creates awareness, but price action decides.
Risk-reward planning helps traders avoid emotional exits. It turns trading into a process rather than a reaction.
Common Swing Trading Mistakes
Many swing traders fail because they enter without confirmation. They may see a timing window, read a bullish idea, or notice a stock falling near support and enter too early. Without confirmation, the trade depends on hope.
Another common mistake is ignoring market context. A trader may buy a stock that looks strong, but if the broader index is breaking down, the trade may struggle. Sector weakness can also reduce the odds of success.
Overtrading is another problem. Swing trading does not require constant action. The best setups may appear only when price, volume, trend, and timing align. Patience is a major edge.
Poor risk management causes the biggest damage. Traders who risk too much on one trade may become emotional. They may exit winners too early and hold losers too long. This creates a negative cycle.
Financial astrology can become dangerous if used as certainty. A timing window is not a guarantee. It is a period for observation and preparation. The trader must still wait for confirmation.
The disciplined approach is clear: Financial astrology prepares, technical analysis confirms, volume validates, and risk management protects.
Using the Financial Astrology Terminal for Swing Trading
The Financial Astrology Terminal at https://finance.rajeevprakash.com/ is designed to help traders and investors combine market data, charts, watchlists, global stocks, indices, commodities, and financial astrology-based timing insights in one platform. For swing traders, this type of integrated view can be useful because trading decisions rarely come from one signal alone.
A swing trader needs to track price structure, market context, momentum, and risk levels. At the same time, the trader may want to monitor financial astrology timing windows to understand when volatility or sentiment shifts may become more important. Instead of jumping between separate tools, the Financial Astrology Terminal helps bring these layers together.
The platform can support a practical workflow. A trader can begin by reviewing global market direction, indices, commodities, and important watchlist names. Then the trader can study charts, support and resistance, trend behavior, and sector movement. After that, the trader can consider financial astrology timing insights as an additional layer of preparation.
This process keeps the trader grounded. The chart still confirms the setup. Volume still validates the move. Risk management still protects the account. Financial astrology simply adds a timing perspective.
For swing traders who follow multiple markets, this can be especially helpful. Stocks, indices, commodities, precious metals, and crypto often move through different rhythms. A trader watching gold, crude oil, Nifty, Nasdaq, Bitcoin, and major global stocks needs a structured way to compare market behavior. The Financial Astrology Terminal helps organize that process into one platform.
Building a Swing Trading Workflow
A strong swing trading workflow starts before the market opens. The trader reviews the broader market, checks key indices, studies major news, and identifies sectors showing strength or weakness. Then the trader reviews watchlist names near important levels.
The next step is chart analysis. The trader marks support, resistance, trendlines, moving averages, and possible breakout or reversal zones. Then indicators help confirm momentum and volatility. RSI, MACD, moving averages, Bollinger Bands, and volume can all play a role.
After the technical setup is clear, the trader checks timing. If a financial astrology window is near, the trader becomes more alert. The timing window may support preparation, but not automatic entry. The trader waits for price confirmation.
Before entering, the trader defines the stop-loss, position size, and target. If the risk-reward is poor, the trade should be skipped. If the setup is clean and risk is controlled, the trade may be valid.
During the trade, the trader monitors price behavior. If price moves in favor, the trader may trail the stop or take partial profits. If price weakens, the trader follows the plan. After exiting, the trader reviews the trade to learn what worked and what failed.
This workflow creates consistency. Swing trading success does not come from one perfect indicator. It comes from process.
Financial Astrology and Trading Discipline
Discipline separates serious traders from emotional traders. Financial astrology can either support discipline or damage it, depending on how it is used. If a trader treats astrology as certainty, it can create overconfidence. If a trader treats it as timing awareness, it can support patience and preparation.
A disciplined trader does not force trades. If a timing window appears but the chart is unclear, the trader waits. If a stock breaks support instead of bouncing, the trader respects the breakdown. If volume does not confirm a breakout, the trader avoids chasing.
Financial astrology can also help traders become aware of emotional periods. Some timing windows may coincide with uncertainty, volatility, or sudden sentiment changes. During such periods, discipline becomes even more important. Traders may reduce size, avoid revenge trading, and focus only on high-quality setups.
The market does not reward opinions. It rewards preparation, confirmation, and risk control. A trader can have a strong view and still be wrong. That is why every swing trade needs an invalidation point.
The best use of financial astrology is not prediction. It is preparation.
Swing Trading Stocks, Indices, Commodities, and Crypto
Swing trading can be applied across many asset classes, but each market behaves differently. Stocks often react to earnings, sector trends, institutional flows, and company-specific news. Indices reflect broader market sentiment, macro data, liquidity, and risk appetite. Commodities respond to supply, demand, currency movement, geopolitics, and inventory data. Crypto often moves with liquidity cycles, sentiment, regulation, and speculative flows.
Financial astrology timing windows may affect different markets in different ways. A timing window that matters for precious metals may not have the same impact on technology stocks. A period of volatility in crypto may not align perfectly with crude oil or equities. This is why traders need market-specific analysis.
Swing traders should avoid using the same setup blindly across every asset. A gold swing trade may require different volatility expectations than a Nasdaq trade. A Bitcoin trade may need wider stops than a stable large-cap stock. A crude oil trade may react strongly to inventory data or geopolitical headlines.
The Financial Astrology Terminal can help traders compare these markets in one place. By combining charts, watchlists, global stocks, indices, commodities, and timing insights, traders can build a broader view before taking risk.
The goal is not to trade everything. The goal is to find the cleanest opportunities.
Backtesting and Journaling Swing Trades
A swing trader should track trades over time. Journaling helps traders understand whether their strategy works. It also reveals emotional patterns. Without a journal, traders often remember wins clearly and forget mistakes.
A good trading journal records the entry, exit, stop-loss, target, position size, setup type, market context, timing window, reason for entry, reason for exit, and result. The trader should also record whether the trade followed the plan.
Over time, the journal can answer important questions. Do breakout trades work better than reversal trades? Do trades near timing windows perform differently? Does volume confirmation improve results? Are losses larger during high-volatility periods? Does the trader exit too early near resistance?
Financial astrology can be studied through journaling as well. A trader can record timing windows and compare them with actual price behavior. This does not prove certainty, but it helps build a practical understanding of patterns.
Backtesting and journaling turn ideas into evidence. They help traders improve without relying on emotion.
A Practical Example of a Swing Trading Setup
Imagine a stock has been in an uptrend for several months. It pulls back from a recent high and approaches its 50-day moving average. The broader market remains stable, and the sector is still strong. Volume declines during the pullback, suggesting that selling pressure may be controlled.
At the same time, a financial astrology timing window is approaching. The trader does not buy immediately. Instead, the trader marks support near the 50-day moving average and watches for confirmation.
Two days later, the stock forms a bullish reversal candle near support. RSI turns higher from a neutral zone. Volume expands above average. Price closes above the prior day’s high. Now the trader has a confirmed setup.
The trader enters near the close or on the next day’s pullback. The stop-loss goes below the recent swing low. The first target is the previous high. The second target is a measured move above resistance if price breaks out. Position size is based on the distance between entry and stop-loss.
In this example, financial astrology did not create the trade by itself. It prepared the trader to watch the stock closely. Technical analysis confirmed the setup. Volume validated the move. Risk management protected the trade.
That is the correct relationship between charts, cycles, and capital protection.
How Beginners Should Approach Financial Astrology for Swing Trading
Beginners should start with technical analysis first. They should learn trend, support, resistance, volume, risk-reward, and stop-loss placement before using financial astrology. Without chart-reading skills, timing cycles can become confusing.
Once the technical foundation is clear, beginners can add simple timing awareness. They can track key timing windows and observe how price behaves around them. They should not risk money based only on cycles. Instead, they should use paper trading or small position sizes while learning.
Beginners should also avoid complexity. Too many planetary factors, indicators, and chart patterns can lead to analysis paralysis. A simple system works better. The trader can focus on trend, support and resistance, volume, RSI, moving averages, and timing windows.
The most important habit is patience. Swing trading does not require daily action. Some of the best trades come after waiting several days for price to reach a level and confirm direction.
Financial astrology should make a trader more patient, not more impulsive.
Conclusion
Financial astrology for swing trading works best when it is treated as a timing layer, not a prediction machine. Swing traders need a clear process that starts with market context, moves into technical analysis, checks volume confirmation, defines risk, and then uses financial astrology to prepare for possible timing windows.
The strongest approach is practical and disciplined. Use charts to identify trend, support, resistance, breakouts, reversals, and momentum. Use volume to confirm whether buyers or sellers are participating. Use financial astrology to become more aware of periods when volatility, sentiment, or market rhythm may shift. Use stop-losses, position sizing, risk-reward planning, and trading discipline to protect capital.
The guiding principle should remain constant: Financial astrology prepares, technical analysis confirms, volume validates, and risk management protects.
For traders who want to combine market data, charts, watchlists, global stocks, indices, commodities, and financial astrology-based timing insights in one platform, the Financial Astrology Terminal offers a practical way to organize this workflow. It helps traders and investors study both price structure and timing awareness without abandoning discipline.
Explore the Financial Astrology Terminal here: https://finance.rajeevprakash.com/
메타데이터
- post_id
- eb6a67849a4e
- slug
- financial-astrology-for-swing-trading-using-charts-cycles-and-risk-management-eb6a67849a4e
- url
- https://medium.com/@astroduniaaterminal/financial-astrology-for-swing-trading-using-charts-cycles-and-risk-management-eb6a67849a4e
- canonical_url
- https://medium.com/@astroduniaaterminal/financial-astrology-for-swing-trading-using-charts-cycles-and-risk-management-eb6a67849a4e
- author_url
- https://medium.com/@astroduniaaterminal
- status
- ok
- fetched_at
- 2026-06-09 15:37:30