Chapter 1 — Inside the Machine: How I Stopped Mimir from Burning CPUs and Learned to Gossip Less
“At first, I thought we just needed more pods. But the real problem was that Mimir was talking too much and thinking too hard.”
Mimir Optimization — Chapter 1 — Inside the Machine: How I Stopped Mimir from Burning CPUs and Learned to Gossip Less
“At first, I thought we just needed more pods. But the real problem was that Mimir was talking too much and thinking too hard.”
The Symptom: High CPU, High GC and Sluggish Performance
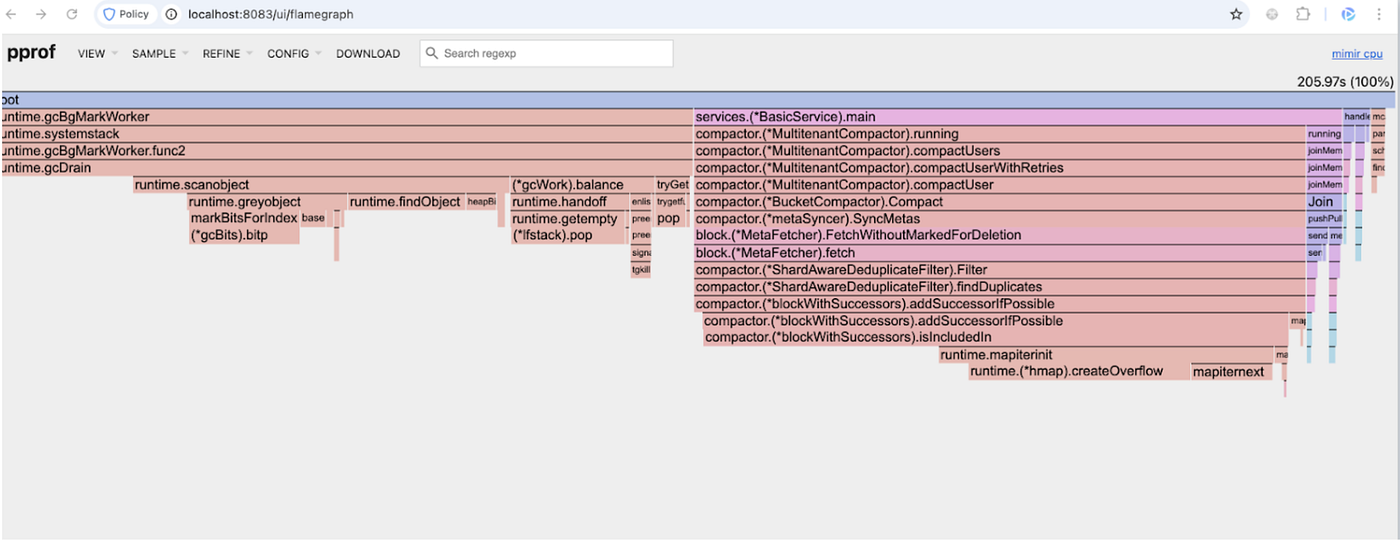
Our Mimir cluster had grown to hundreds of ingesters, queriers and distributors — yet ingestion and live-query (< 6 hours) latency kept creeping up. Profiling revealed that 60–70 % of total CPU time was consumed by Go’s garbage collector, not actual metric processing.
Adding more ingesters only amplified the problem. To verify, I profiled multiple ingesters — one for 90 seconds and another for 60 seconds — and both exposed the same pattern.
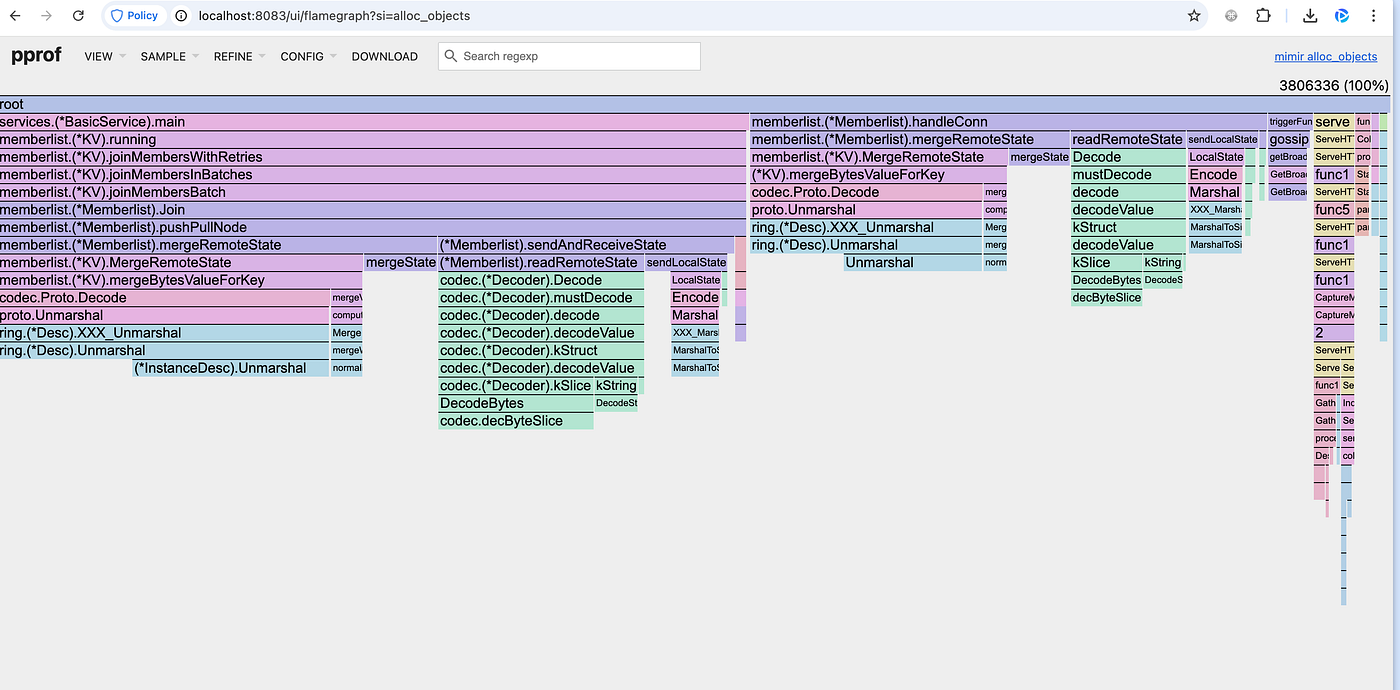
Heap Allocated Objects
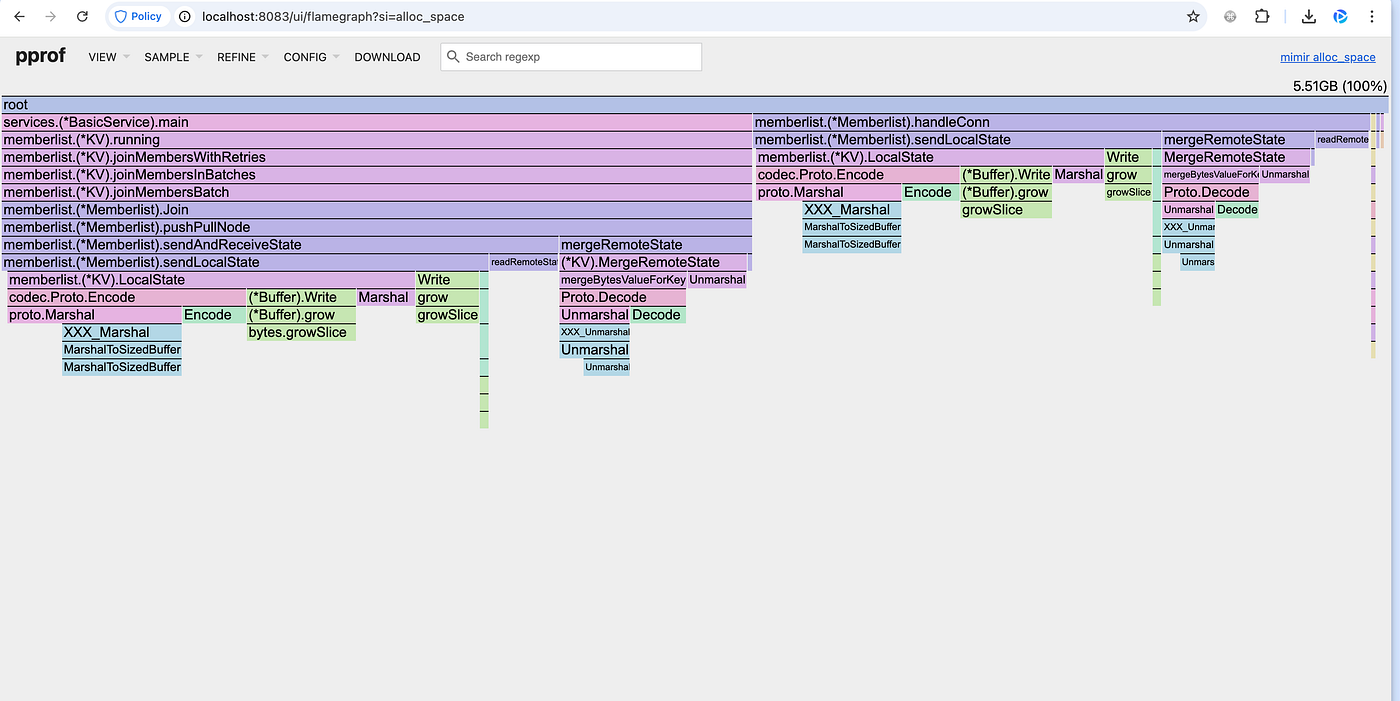
Heap Allocated Space
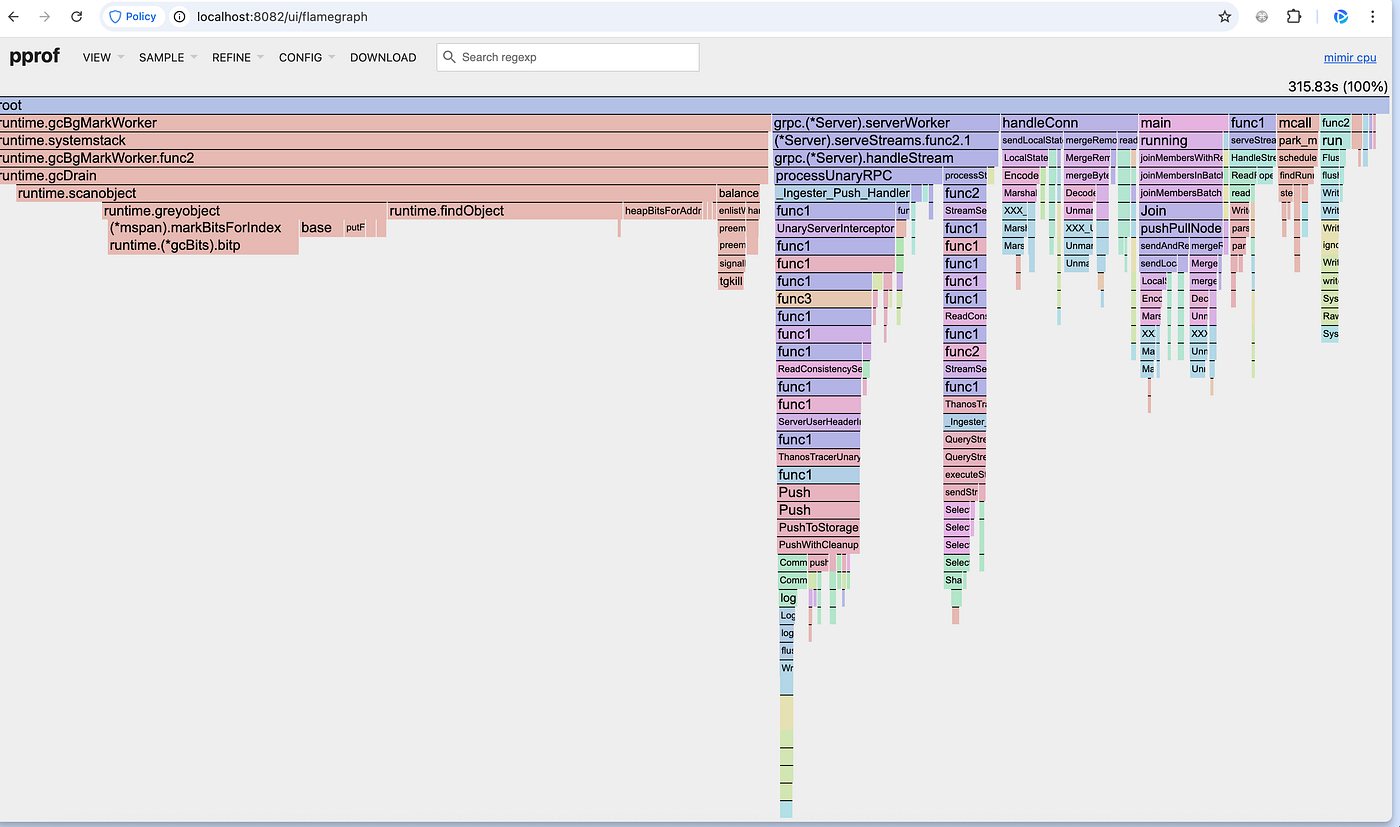
CPU
The Profiles — Same Symptoms Everywhere
1. Buffer Growth (24.64% — 8GB)
bytes.growSlice -> bytes.(*Buffer).growProblem: Frequent buffer reallocations, likely from:
- Large protobuf marshaling
- Network I/O buffers growing dynamically
File: mimir
Type: alloc_space
Time: 2025-08-07 18:28:15 PDT
Duration: 60.19s, Total samples = 32682.42MB
Showing nodes accounting for 32682.42MB, 100% of 32682.42MB total
----------------------------------------------------------+-------------
      flat  flat%   sum%        cum   cum%   calls calls% + context
----------------------------------------------------------+-------------
                                         8052.72MB   100% |   bytes.(*Buffer).grow /usr/local/go/src/bytes/buffer.go:151
 8052.72MB 24.64% 24.64%  8052.72MB 24.64%                | bytes.growSlice /usr/local/go/src/bytes/buffer.go:249
2. Ring State Management (19.71% — 6.6GB)
----------------------------------------------------------+-------------
                                         4154.66MB   100% |   github.com/grafana/dskit/ring.(*Desc).MarshalToSizedBuffer /workspace/mimir/vendor/github.com/grafana/dskit/ring/ring.pb.go:411
 4154.66MB 12.71% 37.35%  4154.66MB 12.71%                | github.com/grafana/dskit/ring.(*InstanceDesc).MarshalToSizedBuffer /workspace/mimir/vendor/github.com/grafana/dskit/ring/ring.pb.go:473
ring.(*InstanceDesc).MarshalToSizedBuffer (12.71% - 4.1GB)
ring.(*InstanceDesc).Unmarshal (4.87% - 1.6GB)
Problem: Excessive ring state serialization/deserialization
3. Memberlist Gossip Protocol (12.75% — 4.1GB)
----------------------------------------------------------+-------------
                                         2073.11MB 99.02% |   github.com/grafana/dskit/kv/memberlist.(*KV).MergeRemoteState /workspace/mimir/vendor/github.com/grafana/dskit/kv/memberlist/memberlist_client.go:1304
                                           20.56MB  0.98% |   github.com/grafana/dskit/kv/memberlist.(*KV).NotifyMsg /workspace/mimir/vendor/github.com/grafana/dskit/kv/memberlist/memberlist_client.go:1082
 2093.67MB  6.41% 64.49%  2093.67MB  6.41%                | github.com/grafana/dskit/kv/memberlist.(*KeyValuePair).Unmarshal /workspace/mimir/vendor/github.com/grafana/dskit/kv/memberlist/kv.pb.go:597
Problem: Constant cluster state synchronization
4. CPU Throttling from GOMAXPROCS
Mimir 2.17 is currently built with Go 1.24, which still lacks native cgroup awareness.
I haven’t yet tested Mimir 2.17 with Go 1.25, but once Grafana adopts it (hopefully in Mimir 3.0), the runtime should automatically align GOMAXPROCS with container limits — eliminating scheduler thrash.
Before Go 1.25, GOMAXPROCS equaled the host CPU count.
A 4-CPU pod on a 224-core node thus spawned 224 GC threads, overwhelming the scheduler.
Upgrading to Go 1.25 fixed this automatically: the runtime now reads cgroup v2 limits and caps thread creation. Instantly, CPU throttling disappeared and GC cycles became smoother
One of the less obvious issues I discovered was CPU throttling caused by Go’s GOMAXPROCS behavior inside containers.
Older Go versions don’t automatically respect cgroup CPU limits, so the Go runtime schedules more OS threads than the container is actually allowed to run — leading to unnecessary context switching and throttling.
Go Version: go1.21.13
GOMAXPROCS: 64 (Still not container-aware, assumes all host CPUs are available.)
NumCPU: 64

Go Version: go1.24.2
GOMAXPROCS: 224 (Still not container-aware, assumes all host CPUs are available.)
NumCPU: 224

Go Version: go1.25.0
GOMAXPROCS: 4 (Now correctly auto-detects the container’s CPU quota and sets GOMAXPROCS accordingly.)
NumCPU: 64
Add env variable in manifest (GO version < 1.25)
      containers:
      - env:
        - name: GOMAXPROCS
          valueFrom:
            resourceFieldRef:
              divisor: "1"
              resource: limits.cpu
The Fix — Teach Mimir to Gossip Less and Smarter
The gossip layer is one of the most chatty subsystems in Mimir. It’s responsible for cluster state propagation — who’s up, who owns which tokens and which ingesters hold what data.
Memberlist defaults in Mimir:
gossip_interval: 200ms (how often each node gossips)retransmit_factor: 4 (fan-out multiplier used as factor × log(N+1))pull_push_interval: 30s (periodic full state sync) **Mimir Memberlist**
What the knobs do (in practice):
- Every
gossip_interval, a node sends updates to a subset of peers periodically, a push/pull does a full ring sync with a random peer. - The retransmit fan-out scales as
retransmit_factor × log(N+1), larger clusters grow the “echo” of each update only logarithmically, but the constant still matters a lot. (This is how memberlist/gossip behaves, see the overview **article** for intuition.)
In a large cluster, that chatter scales up fast. To reduce the constant message storm, I tuned the gossip interval and retransmit factor:
memberlist:
  gossip_interval: 1s          # from 200 ms
  retransmit_factor: 3         # from 4
Mimir’s gossip layer sends updates every gossip_interval to
retransmit_factor × log(N + 1) peers.
For a large cluster of N = 800 ingesters:
log(801) ≈ 6.685- With the default
retransmit_factor = 4, each node contacted4 × 6.685 = 26.74peers every 0.2 seconds. - After tuning to
retransmit_factor = 3andgossip_interval = 1s, each node now contacts3 × 6.685 = 20.06peers once per second.
That’s roughly 25% fewer peers per gossip round and 5× fewer gossip ticks per second, leading to an overall ≈6–7× reduction in background message volume.
You can push even further — for example, retransmit_factor = 2 would reduce this to 2 × 6.685 = 13.37 peers —
but I intentionally stopped at 3, since going too low risks slower convergence when ingesters join or leave.
⚠️ Important caveat:
These parameters should only be adjusted if your cluster has a stable membership — that is, ingesters are not scaling up or down frequently.
If you run a highly dynamic environment where nodes join and leave often, increasing gossip_interval too aggressively can delay convergence of cluster state and temporarily lead to stale ring views.
But in our case, the environment was very stable: ingesters rarely churned and replication already provided resilience. That made it safe to relax gossip frequency without compromising reliability.
Compression — Saving Bandwidth
By default gRPC compression is disabled in Mimir.
Phase 1 — Enable gRPC Snappy
Adding Snappy compression between distributors ↔ ingesters ↔ queriers reduced traffic significantly.
Phase 2 — Upgrade to S2 Compression (Mimir 2.15+)
S2, Snappy’s SIMD-accelerated successor, delivered even better balance:
      grpc_client_config:
        grpc_compression: s2
Results After Tuning and Compression
The following improvements came from the combined effect of gossip optimization, Snappy compression across all gRPC paths (distributor ↔ ingester ↔ querier), and reduced GC pressure:
- GC activity ↓ ≈ 75%
- Objects created for gossip ↓ ≈ 85 %
- CPU load per node ↓ significantly (No more CPU throttling)
- Cluster size reduced to ~12.5 % (ingesters) with no data loss
- Network traffic ↓ 49GB/s → 900 MB/s (-98 %)
These gains weren’t from any single knob — it was the synergy of less gossip, more efficient compression and fewer allocations. With the background noise reduced, ingestion throughput stabilized and live ( < 6 h ) queries completed far faster without touching hardware or scaling limits.
Profiling post optimization
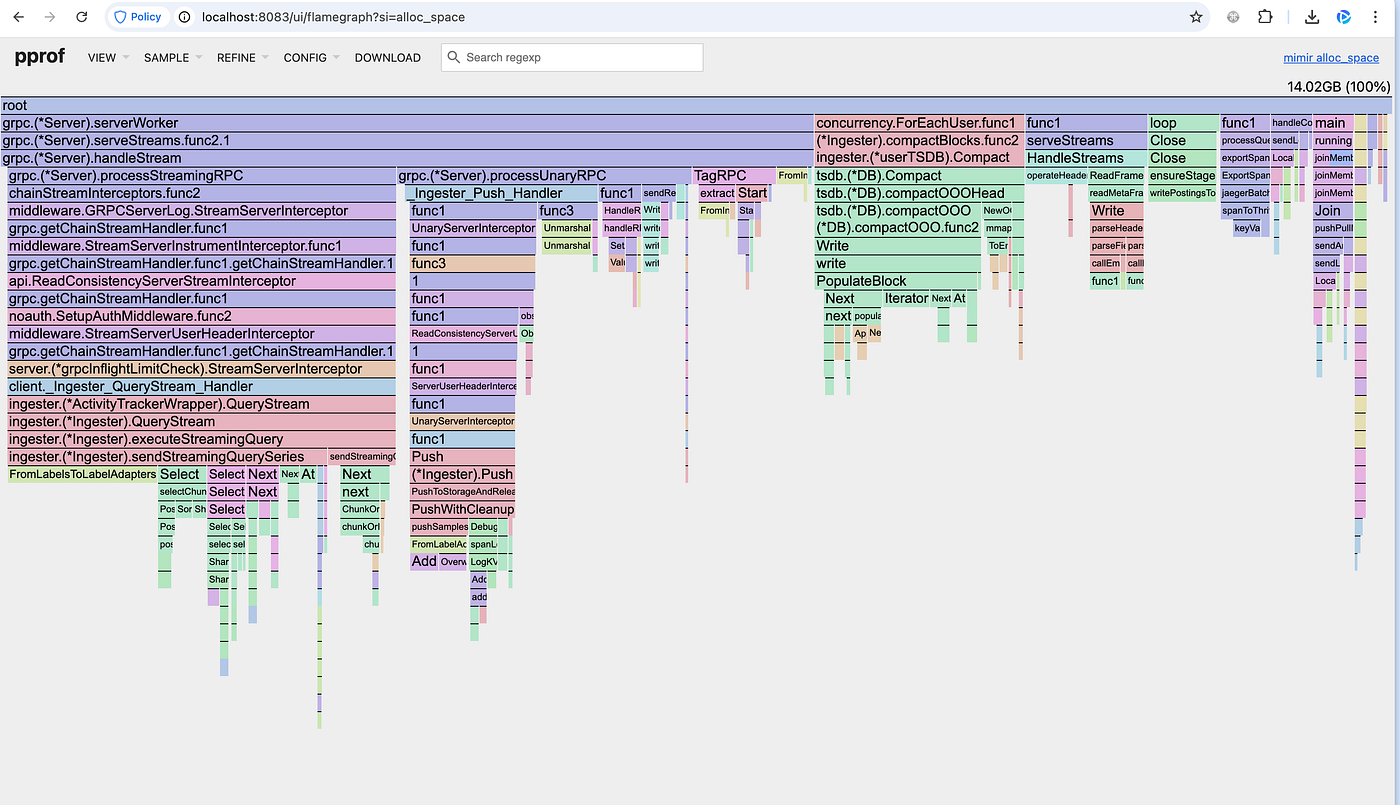
Heap Alloc Space
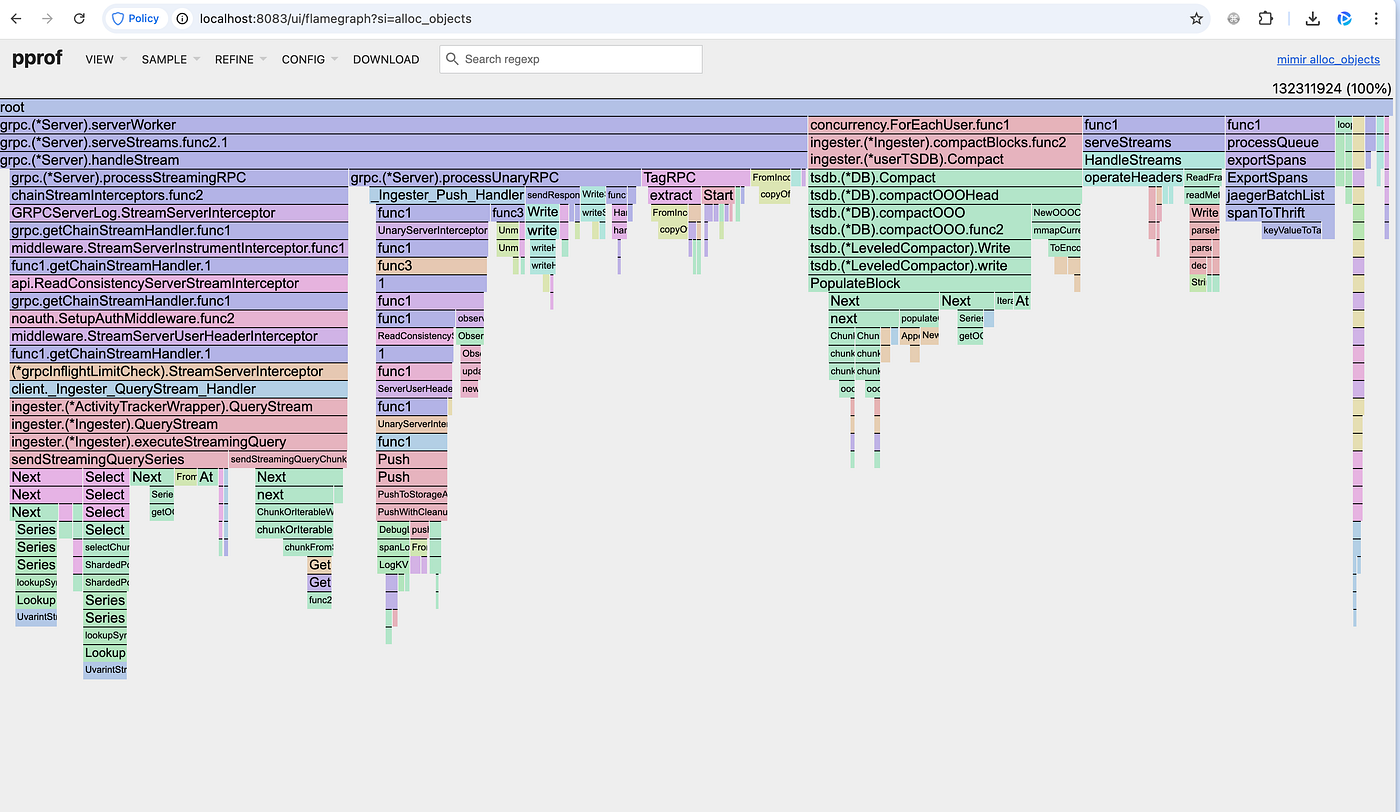
Heap Alloc Objects
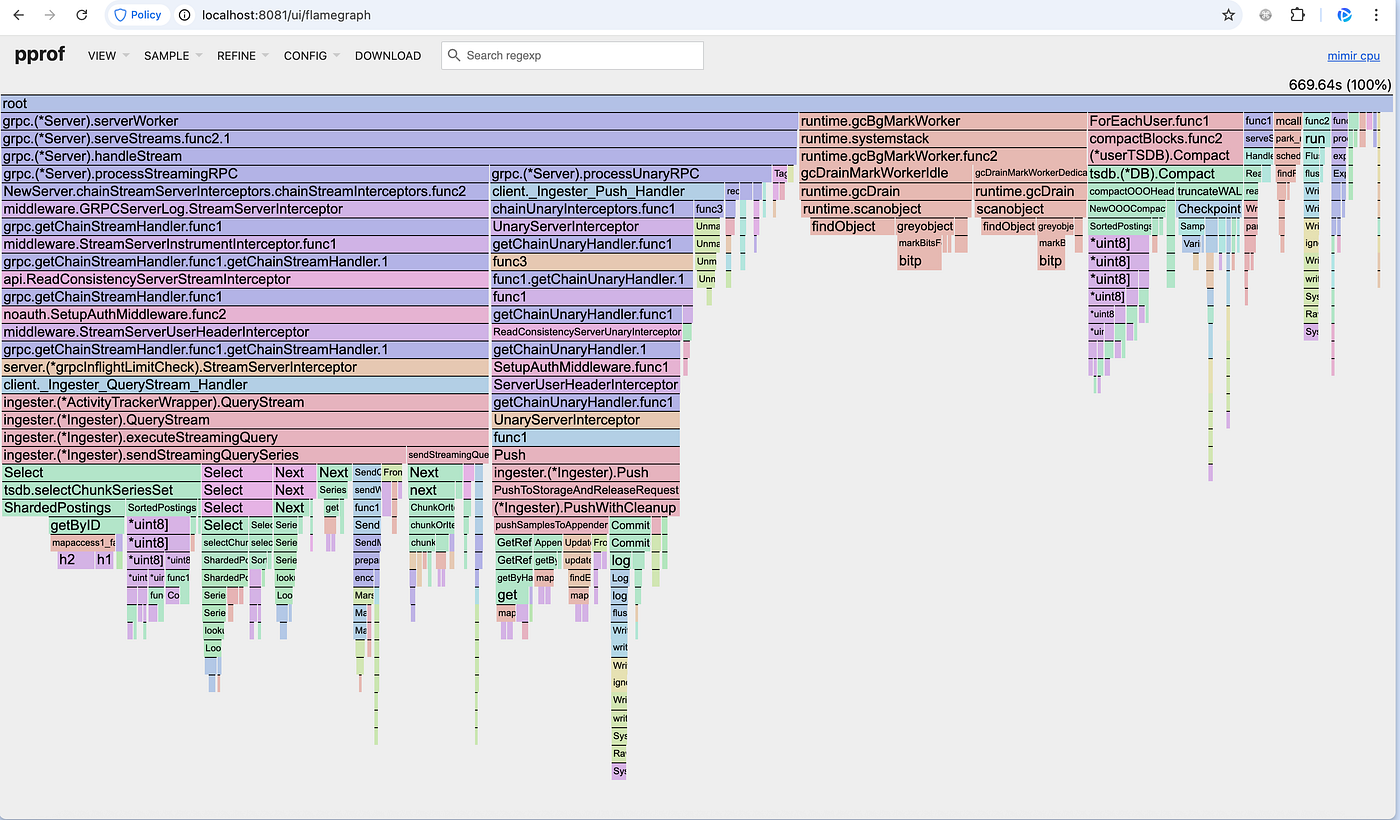
CPU
After these changes, the second profiling graph looked entirely different — memberlist objects in heap had dropped drastically, GC time was a fraction of before and CPU cycles were now spent on real Mimir work — queries, writes and TSDB head-block processing — instead of cleaning up garbage.
Overall Impact
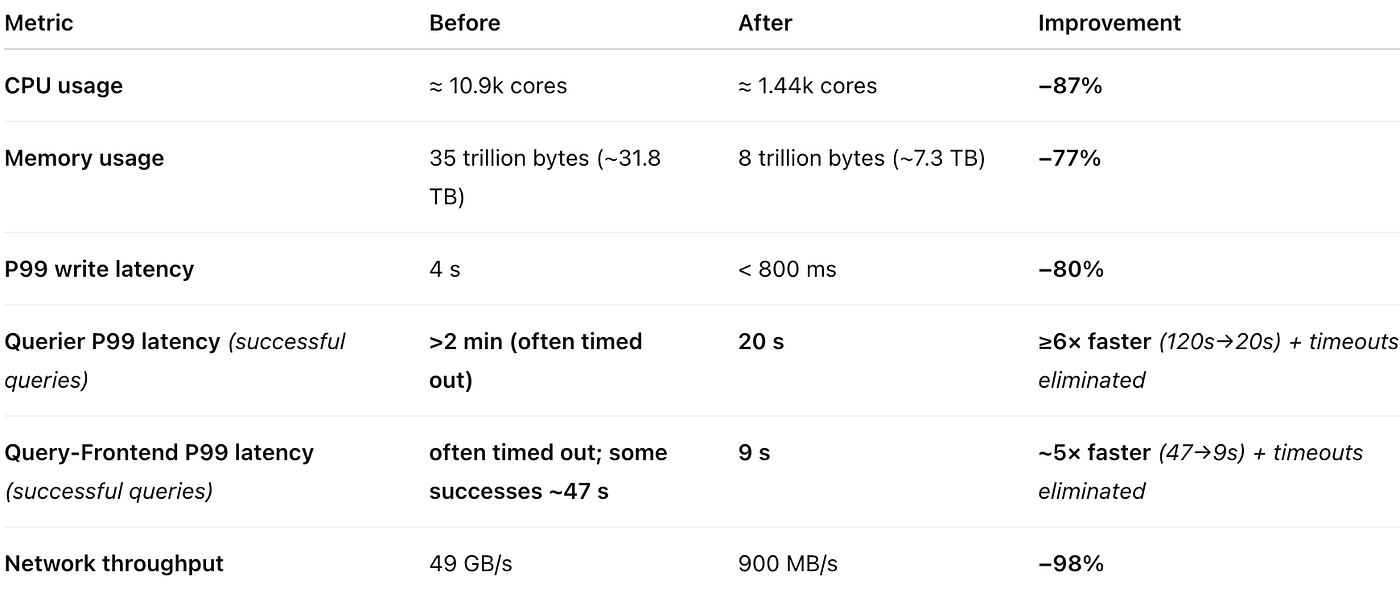
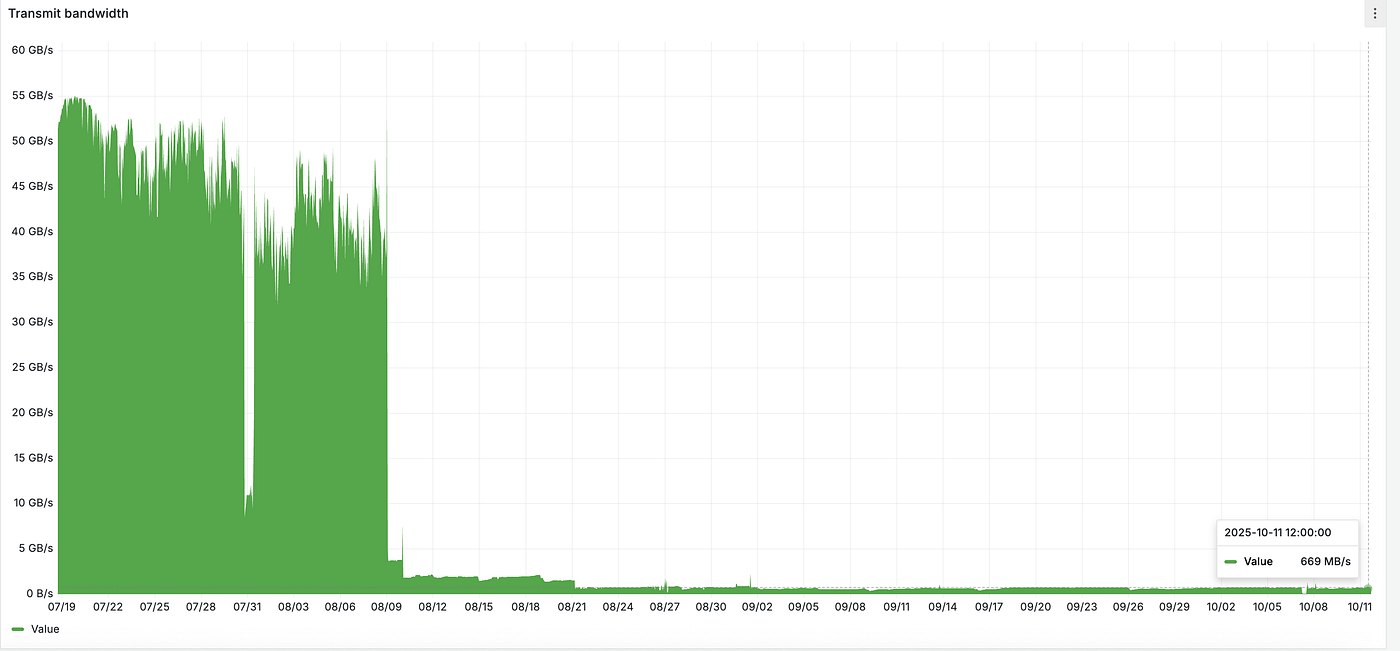
Distributor → Ingester
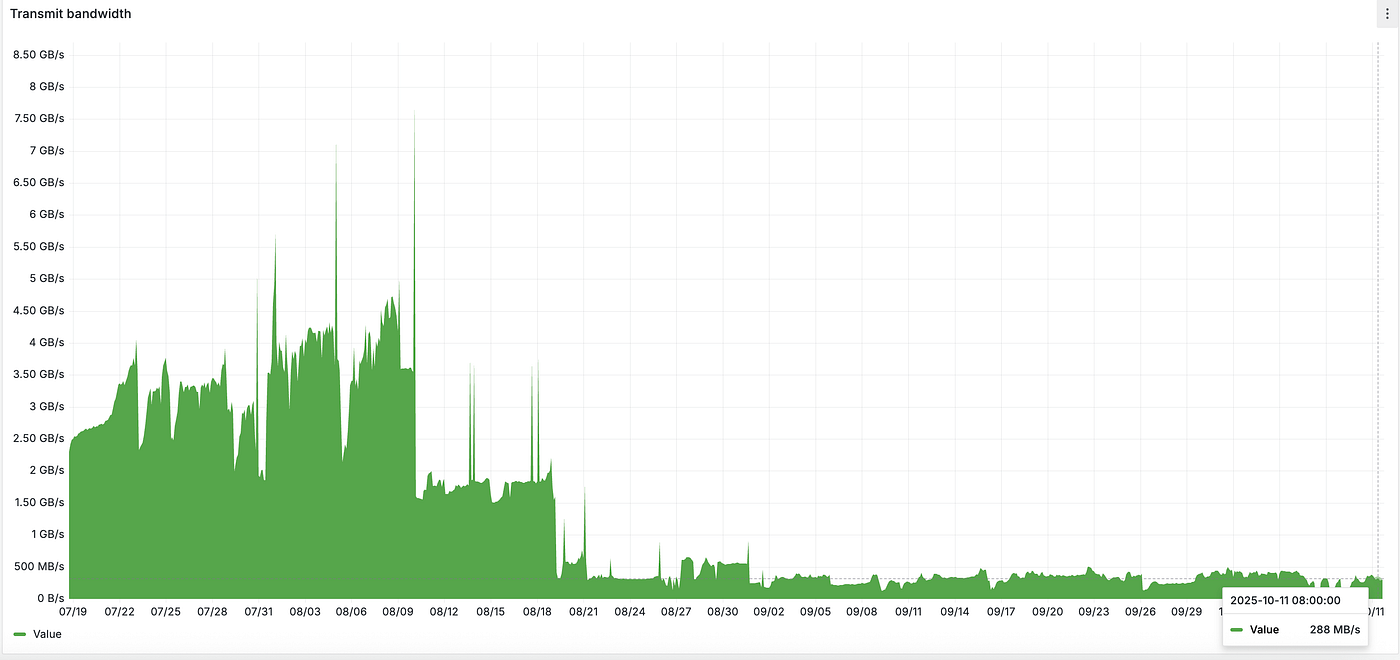
Post-compression and compaction: 100% successful querier→ingester responses, zero timeouts and significantly lower bandwidth usage.
The Querier P99, which previously never completed beyond the 2-minute default timeout, now finishes in ≈ 20 seconds, while the Query-Frontend P99 dropped from 47 seconds to 9 seconds — largely due to improved backend responsiveness, reduced timeouts, and effective memcached caching in the query-frontend layer. This confirms that queries not only complete successfully but also execute nearly 5–8 × faster end-to-end.
How to read this: Before, both the querier and the frontend frequently timed out on 30-day-plus range queries, so “P99” wasn’t meaningful. After the fixes, queries complete reliably and the P99 of successful queries is what you see above. Considering both the elimination of timeouts and the latency reductions (backend ≥ 6 × faster, frontend ≈ 5 × faster), the overall end-to-end query performance improved by ~8 × from a user perspective (With no failures). These improvements — and how query-frontend caching, sharding, and store-gateway optimizations amplify them — will be explained in **Chapter 2**.
Conclusions and Learnings
- Scaling won’t save you. Throwing more pods at the problem only magnifies waste.
- Continuous profiling is your compass. Short pprof sessions (60–90 s) revealed exactly where CPU was going — and why.
- Gossip tuning and compression beat blind autoscaling. Small network knobs yielded massive returns.
- Go 1.25 container awareness is a game-changer. No more manual GOMAXPROCS tuning.
- Profiling + traces provide context. They show where and how query performance is hit, not just that it is.
By optimizing Mimir intelligently instead of scaling blindly, we cut compute and storage costs by ~80 %.
Profiling and tracing helped connect the dots between GC, network and query paths — giving clear insight into how each component affects end-to-end latency.
After applying all optimizations — gossip tuning, compression, and runtime adjustments — the gains were massive.
Note:
I haven’t included every single tuning detail here — this post is meant as a message on where to start. It took me several weeks of profiling, parameter tuning, reducing ingesters, analyzing traces and watching percentile metrics to reach this point. Your Mimir cluster may show different symptoms depending on workload, cardinality and deployment model. But if you haven’t profiled or tuned your setup yet, this is a solid starting point to understand where the time, memory and CPU actually go — and how small, deliberate changes can lead to massive gains.
🏁 Looking Ahead — Prelude to Chapter 2
These changes fixed the live-data (< 6 h) path. But for queries beyond 6 hours, a different bottleneck emerged — the compactor. At its peak, over 1.6 million blocks forced the store-gateway to download postings from every block for each query. In **Chapter 2, we’ll explore how understanding Prometheus TSDB internals** (postings, chunks, and index headers) helped solve that problem and unlock another layer of performance.
“Optimization starts in memory but ends on disk.”
메타데이터
- post_id
- ebda82a2f19b
- slug
- chapter-1-inside-the-machine-how-i-stopped-mimir-from-burning-cpus-and-learned-to-gossip-less-ebda82a2f19b
- url
- https://medium.com/@niteshbv/chapter-1-inside-the-machine-how-i-stopped-mimir-from-burning-cpus-and-learned-to-gossip-less-ebda82a2f19b
- canonical_url
- https://medium.com/@niteshbv/chapter-1-inside-the-machine-how-i-stopped-mimir-from-burning-cpus-and-learned-to-gossip-less-ebda82a2f19b
- author_url
- https://medium.com/@niteshbv
- status
- ok
- fetched_at
- 2026-06-26 21:52:29