Climate Change and the System of National Accounts
Learn how climate change is linked to the economy, how extraction, production, and emissions are connected through the SNA.

Climate Change and the System of National Accounts
Climate change is one of the defining challenges of our time. Rising emissions, increasing temperatures, melting ice sheets, and extreme weather events often come up in conversations. As policy responses, we also talk about carbon taxes, emission targets, decarbonization, green transitions, and various other instruments. While such debates are relevant, most of the time it is not clear what type of economic activity or transmission channels are being discussed. And if we lack precision, we cannot prescribe effective policies.
There is another issue in how we think about climate change. It is discussed as some exogenous event that happens to us. Probably this is true if we are talking about underdeveloped regions or small islands. But on a global level, it is the cumulative result of our own economic choices. It is pretty much embedded in the way our economies produce, consume, and invest. Every tonne of carbon emitted, every hectare of forest cleared, every dollar spent on new energy infrastructure is recorded in our economic statistics. The important task is to connect these numbers, systematically and transparently, to the physical processes that are reshaping our planet.
As we have already discussed in a previous post, the System of National Accounts (SNA) provides the international standard for measuring economic activity. It organizes production, income, consumption, and investment across households, firms, and governments, from which GDP and related indicators are extracted. However, it focuses mainly on monetary transactions, not on the physical flows that sustain them.
To fill in this gap, the UN developed the System of Environmental-Economic Accounting (SEEA) to complement to the SNA. The SEEA records environmental assets and physical flows, such as energy, materials, water, and emissions, using consistent classifications that match with SNA classifications. Together, these two systems allow us to connect what the economy produces and consumes with how it affects and depends on the environment. This allows us to trace the chain from resource extraction, to production, and emissions. Thus, we want to use these two frameworks to talk about climate change as a measurable, economically integrated process that can be monitored and accounted for, and regulated, with the same rigor as GDP.
A brief introduction to the SEEA
The SEEA is maintained and coordinated by the United Nations Committee of Experts on Environmental-Economic Accounting (UNCEEA), working with the UN Statistics Division, OECD, Eurostat, FAO, IMF, and the World Bank. Together, these institutions oversee methodological updates, data harmonization, and implementation support for national statistical offices.
The SEEA was conceptualized in the 1990s and formally adopted as an international statistical standard by the United Nations Statistical Commission in 2012, in recognition of the need to capture the interaction between the economy and the environment in a coherent and comparable framework. It was designed to extend the concepts and structure of the SNA to environmental assets and flows, thereby enabling countries to measure how natural resources contribute to the economy and how economic activity affects the environment.
The SEEA framework is divided into two main parts; the Central Framework, which focuses on physical and monetary accounts for natural resources and environmental flows (such as energy, water, and emissions), and the Ecosystem Accounting module, which measures ecosystem services, condition, and extent.
Today, over 90 countries have implemented or are developing SEEA-based accounts, which to some extent are being used to inform policies. For example, in the European Union (EU), SEEA forms the statistical backbone of the EU Green Deal, while in countries such as Australia, Canada, and the Netherlands, it is integrated directly into national accounts publications. In developing economies, SEEA implementation is often supported by the World Bank’s WAVES partnership (Wealth Accounting and the Valuation of Ecosystem Services) and has been crucial for improving the measurement of natural capital. As with all datasets, the coverage and data qualities varies but at least it is a step in the right direction. Additionally, the prolification of satellite data has helped quantify and triangularize some of the nature-related indicators.
Since both the SNA and the SEEA use a common sectoral classification, they make it possible to compute indicators such as energy productivity (output per unit of energy use) and material productivity (output per unit of material consumption), plus many other indicators. We won’t dig deeper in these indictors, since this article is more of a overview, it is still important to remember that homogenous quantification of these indicators is fairly recent.
What we will cover in this post
In this post we will talk about economy-environment interactions through four specific and measureable stages:
- The extraction of resources from nature and their entry into the economy,
- The use of those resources in production and their link to productivity and efficiency,
- The emissions generated as during the production process, plus a special mention on transportation, and,
- The feedback of those emissions on economic activity.
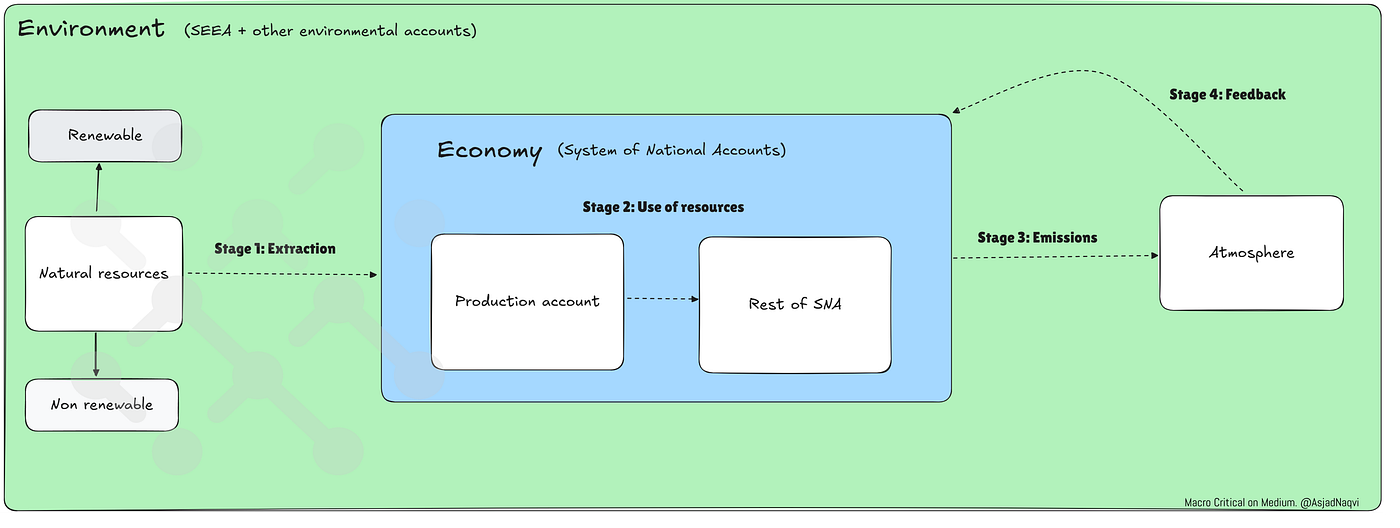
Understanding climate change through four stages of SNA-SEEA interlinkages
We will also discuss each stage in the following structure:
- Introduction: describing the broad economic and environmental context of each topic,
- Link to the SNA and SEEA: explaining how the issue is linked to national and environmental accounts,
- Market-based policy options: outlining instruments that work through prices and incentives, and,
- Non-market policy options: highlighting regulations, public investment, and institutional measures.
We will not be talking about the whole universe of policies, but rather, given the nature of each stage, which policies are typically implemented, and their broader contexts. Each of these deserve its own detailed discussion, that will certainly cover in furture posts.
So let’s get started!
Stage 1: The extraction of resources
1.1: Introduction
Economic activity begins with the conversion of natural assets into production inputs. From the earliest stages of civilization, societies have drawn on land, water, and other resources to produce the energy, food, and materials that sustain all other forms of production. These primary industries (agriculture, forestry, fishing, and mining) provide the essential foundation for the economy, transforming natural capital into goods and services. They supply the raw materials that enabled the rise of manufacturing, infrastructure development, and urbanization. The extraction sectors also sustain livelihoods, generate foreign exchange through commodity exports, and form an important tax base for many governments, particularly in resource-rich developing countries.
In most countries, their relative share in GDP has declined over time as production and employment have shifted toward industry and services, a process we call structural transformation. Yet this decline in relative size masks their continuing importance. Even today, primary industries provide the basic resources upon which all other sectors depend on. This include crops and biomass for food and energy, timber and fish for raw materials and nutrition, and minerals, metals, and fossil fuels for constructing everything ranging from buildings, to transport equipment, to technology.
Agriculture, in particular, represents a renewable, yet a fragile, form of extraction. It converts sunlight, soil, and water into food and other biomass products, while relying heavily on natural ecosystem functions such as pollination, soil fertility, and climate stability. When managed sustainably, agriculture replenishes renewable natural capital. And when mismanaged, it contributes to soil depletion, water scarcity, and deforestation. These are forms of natural capital losses that mirror the depletion of non-renewable resources.
In recent years, there as again been a renewed interest in extraction sectors. The ongoing global green transformation has brought primary industries back to the forefront of economic and geopolitical debate. The transition to renewable energy and digital technologies requires vast quantities of critical minerals and rare earth elements (lithium, cobalt, nickel, copper), while sustainable agriculture and forestry are essential to supply bio-based materials and maintain carbon sinks. Securing access to these resources has become key in trade policy, industrial strategy, and national security, and these topics are currently reshaping global supply chains.
Extraction industries represent the direct connection between economic and ecological systems. Every ton of coal, barrel of oil, or hectare of arable land cultivated represents both a flow of income in the SNA and a change in the stock of natural wealth in the SEEA. Therefore, when studying these sectors, we should not only look at how much value and employment is created, but also how much of the natural capital is also depleted.
1.2: Link to SNA and SEEA
In the System of National Accounts (SNA), resource extraction and cultivation activities are recorded under Agriculture, Forestry, and Fishing (ISIC Sector A) and Mining and Quarrying (ISIC Sector B).

Production sectors. Sector A (green) and Sector B (brown) represent extraction processes.
In both cases, the production account captures the following economic flows:
- Gross output: represents the market value of commodities extracted or harvested. These include products such as crops, livestock, timber, fish, minerals, and fossil fuels.
- *Intermediate consumption*: records inputs such as energy, fertilizers, seeds, machinery, maintenance, and services used in the extraction or cultivation process.
The difference between the two gives gross value added (GVA), the contribution of each industry to GDP (See article on GDP for a detailed discussion). Natural resources themselves appear in the *balance sheets as non-produced, non-financial assets (Sector AN2 in SNA terminology). Additions to these stocks arise from discoveries, natural growth (in forestry or fisheries), or reclassification of previously unrecorded assets. Reductions result from depletion, overharvesting, or degradation. These are recorded in the accumulation accounts, specifically under Other Changes in the Volume of Assets for physical losses or gains, and in the Revaluation Account* for price or market value changes. These balance accouts are discussed in detail in the post on Net Worth of Nations.
Because conventional GDP does not deduct the cost of natural capital depletion, an economy may show strong current output even while its underlying asset base is eroding. The SEEA Central Framework corrects for this by providing physical asset accounts for both renewable (agricultural land, timber, fish stocks) and non-renewable (minerals, fossil fuels) resources. These accounts record opening stocks, extractions, natural growth, discoveries, and closing stocks, enabling the calculation of depletion-adjusted aggregates such as net value added or income from extraction that reflects the contribution of natural resources to the economy.
As a note of caution, not eveything in nature is measureable. Biodiverity, and ecosystem services are hard to quantity and monetize, but still their contributions are invaluable. So we don’t know what all we destroy, now or in the future, when, let’s say we clear diverse forests to plant monoculture trees. We won’t go in depth on this topic, but it is only when a resource is taken from ground, oceans, or atmosphere, that it goes through an economic transformation process where we also employ capital and labor, and sell the resource on the markets. This process itself, to some extent, gives us a notion of value but it does not internalize all costs associated with the action.
1.3: Policy options
Market-based intruments
The most common market-based tools for resource extraction sectors are (a) royalties or payments made by companies for the right to extract natural resources, and (b) resource taxes, which target the “economic rent” or surplus profits that arise when extraction or cultivation is especially profitable due to scarcity or favorable market conditions. These ensure that a fair share of the resource’s value accrues to the public, which collectively owns the underlying asset.
To encourage sustainable use, governments can apply *cost depletion or [user fees](https://en.wikipedia.org/wiki/User_fee) that increase as resource stocks decline or as extraction moves to more sensitive areas. Similar approaches are used in water pricing and land-use fees for agriculture, where the costs of overuse or degradation are reflected in the price of resource access. [Tradable permits](https://www.eea.europa.eu/help/glossary/eea-glossary/tradable-permits) or water-use rights can cap total allowable use, such limits on barrels of oil, cubic meters of groundwater, tons of minerals, or irrigation withdrawals, but allow trading among users to improve efficiency while staying within ecological limits. The European [Emissions Trading Scheme (ETS)](https://climate.ec.europa.eu/eu-action/carbon-markets/eu-emissions-trading-system-eu-ets_en)* follows a similar principal allowing firms and countries to buy and sell emission permits in a cap-and-trade setting.
Permits are usually allocated using auction mechanisms, with the aim of, in theory, revealing the scarcity value of resources and discouraging wasteful overuse. Clear revenue management rules, which treat extraction and cultivation income as a transformation of natural assets into financial capital, help ensure that proceeds are invested for long-term benefit, such as in infrastructure, education, or renewable resource management.
Non-market based intruments
Non-market instruments operate through administrative, regulatory, or institutional mechanisms rather than prices. These include moratoria on new fossil fuel exploration or deforestation, protected-area designations for high-value ecosystems, strategic reserves to manage resource volatility, and certification schemes for sustainable forestry, fisheries, or agriculture. In each case, the policy goal is to limit extraction or harvesting in the public interest and maintain ecosystem integrity.
Governments also play a key role in managing and stabilizing the financial returns from extraction. Many resource-rich economies *ring fence their extraction revenues by setting them aside in [sovereign wealth funds](https://en.wikipedia.org/wiki/Sovereign_wealth_fund) or intergenerational savings funds*. This helps transform temporary resource income into long-term financial assets. Some examples include Norway’s Government Pension Fund Global, the Abu Dhabi Investment Authority, the Kuwait Investment Authority, Chile’s Economic and Social Stabilization Fund, Botswana’s Pula Fund, and Timor-Leste’s Petroleum Fund. Over 40 countries operate similar funds to save for the future, smooth public finances, and invest in development.
In agriculture and renewable resource sectors, similar stabilization mechanisms can be applied through strategic grain reserves, agricultural insurance schemes, or soil and water conservation programs, which preserve productive capacity and reduce volatility in food and commodity markets.
Part 2: Use of extracted resources
2.1: Introduction
Once extracted or harvested, materials, energy, and agricultural outputs enter the production process, where they are combined with labor and capital to create goods and services. This transformation is the core of the economy’s productive activity, where coal and natural gas generate the electricity that powers factories, metals and minerals are turned into machinery and vehicles, and agricultural raw materials, such as grains, oilseeds, fibers, and livestock products, are processed into food, textiles, and bio-based materials.
How efficiently firms and industries carry out this transformation determines both their economic productivity (the amount of output generated per unit of input) and their environmental intensity, or the volume of energy, materials, land, and emissions required for each unit of production.
Over time, improvements in energy, material, and land productivity, where we produce more output with fewer physical inputs, have become the main way economies can grow without proportionally increasing their environmental footprint. These gains come from several sources: technological innovation (for example, more efficient machinery, irrigation, and renewable energy systems), substitution (switching from carbon-intensive fuels to cleaner alternatives, or from scarce to renewable materials), and as we mentioned before, structural change where economies shift from heavy industry toward services and knowledge-based activities, which generally require fewer natural inputs per unit of value added.
The overall effect is known as *decoupling*, when economic growth continues while total resource use or emissions stabilize or decline. Rates of decoupling differ widely across countries and sectors, and across environmental pressures. While some economies have reduced their energy intensity, material and land-use pressures often continue to grow, especially where agricultural expansion drives deforestation or soil degradation.
A brief discussion of the KLEM Framework
Probably a bit of a tangent, but a useful way to conceptualize these relationships is through the KLEM framework, which differentiates four core inputs to production; Capital (K), Labor (L), Energy (E), and *Materials (M), sometimes also extended to include Land (A) and Services (S)*. This framework extends the standard production function by explicitly accounting for natural resource flows alongside traditional economic inputs, providing a bridge between productivity analysis and environmental accounting.
KLEM framework helps explain how technological change and substitution between inputs, for example, replacing material inputs with capital- or knowledge-intensive processes, or substituting irrigated water and fertilizers with improved soil management, can reduce environmental pressure while sustaining growth. The framework has become central in productivity and growth accounting, for example, in the EU via the EUKLEM framework, and some national statistical offices also provide decompose changes in output into contributions from each input and from technical change.
2.2: Link to SNA and SEEA
Within the SNA and the SEEA, the extraction and cultivation of natural resources are recorded across production, accumulation, and balance sheet accounts.
As mentioned in Section 1.2, the agriculture (ISIC A) and extraction sectors (ISIC B) are recorded in the production account, and also in Supply-Use tables (SUTs). Therefore we know the Value Added and contribution of each of these to the economy. Furthermore, SUTs and Input-Output tables (IOTs) tell us how much these extracted resources are used in the economy as a whole. We have covered the SUTs and IOTs in detail in this article.
The SEEA Central Framework extends these monetary accounts by adding physical asset accounts, which record the same resources in their natural units such as tonnes of minerals, barrels of oil, cubic meters of water, or hectares of land. These accounts track opening stocks, extractions, discoveries, natural growth, and closing stocks, allowing analysts to measure both physical depletion and monetary depreciation of natural capital. For renewable resources such as forests, fisheries, and agricultural land, the SEEA also captures changes in productivity or condition, distinguishing between sustainable and unsustainable use.
Using these two frameworks, countries can derive metrics such as depletion-adjusted aggregates such as net value added or resource rent, which reflect the income generated from extraction after accounting for the cost of using up natural capital. This integration also makes it possible to construct indicators like resource intensity (output per unit of material extracted) and natural wealth per capita, showing whether an economy’s growth is being built on sustainable resource use or the erosion of its environmental asset base.
2.3: Policy options
Market-based instruments
From an environmental economics perspective, energy, material, and agricultural inputs are assumed to be underpriced because environmental costs, such as pollution, soil degradation, or water depletion, are not reflected in market prices. Common recommendations include price reforms that remove fossil fuel subsidies or adjust tariffs to reflect environmental costs can correct these distortions, encouraging cleaner and more efficient production. The European Carbon Border Adjustment Mechanism (CBAM) follows a similar principal.
Similarly, a carbon price, implemented through a tax or an emissions trading system, makes it more profitable for firms to invest in low-emission technologies and resource-efficient processes. In agriculture, analogous tools include water pricing, fertilizer taxes, or payment for ecosystem services schemes that reward farmers for maintaining soil carbon, biodiversity, or watershed protection.
Governments can also use tax credits or accelerated depreciation principles from accounting to lower the cost of investing in energy-efficient or low-impact capital, such as renewable energy systems or precision agriculture. Green public procurement, when governments prioritize low-carbon or circular products such as green steel, recycled materials, or sustainably sourced food, can help creates early markets that help these products reach scale and competitiveness. In all cases, price signals align private decisions with the social goal of reducing resource use and emissions.
Non-market instruments
On the non-market instruments side, governments can set minimum efficiency standards or performance requirements for products and production processes. For example, efficiency standards for industrial equipment, best-available technologies for irrigation or livestock management, or building codes that minimize energy and water use.
Circular economy policies go a step further, promoting waste reduction and resource reuse across industries, while sustainable land-use planning and agroecological practices reduce environmental pressure in agriculture.
Public investment and mission-oriented R&D policies, such as supporting innovation in hydrogen, carbon capture, clean fertilizers, and advanced recycling, can help create entirely new technological pathways. Meanwhile, education and workforce training ensure that new technologies can be effectively adopted across sectors, strengthening the link between innovation, productivity, human capital development, and sustainability.
Part 3: From Production to Emissions
3.1: Introduction
Emissions are the unavoidable by-products of economic activity and are emitted wherever fuels are burned or materials are chemically transformed. This is done through energy intensive processes in sectors such as power generation, manufacturing, agriculture, and transportation.
Given that measurements of emissions is not new since the role of emissions in causing climate change was identified over a century ago and by 1970s onwards was pretty much a topic of research. As a result measurement of emissions has improved considerably over the decades given all the frameworks and agreements that have been put into place. The most well known of these is the Paris Agreement (2015) that aims to limit global warming to below 2C by the end of the century. But there are many more accords and pacts currently in place that range from land use, biodiversity protection, forestery, regulation of pollutants and so on.
In terms of Greenhouse gasses (GHGs) harmful emissions such as carbon dioxide (CO₂), methane (CH₄), nitrous oxide (N₂O), and others corresponds to a measurable transaction recorded somewhere in the production or consumption accounts of the economy. Other activities such as electricity consumed by a household, fuel burned by a freight carrier, or fertilizer applied to a crop are also tracked and measured, even more so now with the support of satellite data.
The structure used for global climate reporting through air emission sectors under the United Nations Framework Convention on Climate Change (UNFCCC) aligns closely, but not fully, with the industry classifications of the System of National Accounts (SNA). The UNFCCC divides emissions into key sectors, energy, industrial processes and product use (IPPU), agriculture, waste, and *land use and land use change and forestry (LULUCF).* We can partially map these onto the production accounts of industries such as electricity and gas supply, manufacturing, transport, and agriculture. A UNFCCC sector to SEEA-SNA sector mapping also exists does makes it possible to some extent attribute emissions consistently to economic activity but more work remains to be done here.
A brief overview of the Transport sector
Within this system, transportation occupies a particularly important position. It connects production and consumption, linking all other sectors through the movement of people and goods. Transport-related emissions account for roughly one-quarter of global greenhouse gas emissions, making it one of the fastest-growing sources worldwide.
In national accounts, transport appears in several places. First, transport services (road freight, rail, shipping, air transport, warehousing, and postal services) are recorded as intermediate consumption by firms engaged in logistics and distribution, and as final consumption when purchased directly by households (e.g., public transport, air travel, private vehicle use).
The SNA also includes transport margins, or the value of transport services required to deliver goods from producers to purchasers. In Supply–Use Tables (SUTs), these margins are recorded separately to show the cost of moving goods between producers, wholesalers, and retailers. They are added to the basic price of a product to derive its purchasers’ price, ensuring that transport costs are properly allocated to the goods they accompany rather than being counted as additional output of the goods-producing sector itself. This separation clarifies that a car manufacturer, for instance, produces vehicles but not the transport services that bring them to market, those belong to the transport industry.
From an environmental perspective, this accounting boundary is crucial. It allows transport-related emissions to be traced both directly, from firms operating vehicles as part of their core activity, and indirectly, through transport margins that embed emissions within traded goods. Thus, a product’s carbon footprint includes not only the emissions from its manufacture but also those from the freight services required to deliver it domestically or internationally.
Transport emissions arise primarily from the combustion of fossil fuels (gasoline, diesel, jet fuel, and heavy oils), but also include indirect emissions from electricity use (as in electric rail or vehicles) and non-CO₂ gases such as nitrogen oxides (NOx) and particulate matter (PMx), which affect local air quality and health.
The rapid expansion of global trade and urban mobility has increased the volume of transport services, embedding emissions deeply in global value chains. In other words, even goods that appear low-carbon in one country may have a significant emission footprint abroad, associated with the transport margins and production processes that brought them to market.
3.2: Link to SNA and SEEA
The SEEA Air Emission Accounts (SEEA AEA) provide the formal bridge between national greenhouse gas inventories and the System of National Accounts (SNA), which records production, income, and expenditure. These accounts were developed so that the environmental data countries report under the UNFCCC could also be analyzed in economic terms, using the same industrial and institutional classifications that underpin GDP.
In practice, the SEEA AEA allocate emissions of Carbon Dioxide (CO₂), Methane (CH₄), Nitrous oxide (N₂O), and Fluorinated gases to the domestic economic units (industries, households, and government) responsible for generating them. This alignment with the SNA allows physical emission data (in tonnes) to be linked directly to monetary transactions (in currency units), enabling consistent measurement of emission intensities, sectoral footprints, and decoupling trends between economic growth and environmental pressure.
The structure of the SEEA AEA mirrors the SNA’s SUT and IOT frameworks, which record how industries buy, transform, and sell goods and services. This makes it possible to map emissions precisely to the activities that cause them and to trace how they are embedded along production and trade chains. For instance, the energy industries, electricity, gas, and steam production, generate large amounts of CO₂ from fuel combustion. Through input-output analysis, these emissions can be reallocated to the sectors that purchase energy, such as manufacturing, construction, or services, providing a full picture of indirect or embodied emissions. Three emissions-intensive sectors are briefly discussed below:
- Within manufacturing, emissions arise from two main sources: (a) fuel combustion, as factories use energy to power machinery and processes, and, (b) industrial processes, where chemical transformations release gases independently of energy use. For example, calcination of limestone in cement clinker production, reduction of iron ore in steel blast furnaces, or ammonia synthesis in fertilizer manufacturing.
- Transport is treated as a cross-cutting source of emissions because it links nearly every sector of the economy. In the AEA, transport emissions are divided between household final consumption (private vehicle use and air travel) and intermediate consumption (freight and logistics services used by firms). These emissions include not only CO₂ from fuel combustion but also nitrogen oxides (NOₓ), sulfur dioxide (SO₂), and particulate matter (PM), pollutants that directly affect urban air quality and human health.
- The agriculture sector contributes substantial non-CO₂ emissions, notably methane from livestock digestion (enteric fermentation) and rice cultivation, and nitrous oxide from fertilizer use and soil management. Meanwhile, waste management produces methane emissions from landfills and wastewater treatment.
The integration of these physical emission accounts within the monetary structure of the SNA, also allows us to compare production-based and consumption-based footprints, and reconcile national emission inventories with economic activity.
3.3: Policy options
Market-based instruments
Market-based instruments aim to reduce emissions by changing relative prices by making polluting activities more expensive and cleaner alternatives more attractive. The most well-known examples are carbon taxes and Emissions Trading Scheme (ETS). A carbon tax places a uniform price on each tonne of CO₂ emitted, giving firms and households a direct financial incentive to reduce fossil fuel use and to innovate toward lower-carbon production. In contrast, an ETS sets a cap on total emissions and allows firms to trade emission permits, ensuring that reductions occur where they are cheapest. Both tools create an economy-wide marginal abatement cost, a price signal that guides producers and consumers toward more efficient energy use and cleaner technologies. In accounting terms, these instruments appear in the System of National Accounts (SNA) as taxes on products or other taxes on production, with the revenues entering government accounts and any redistribution, such as rebates to households or industry transition funds, recorded as current transfers.
Beyond economy-wide carbon pricing, differentiated fuel taxes and feebate schemes (which combine fees on high-emission products with rebates for low-emission ones) can target specific sectors, such as road transport or heating. These mechanisms influence consumer choices without prescribing particular technologies, allowing flexibility in how emissions are reduced. For industries that are harder to decarbonize, such as cement, steel, or chemicals, tradable performance standards or credit mechanisms can reward firms that outperform emissions benchmarks, creating a market for low-carbon innovation. At the same time, green public procurement, when governments preferentially purchase low-carbon goods and materials, can create early demand for emerging technologies, helping them reach commercial scale. Together, these market-based measures use the power of prices and incentives to align individual economic behavior with collective climate goals, integrating seamlessly into the existing framework of production, income, and taxation captured by the national accounts.
Non-market based intruments
In terms of non-market measures, Governments can impose binding emission standards for vehicles, power plants, and industrial equipment, or adopt intensity targets that require firms to reduce emissions per unit of output. In the power sector, renewable portfolio standards oblige electricity providers to generate a specified share of energy from renewable sources, while mandates for low-carbon process routes, such as green hydrogen in steelmaking or electric arc furnaces in recycling, drive structural change in heavy industry.
Large-scale public investment also plays a decisive role. Expanding electric grids, energy storage, charging infrastructure, and public transit systems reduces the cost and inconvenience of low-emission alternatives, while intermodal freight corridors can shift goods movement from road to rail, cutting fuel consumption and congestion. These expenditures appear in the SNA as gross fixed capital formation (when they create long-lived assets) or as government final consumption (when they provide ongoing services). Complementary information-based policies, such as mandatory corporate emissions disclosure, product labeling, and carbon footprint reporting, extend incentives down value chains by making the climate impact of goods and services visible at the point of purchase. Over time, these rules and infrastructure investments change the structure of intermediate consumption itself, replacing fossil-based inputs with renewable energy and low-carbon materials.
Part 4: Feedback of Emissions on the Economy
4.1: Introduction
Climate change is also a macroeconomic phenomenon that feeds back into the very system that generates it. The buildup of greenhouse gases in the atmosphere alters temperature, precipitation, and weather patterns, which in turn affect the productivity of land, labor, and capital, the core factors of production. These impacts return to the economy as measurable losses in output, income, and wealth, and as changes in the composition and value of assets across industries and regions. In economic terms, climate change introduces a new category of risk and depreciation that traditional accounting systems have only recently begun to capture.
The climate system returns the consequences of emissions to the economy through two broad channels; physical risks and transition risks. Physical risks refer to the direct and tangible effects of a changing climate on people and assets. They include acute shocks such as floods, storms, and wildfires that destroy infrastructure and disrupt production, as well as chronic stresses such as rising sea levels, drought, and extreme heat that gradually erode agricultural yields, labor productivity, and the useful life of capital. These damages are increasingly quantifiable through insurance losses, asset revaluations, and declines in service capacity, all of which have clear counterparts in the accumulation and balance sheet accounts of the SNA.
Transition risks, by contrast, arise not from the physical effects of climate change but from the economic adjustments society makes in response to it. As governments introduce new regulations, carbon pricing, or phaseouts of fossil fuels, and as technologies and consumer preferences evolve, certain industries and assets may lose value while others gain. Coal-fired power plants may become stranded, while renewable energy and low-carbon infrastructure attract new investment. Carbon asset stranding can also create balance sheet risks. And since financial markets also internalize these risks through repricing of equities, bonds, and commodities, reshaping patterns of savings and investment across the economy we also have to deal with financial risks.
A complete accounting of climate change must therefore incorporate how these feedbacks, or climate damages, appear in the core economic aggregates. For example, in output through changes in productivity and sectoral composition, in income through shifts in employment, wages, and profits, in balance sheets through the revaluation or destruction of assets, and in distribution through the unequal exposure of households, regions, and industries.
4.2: Link to SNA and SEEA
Within the SNA and the SEEA, the economic consequences of climate change are captured across multiple layers of the accounting framework, ranging from production and income to accumulation, balance sheets, and environmental asset accounts. By doing so, we get a better picture of how climate impacts alter the value of assets, disrupt production, and change how income and wealth are generated, distributed, and sustained over time.
At the most immediate level, climate-related disasters such as hurricanes, floods, droughts, and wildfires are recorded in the SNA under Other Changes in the Volume of Assets. This account captures sudden, non-economic events that destroy or degrade assets without being the result of market transactions. When a flood washes away roads or a wildfire destroys housing, the corresponding reduction in asset value is entered as a negative adjustment to the national balance sheet. These events reduce the net worth of households, businesses, and governments, and therefore the national wealth of the economy as a whole. Over time, increasing frequency and severity of climate events also affect consumption of fixed capital (depreciation), since assets in exposed regions wear out faster or require more frequent replacement. Overall, such exposure also affect insurance markets, especially premiums and the coverage of insurance, which in turn impact housing markets.
The SEEA complements the economic impacts by extending accounting to natural capital and ecosystem services. Environmental degradation, such as soil erosion, forest loss, and coastal damage, appears as declines in the physical and monetary value of environmental assets. These are recorded in SEEA Ecosystem Extent and Condition Accounts, which track how climate change and land-use pressures degrade the capacity of ecosystems to provide services like water regulation, carbon storage, and flood protection. This also helps us figure out the usually hidden depreciation of natural capital that traditional SNA accounts may overlook.
Production and income accounts reflect climate feedbacks indirectly. Extreme heat can reduce labor productivity in agriculture, construction, and manufacturing, lowering value added. Droughts or floods can interrupt intermediate consumption flows, causing supply bottlenecks and output losses. Conversely, reconstruction and adaptation activities can temporarily increase GDP, even as underlying balance sheets declines. These dynamics highlight the need to distinguish between gross output (which may rise during rebuilding) and net value added (which may fall once depreciation and asset losses are considered).
In the accumulation accounts, investment in adaptation and resilience is recorded as gross fixed capital formation (GFCF) when it creates long-lived assets such as flood defenses, seawalls, storm-resilient infrastructure, or upgraded energy systems. These expenditures expand productive capacity while reducing future vulnerability. These functions as mitigation investments against asset loss. In contrast, disaster relief, emergency services, and maintenance spending appear as current government consumption, representing the ongoing cost of living with climate risks rather than long-term mitigation.
Climate change also affects the financial accounts and balance sheets, as asset prices and liabilities adjust to reflect new risks. Insurance payouts and disaster compensation are recorded as current transfers between sectors, often from financial corporations or governments to households and firms. Large insured losses can create significant fiscal and Balance of Payments impacts, particularly where reinsurance flows cross national borders. Similarly, the repricing of carbon-intensive assets, such as fossil-fuel reserves, coal-fired power plants, or industrial equipment, appears as holding losses in the Revaluation Account, reflecting their declining market value as global energy systems transition.
The distribution of income and wealth is also reshaped by climate feedbacks. Households in vulnerable regions, informal workers, and small businesses often face the greatest losses and slowest recovery, while sectors linked to renewable energy, adaptation infrastructure, or insurance may see rising incomes. Capturing these redistributive effects within the SNA enables an integrated assessment of economic resilience, social equity, and sustainability.
4.3: Policy options
Market-based instruments
As physical and transition risks become more visible, investors, insurers, and governments are developing ways to price climate risk explicitly into financial decision-making. One key instrument is risk-based insurance pricing, which adjusts premiums according to the exposure of assets to floods, storms, or wildfires. In the SNA, these appear as current transfers and output of insurance services, while insurance claims and reinsurance flows reflect the redistribution of losses across sectors and borders. By incorporating climate risk into premiums, insurers create signals that guide households and firms toward more resilient investment decisions.
Financial markets are also responding through instruments that spread or reallocate climate risk. *Catastrophe bonds and [parametric insurance](https://en.wikipedia.org/wiki/Parametric_insurance) allow for instant and automatic pay outs when predefined physical thresholds are crossed, transferring extreme-event risks to global investors. These are recorded in the SNA as financial transactions and changes in liabilities. To some extent these represent market responses that transform uncertain environmental losses into tradable financial products. Similarly, [green bonds](https://en.wikipedia.org/wiki/Green_bond), resilience bonds, and sustainability-linked loans raise capital for adaptation infrastructure or emission-reduction projects, with their proceeds entering the national accounts as gross fixed capital formation in the public or private sectors. Countries such as France, Chile, and Singapore now issue sovereign green bonds* to finance climate-resilient transport systems, energy grids, and flood defences, which in the latest version of the SNA are recorded as investments that appear as asset creation rather than current expenditure.
Another emerging set of tools focuses on the revaluation of assets and liabilities in response to transition risks. Central banks and financial supervisors increasingly require *climate stress tests* and taxonomy-based disclosures, enabling investors to distinguish between carbon-intensive and climate-aligned assets. These frameworks influence the Revaluation Account of the SNA, as the market values of fossil-fuel reserves, carbon-intensive firms, and related financial instruments adjust to changing expectations about policy and technology. Over time, such instruments help shift portfolios toward low-carbon industries and protect national wealth from climate-driven devaluation.
Non-market based instruments
Non-market based instruments include public investment in climate-resilient infrastructure, land-use planning, and ecosystem restoration. Large-scale adaptation projects, such as coastal protection, flood barriers, drought-resistant water systems, or climate-resilient transport corridors, appear in the SNA as gross fixed capital formation, expanding the stock of produced assets while reducing the risk of future losses. Maintenance and emergency operations are recorded as government final consumption, representing the ongoing cost of ensuring safety and service continuity under changing climatic conditions.
Urban and regional planning plays a crucial role in reducing exposure before disasters occur. Zoning laws, building codes, and setback regulations prevent development in high-risk areas, lowering the accumulation of vulnerable capital. These non-market rules do not always have direct monetary counterparts in the SNA, but their effects are reflected indirectly in lower depreciation rates and smaller losses in the Other Changes in the Volume of Assets account. Similarly, ecosystem-based adaptation, such as wetland restoration, mangrove protection, or reforestation, provides natural buffers against floods and storms while supporting biodiversity and carbon sequestration. These activities can be captured through the SEEA Ecosystem Accounts, which extend the SNA by assigning value to ecosystem services that reduce physical risks and enhance social welfare.
Non-market measures also include public financial support for communities and sectors most exposed to climate change. Social protection programs, post-disaster cash transfers, and targeted subsidies for adaptation investments are recorded as current transfers from government to households and firms. These mechanisms not only cushion the economic impact of climate shocks but also strengthen equity and resilience, ensuring that vulnerable groups can recover and reinvest. Education and training programs further enhance long-term adaptability by improving the capacity of workers and institutions to operate under new climatic and technological conditions.
Concluding points
The four dimensions discussed above: (1) resource extraction, (2) resource use, (3) emissions from production, and (4) the feedback of emissions on the economy, form a complete cycle linking the natural environment with the economic system. Each represents a distinct point of interaction between the physical and monetary worlds. Therefore, we want to move away from thinking about climate change as some exogenous outcome, and move towards understanding climate change as a symbiotic economy-environment relationship that can be split into concrete stages.
We already have the *System of National Accounts (SNA) and the the System of Environmental-Economic Accounting (SEEA)* as the frameworks that make these interactions visible. Therefore, once emissions, depletion, and climate risks are quantified in the same terms as GDP, investment, and savings, policymakers can evaluate not only how much the economy produces, but also whether that production is sustainable and resilient over time.
Understanding these relationships also underscores the interdependence of policy domains. And managing climate change is not only a matter of environmental regulation or energy transition, it is also deeply linked to issues of macroeconomic policy. Fiscal policy, industrial strategy, public investment, and financial regulation all determine how efficiently resources are used, how quickly economies decarbonize, and how well societies adapt to a changing climate. Market-based instruments create the price signals that steer private behavior, while non-market measures, such as regulations, standards, infrastructure planning, creation of sovereign wealth funds, provide the institutional foundation for collective resilience. Hence each of these tools should be taken as complementary mechanisms for maintaining both economic and ecological balance.
This was already a very long post with fancy visualizations and interactive graphics, but it is a key one. It closes the loop of the previous nine articles which laid the foundations for understanding how national accounts function, how we produce, how we measure GDP, how we deal with income and income uses, and how we report interactions with the external sector through trade and finance.
We will continue to discussions by diving deeper into some of the topics highlighted above. As always, any comments and feedback are always highly appreciated.
About the author
Asjad Naqvi is an economist based in Vienna, Austria. He has been teaching, doing research and policy work on macro-financial-climate topics for over a decade. You check his profile and projects on GitHub or on his personal website. You can connect with him via Medium, Twitter/X, BlueSky, LinkedIn, or simply via email: asjadnaqvi@gmail.com.
Subscribe, Clap, and/or Follow the Guide if you like the content!
메타데이터
- post_id
- ebef41de98e2
- slug
- climate-change-and-the-system-of-national-accounts-ebef41de98e2
- url
- https://medium.com/macrocritical/climate-change-and-the-system-of-national-accounts-ebef41de98e2
- canonical_url
- https://medium.com/macrocritical/climate-change-and-the-system-of-national-accounts-ebef41de98e2
- author_url
- https://medium.com/@asjadnaqvi
- status
- ok
- fetched_at
- 2026-06-13 12:55:53