Automating Fundamental Analysis: Building a PostgreSQL Pipeline with SQLAlchemy
One of the toughest parts of any data science project is the acquisition of real-world data. There is always toy data available on Kaggle…
Automating Fundamental Analysis: Building a PostgreSQL Pipeline with SQLAlchemy
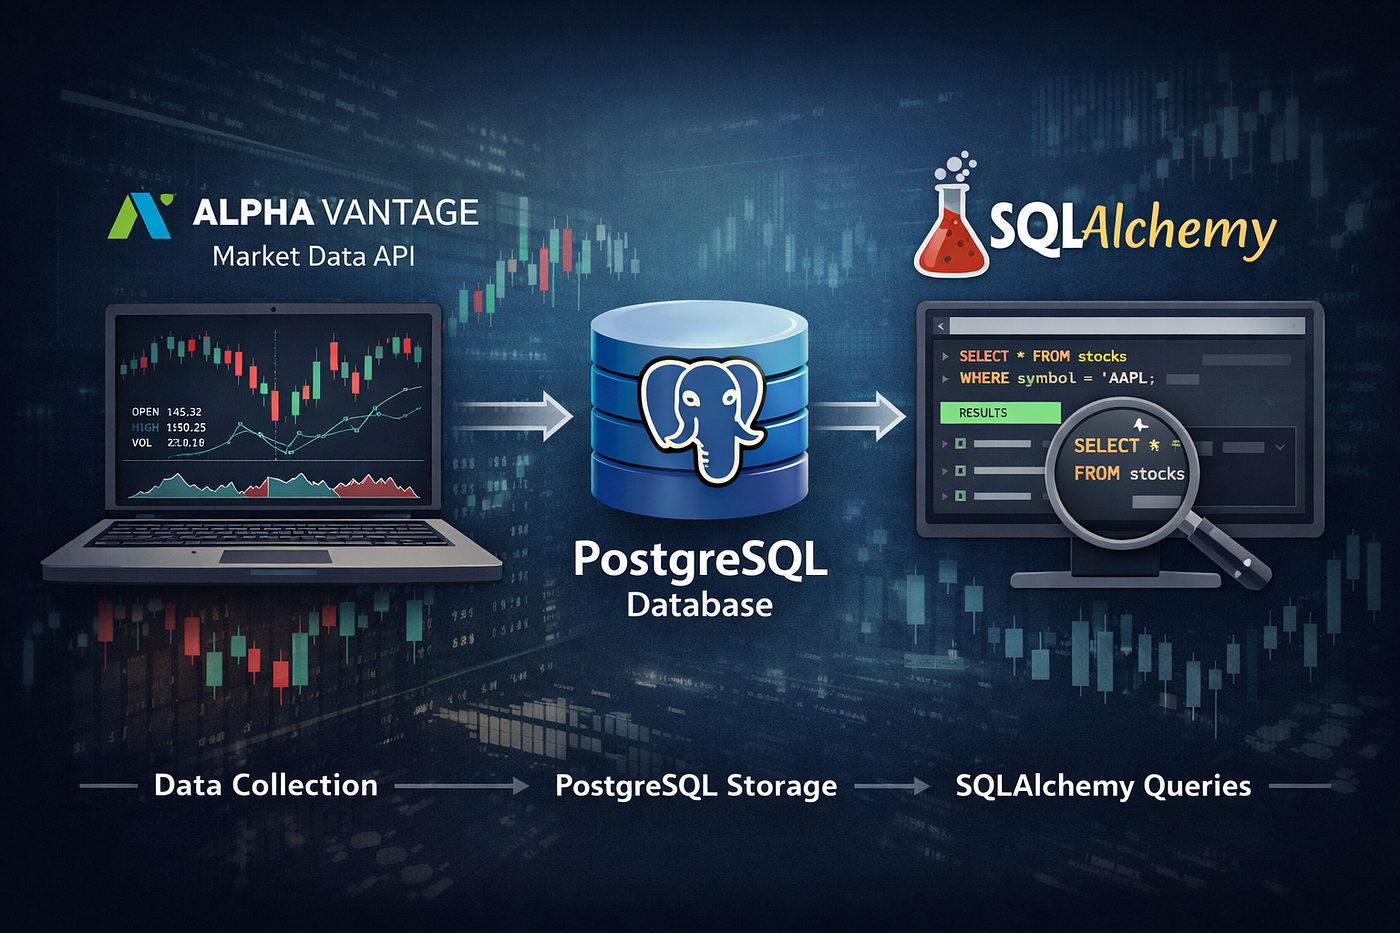
Image created using chatgpt
One of the toughest parts of any data science project is the acquisition of real-world data. There is always toy data available on Kaggle or some real statistics on various topics from Statistisches Bundesamt here in Germany. But these data do not prepare you for real-world analysis. Kaggle’s datasets are too good to be true. Mostly very well cleaned and presented in a nice CSV format. At least the datasets from Statistisches Bundesamt need some data cleaning before being used in any ML models.
When it comes to financial data analysis, one can’t expect realtime OHLCV or fundamental data of a company for free. There is always Yahoo Finance which provides the required data about any company in the US for non-commercial purposes. The wrappers built around them in Python help us to scrape the information, but your IP address will be blocked if they see more traffic. Instead of sending requests to these endpoints whenever required, I decided to build my own database using Postgres. I started using the Alpha Vantage API to request the fundamental data and Yahoo Finance to scrape OHLCV data, subsequently ingesting it into my Postgres database. The good news about requesting fundamental data of companies is that they are released on a quarterly basis. With the free tier (25 requests per day and 5 requests per minute) available from Alpha Vantage, one can stay well below the limit and request the financial statements of the companies one wishes to analyse. While scraping OHLCV data from Yahoo Finance, be humble and don’t send too many requests in a single minute. You will surely be blocked very soon.
Part 1: Data Modelling
Alpha Vantage provides a handful of fundamental data for any listed company in the US. For this project, I began to use Company Overview, Corporate Action — Dividends, Corporate Action — Splits, Income Statement, Balance Sheet, Cash Flow, Shares Outstanding, Earnings history, and earnings estimates. In addition, I created a stock and currency table to avoid storing the ticker names and currency in every other table to save some precious memory while querying.

Image taken from alpha vantage website
One major design feature which is not visible from the schema below: I partitioned the time series data (OHLCV) based on the year for query optimization.

partitioning ohlcv table using the year
Overall, in most of the tables in the schema, composite primary keys are being used to avoid duplicate data being ingested. For example: the balance_sheet table has a composite primary key comprising stock_id, fiscal_date_ending, and report_type. A single row in a balance sheet can belong to a particular company which releases the statement on a particular date, and the corresponding report type can be either annual or quarterly. Since annual and quarterly reports have the same release dates once a year, enforcing this constraint lets us add a row with the same stock_id and fiscal_date_ending with a different report type (check the last two entries carrying the following date: 2025–09–30).

balance sheet showing three columns: stock_id, fiscal_date_ending and report_type
I have included one very important composite foreign key constraint on the income statement and cash flow tables which references the composite primary key (stock_id, fiscal_date_ending, and report_type) of the balance sheet. Since the three statements are always read together, if an entry is missing in the balance sheet but the income statement and cash flow have it, Postgres will throw a foreign key constraint error during data ingestion.

foreign key constraint on cash flow table
Assembling it all together, this is the final schema that I designed for my project to study the effect of financial statements on the stock price.

schema of the alpha_vantage_db created using drawSQL
Part 2: Data Ingestion using postgres and Sqlalchemy
Two methods exist to ingest data into the tables.
Method 1 is to directly copy the values into the tables using Postgres like below, provided the data to be copied is already requested from Alpha Vantage or Yahoo Finance and saved as a CSV file.
COPY alpha_vantage_db.balance_sheet
    (
        fiscal_date_ending,
        reported_currency,
        total_assets,
        total_current_assets,
        cash_and_cash_equivalents_at_carrying_value,
        cash_and_short_term_investments,
        inventory,
        current_net_receivables,
        total_non_current_assets,
        property_plant_equipment,
        accumulated_depreciation_amortization_ppe,
        intangible_assets,
        intangible_assets_excluding_goodwill,
        goodwill,
        investments,
        long_term_investments,
        short_term_investments,
        other_current_assets,
        other_non_current_assets,
        total_liabilities,
        total_current_liabilities,
        current_accounts_payable,
        deferred_revenue,
        current_debt,
        short_term_debt,
        total_non_current_liabilities,
        capital_lease_obligations,
        long_term_debt,
        current_long_term_debt,
        long_term_debt_noncurrent,
        short_long_term_debt_total,
        other_current_liabilities,
        other_non_current_liabilities,
        total_shareholder_equity,
        treasury_stock,
        retained_earnings,
        common_stock,
        common_stock_shares_outstanding,
        stock_id
    )
FROM '/tmp/google_balance.csv'
DELIMITER ','
CSV HEADER;
Querying from Alpha Vantage is straightforward. Using the API key obtained from Alpha Vantage, the function name, and the ticker name in the endpoint, the requested function is returned by Alpha Vantage. You can write the dataframe to a CSV file and copy the CSV data into the tables.
def query_all_statements(ticker,query_func = None):
    """
    Fetches and normalizes financial statement data from the Alpha Vantage API.

    Loops through a provided dictionary of Alpha Vantage API functions, sends HTTP
    requests for the specified ticker, handles standard API rate limits by pausing
    execution, and flattens the resulting JSON data into a pandas DataFrame.

    Args:
        ticker (str): The stock symbol to query (e.g., 'AAPL', 'MSFT').
        query_func (dict, optional): A dictionary where keys are Alpha Vantage
            API function strings (e.g., 'INCOME_STATEMENT', 'OVERVIEW') and values
            are the expected JSON data keys to extract. Defaults to None.

    Returns:
        pandas.DataFrame: A normalized DataFrame containing the data from the
        final API function processed in the loop. Returns None if query_func is None.
    """
    if query_func != None:
        function_names = query_func
    else:
        return

    key, value = next(iter(function_names.items()))

    for func in function_names:
        url = f'https://www.alphavantage.co/query?function={func}&symbol={ticker}&apikey={read_api_key()}'
        return_statement = return_json(url)

        # 1. Check for API limit or Error messages
        if "Information" in return_statement:
            print(f"⚠️ API Limit hit on {func}. Skipping...")
            time.sleep(60) # Wait a full minute if limited
            continue

        if func in ["INCOME_STATEMENT","BALANCE_SHEET","CASH_FLOW"]:
            print(f"key is {func}")#, value is {function_names[func]}")
            df = pd.json_normalize(return_statement)#.get(function_names[func]))#.set_index("fiscalDateEnding")
        elif func == "OVERVIEW":
            print(f"key is {func}, value is {function_names[func]}")
            df = pd.json_normalize(return_statement)#.set_index("Symbol")
        else:
            print(f"key is {func}, value is {function_names[func]}")
            df = pd.json_normalize(return_statement.get(function_names[func]))

    return df
Method 2 is a more sophisticated way to insert the requested data into the database using SQLAlchemy. One major advantage of this Python library is that it is independent of the database you wish to use. In the future, if you wish to change the database, you only need to change the connection string and nothing more. That’s the power of SQLAlchemy.
Within SQLAlchemy, there are two ways you can work with databases: Core and ORM. The major difference between the two approaches is that Core views the database as a collection of tables, columns, and SQL expressions. The ORM wraps Core to view the database as a collection of Python objects (classes) linked by relationships.
The following is taken from their documentation:
SQLAlchemy Core is the foundational architecture for SQLAlchemy as a “database toolkit”. The library provides tools for managing connectivity to a database, interacting with database queries and results, and the programmatic construction of SQL statements
SQLAlchemy ORM builds upon the Core to provide optional object relational mapping capabilities. The ORM provides an additional configuration layer allowing user-defined Python classes to be mapped to database tables and other constructs, as well as an object persistence mechanism known as the Session. It then extends the Core level SQL Expression Language to allow SQL queries to be composed and invoked in terms of user-defined objects.
The first step is always creating an engine to connect to the database:
encoded_pw = urllib.parse.quote_plus(db_pw)
url = f"postgresql://postgres:{encoded_pw}@localhost:5432/postgres"
engine = create_engine(url)
Instantiate all the available tables in the schema as classes using the ORM way:
# declarative base class
class Base(DeclarativeBase):
    pass

# Load the "Parent" first
class BalanceSheet(Base):
    __tablename__ = "balance_sheet"
    __table_args__ = {"autoload_with": engine, "schema": "alpha_vantage_db"}

# Then load the "Children"
class IncomeStatement(Base):
    __tablename__ = "income_statement"
    __table_args__ = {"autoload_with": engine, "schema": "alpha_vantage_db"}

class CashFlow(Base):
    __tablename__ = "cash_flow"
    __table_args__ = {"autoload_with": engine, "schema": "alpha_vantage_db"}

class SharesOutstanding(Base):
    __tablename__ = "shares_outstanding"
    __table_args__ = {"autoload_with": engine, "schema": "alpha_vantage_db"}

class Splits(Base):
    __tablename__ = "splits"
    __table_args__ = {"autoload_with": engine, "schema": "alpha_vantage_db"}

class Dividends(Base):
    __tablename__ = "dividends"
    __table_args__ = {"autoload_with": engine, "schema": "alpha_vantage_db"}

class Earnings(Base):
    __tablename__ = "earnings"
    __table_args__ = {"autoload_with": engine, "schema": "alpha_vantage_db"}

class EarningsEstimates(Base):
    __tablename__ = "earnings_estimates"
    __table_args__ = {"autoload_with": engine, "schema": "alpha_vantage_db"}

class Overview(Base):
    __tablename__ = "overview"
    __table_args__ = {"autoload_with": engine, "schema": "alpha_vantage_db"}

class Stock(Base):
    __tablename__ = "stock"
    __table_args__ = {"autoload_with": engine, "schema": "alpha_vantage_db"}

class Currency(Base):
    __tablename__ = "currency"
    __table_args__ = {"autoload_with": engine, "schema": "alpha_vantage_db"}

class OHLCV(Base):
    __tablename__ = "ohlcv"
    __table_args__ = {"autoload_with": engine, "schema": "alpha_vantage_db"}
Below is the Python function to write to the PostgreSQL database:
def write_to_postgres(df, tablename, stock_id, engine, schema_name, column_mapping=None):
    """
    Executes a bulk insert from a pandas DataFrame to PostgreSQL.

    Cleans incoming data, normalizes missing or invalid numeric and string formats
    to database NULLs (`None`), reflects the target schema structure, and executes
    a PostgreSQL-specific `ON CONFLICT DO NOTHING` statement based on primary keys.

    Args:
        df (pandas.DataFrame): The source financial or metadata records to insert.
        tablename (str): Target table name in the PostgreSQL database.
        stock_id (int): The foreign key ID linking records to a specific stock.
        engine (sqlalchemy.engine.Engine): Active SQLAlchemy database engine/connection pool.
        schema_name (str): PostgreSQL schema where the target table resides.
        column_mapping (dict, optional): Mapping to rename DataFrame columns to match
            database column definitions (`{'df_col': 'db_col'}`). Defaults to None.

    Returns:
        None: Outputs an execution summary containing processed, inserted, and
        skipped row counts directly to the console.
    """
    # 1. Clean and prepare the DataFrame copy
    df_clean = df.copy()

    # Conditionally set stock_id (skip if None for table 'stock')
    if stock_id is not None:
        df_clean["stock_id"] = stock_id

    if isinstance(column_mapping, dict) and column_mapping:
        df_clean.rename(columns=column_mapping, inplace=True)

    df_clean.drop("Unnamed: 0", axis=1, inplace=True, errors='ignore')

    # 2. Convert DataFrame rows into a list of dictionaries
    records = df_clean.to_dict(orient="records")
    if not records:
        print(f"[{tablename}] No data rows found to insert.")
        return

    nan_identifiers = {"nan", "nan", "none", "null", "","-"}

    for record in records:
        for key, value in record.items():
            # Check for float NaN / math NaN
            if isinstance(value, float) and math.isnan(value):
                record[key] = None
            # Check for numpy NaN values
            elif value is np.nan or pd.isna(value):
                record[key] = None
            # Check for remaining invalid string variants
            elif isinstance(value, str) and value.strip().lower() in nan_identifiers:
                record[key] = None

    # 3. Reflect the target table structure from the database
    metadata = MetaData(schema=schema_name)
    target_table = Table(tablename, metadata, autoload_with=engine)

    # 4. Automatically detect the primary key columns to use as the conflict target
    conflict_targets = [col.name for col in target_table.primary_key.columns]

    # 5. Construct the safe bulk insert statement
    stmt = insert(target_table).values(records)
    safe_stmt = stmt.on_conflict_do_nothing(index_elements=conflict_targets)

    # 6. Execute bulk operation inside a transaction block
    with engine.begin() as conn:
        result = conn.execute(safe_stmt)

        total_rows = len(records)
        inserted_rows = result.rowcount
        conflicts = total_rows - inserted_rows

        print(f"Bulk Transfer Summary for {schema_name}.{tablename}:")
        print(f" -> Total rows processed: {total_rows}")
        print(f" -> Successfully inserted: {inserted_rows}")
        print(f" -> Skipped due to duplicate conflicts: {conflicts}")
By doing it this way, you can stay completely within Python to insert data into the database, making the process entirely independent of the database engine you are using.
Part 3: Data Querying using SQLAlchemy
In order to query the data, you can reuse the same engine and classes created during the insert process. Pass a SQL-like statement to the Pandas read_sql function to read the tables.
stmt = (
    select(IncomeStatement,Stock)
    .join(
        Stock,
        and_(
            IncomeStatement.stock_id == Stock.stock_id
        )
    )
    .where(Stock.ticker == 'AAPL' )
)

income_df = pd.read_sql(stmt, engine)
Once you have the queried table as a Pandas DataFrame, you can continue your usual exploratory data analysis. For illustration purposes, I calculated some ratios from the income statement and saved them as DataFrame columns.
income_df_annual = (income_df_annual
                    .assign(revenue_growth = lambda x: (x["total_revenue"] - x["total_revenue"].shift(-1))/x["total_revenue"].shift(-1)*100,
                            gross_margin = lambda x: x["gross_profit"]/x["total_revenue"] * 100,
                            operating_margin = lambda x: x["ebit"]/x["total_revenue"] * 100,
                            net_margin = lambda x: x["net_income"]/x["total_revenue"] * 100,
                            cogs_margin = lambda x: x["cost_of_revenue"]/x["total_revenue"] * 100
                            )
                    )
Below, you can find the revenue growth of Apple from 2006 to 2025. Apple’s revenue growth saw double-digit growth from 2006 to 2012, which was likely driven by the annual iPhone releases.
fig, ax = plt.subplots()

x = income_df_annual["fiscal_date_ending"][:-1]
y = income_df_annual["revenue_growth"][:-1]

ax.bar(x, y, width=100, color='skyblue', edgecolor='black')
ax.set_xticks(x)

plt.xticks(rotation=90)
plt.ylabel("Revenue Growth")
plt.title("Year-on-Year Revenue Growth")

plt.tight_layout()
plt.show()
Apple’s revenue growth
Looking only at revenue does not show a clear picture of Apple’s financials. Digging deeper into Apple’s income statement, you can see how the company has maintained a high gross margin for most years, which is a good sign for a manufacturing company.
fig, ax = plt.subplots(figsize=(14,10))

#x = np.arange(0, len(income_df_annual))

ax.bar(
    income_df_annual["fiscal_date_ending"],
    income_df_annual["cogs_margin"],
    label="COGS Margin",
    width=100
)

ax.bar(
    income_df_annual["fiscal_date_ending"],
    income_df_annual["gross_margin"],
    label="Gross Margin",
    bottom=income_df_annual["cogs_margin"],
    width=100
)

ax.axhline(50, 0, 1, c="red", ls="--")
ax.set_xticks(income_df_annual["fiscal_date_ending"])

plt.xticks(rotation=90)
ax.set_title("Revenue composition")
ax.set_ylabel("Margins")
ax.set_xlabel("Year")
ax.legend(bbox_to_anchor=(1,1))
Composition of gross profit and cost of goods sold
Next Steps….
The above plots were just a sample to show that the data pipeline worked. In the next post, I will dig deeper into different financial statements to see how the numbers add up for different companies. The goal of my project is to use fundamental analysis to predict future stock returns. In the course of reaching this goal, I will be using different tools, libraries, and technologies, which I will share as part of my learnings.
I will share the GitHub link for the complete project once an initial version is ready. Since the project involves many steps, I will keep updating the GitHub repository over the coming months. Feel free to check out the project.
메타데이터
- post_id
- ecec12a8966f
- slug
- automating-fundamental-analysis-building-a-postgresql-pipeline-with-sqlalchemy-ecec12a8966f
- url
- https://medium.com/@kumar.byes/automating-fundamental-analysis-building-a-postgresql-pipeline-with-sqlalchemy-ecec12a8966f
- canonical_url
- https://medium.com/@kumar.byes/automating-fundamental-analysis-building-a-postgresql-pipeline-with-sqlalchemy-ecec12a8966f
- author_url
- https://medium.com/@kumar.byes
- status
- ok
- fetched_at
- 2026-06-14 11:28:49