Investor optimism leads to WTI oil rising 2.4%
WTI oil prices on Monday have risen to a high of 79.81 from a low of 77.52. It draws a long body bullish candlestick with almost no shadow…
Investor optimism leads to WTI oil rising 2.4%
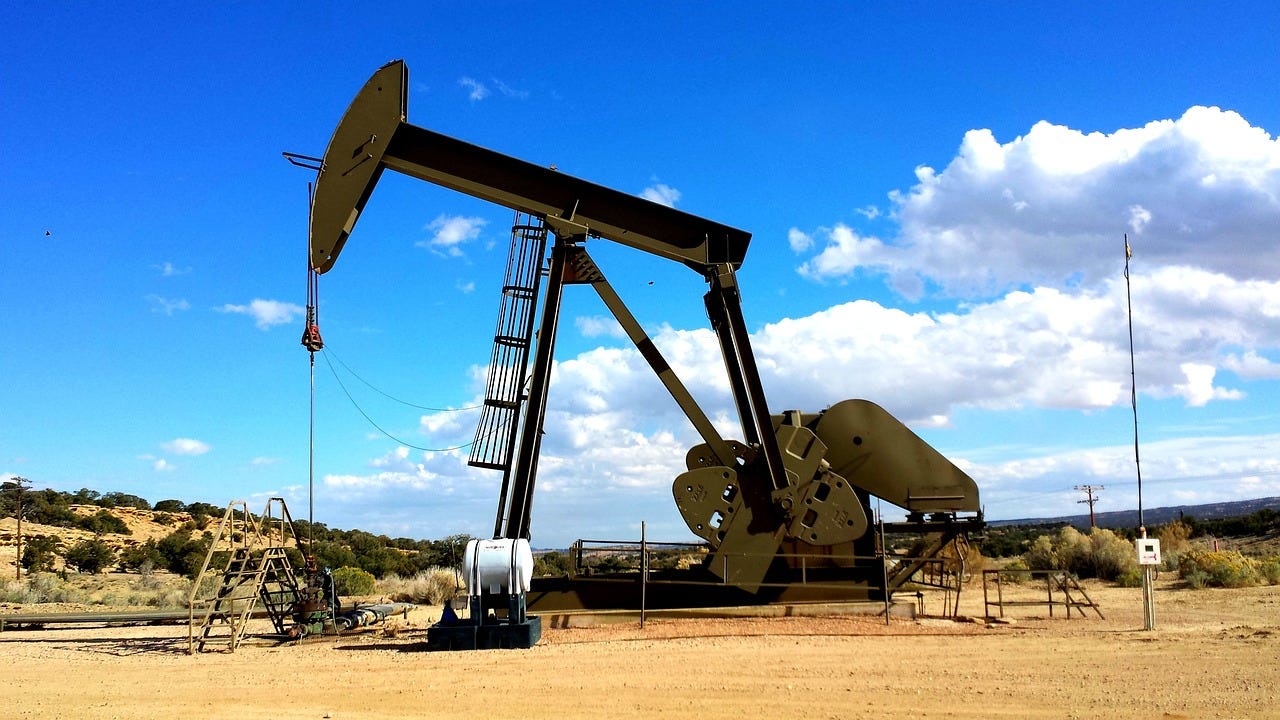
WTI oil prices on Monday have risen to a high of 79.81 from a low of 77.52. It draws a long body bullish candlestick with almost no shadow on the top and bottom of the candle.
OPEC+ has gone to great lengths to reassure markets that it can rethink plans to supply more barrels to the market if conditions dictate. Reuters reported that traders on Monday bought back the oil they sold last week following assurances from OPEC+.
Apart from that, Chinese economic data also supports optimism about oil demand. Chinese investment in manufacturing this year rose 9.6% even though China’s industrial output was still below expectations.
Reuters also reported Rystad Energy’s forecast projects global oil supply growth will slow in 2024 due to the extension of voluntary OPEC+ cuts.
Analysis of US Crude oil today

US crude oil prices rose on Monday and drew a new high after moving above the price level of 77 the previous week. Oil prices managed to rise to reach a new high of 79.91, successfully breaking the previous high of 78.76.
Oil prices also managed to cross the MA 50 line from the downside reflecting yesterday’s strong increase. The price is now moving between the upper and middle band lines.
Here the Bollinger bands indicator draws a flat channel with wide spaced bands reflecting a sideways market with high volatility. MA 50 is slightly below the price drawing a flat channel indicating a sideways market. Meanwhile, the RSI points to level 58, which means the price is above the uptrend level.
H1 timeframe

In this time frame the upward trend begins to fade, three candlesticks can be seen drawing a consolidation pattern in a narrow range of 79.66–79.91. Here the Bollinger band expands reflecting high volatility. MA 50 below the middle band line draws a slight upward channel indicating an uptrend signal with strong momentum. Meanwhile, the RSI indicator points to level 73, which means the price is in the overbought zone, giving an alert of a possible reversal.
Support and resistance
S3: 79.6 S2: 79.69 S1: 79.83 PP: 79.92 R1: 80.06 R2: 80.15 R3: 80.29
메타데이터
- post_id
- edb0c5559ea9
- slug
- investor-optimism-leads-to-wti-oil-rising-2-4-edb0c5559ea9
- url
- https://medium.com/@bagja7878/investor-optimism-leads-to-wti-oil-rising-2-4-edb0c5559ea9
- canonical_url
- https://medium.com/@bagja7878/investor-optimism-leads-to-wti-oil-rising-2-4-edb0c5559ea9
- author_url
- https://medium.com/@bagja7878
- status
- ok
- fetched_at
- 2026-07-23 14:50:44


