America Doesn’t Need Saving. It Needs a Funeral.
Nine structural datasets, one direction. The 80-year crisis cycle from the Revolution to Operation Epic Fury, and a data analyst who can’t…
Photo by Bernard Hermant on Unsplash
The structural autopsy
America Doesn’t Need Saving. It Needs a Funeral.
Nine structural datasets, one direction. The 80-year crisis cycle from the Revolution to Operation Epic Fury, and a data analyst who can’t find the indicator that breaks it.
Nearly five weeks ago the U.S. began Operation Epic Fury. In the first twelve hours, almost 900 airstrikes hit Iran, and Supreme Leader Khamenei was killed in that initial attack. A girls’ school was destroyed by one of the strikes — it was right beside a naval base in Minab — and by lunchtime, 170 people were confirmed dead.
Iran immediately closed the Strait of Hormuz, meaning a fifth of the world’s oil simply stopped being shipped, as if someone had flipped a switch.
The International Energy Agency said this was the biggest ever interruption to oil supplies worldwide. The price of Brent crude went over $100 a barrel, and at American gas stations, fuel hit four dollars a gallon in the first week, and it only climbed from there.
Pakistan moved to a four-day work week to save gas, and in two Australian states, all buses and trains became free to use. As for NATO allies, they wouldn’t get involved in the operation, each one refusing to sign up, until Trump bluntly told them to find their own oil.
I spent Friday night in Madison, on the floor and surrounded by three computer screens, looking at the International Energy Agency’s report. I put it next to everything I’d been pulling for months. Trust surveys. Life expectancy tables. Income distribution.
The war didn’t cause the problems. It just showed that the problems were already with us.
The Eighty-Year Clock
The United States, every eighty to one hundred years, falls apart and picks itself up from the ruins. And this isn’t a way of speaking. It’s a repeated pattern, with an actual name.
Historians William Strauss and Neil Howe outlined this in 1997, calling it a saeculum. It’s a progression of expansion, a shaking up of things, a falling apart, and then a time of intense trouble. The American Revolution, the Civil War, the Great Depression and WWII… each roughly eighty or ninety years after the one before. It’s almost as if the country has a rhythm, and can’t stop it.
Strauss and Howe predicted the next one would start around 2005. The financial crash of 2008 arrived three years later. Howe later said the hardest stretch could last until the late 2020s. We’re in the later stage of it now, and I can’t find anything that’s gotten better since it all began.
Critics of the model call it pattern-matching dressed as prediction, spotting patterns that aren’t really there without a solid reason for them to exist. That’s a reasonable point. But the timing is what gets them: three times in our history, a massive, life-or-death moment for the country, with eighty to ninety years in between, over a 250 year span.
That’s either an astonishingly precise coincidence, or a really obvious message that we’ve been intentionally ignoring. I spent a long time trying to convince myself it was coincidence. I looked at the numbers, compared them. The data just wouldn’t change.
And each of these crises has been worse than the last. The Revolution resulted in approximately 25,000 American deaths and the end of being a colony. The Civil War had 620,000 deaths, and the country almost didn’t make it.
World War II required something totally new: the entire world to turn its factories into war production. 405,000 Americans died. Every part of life, everywhere, was altered.
The number of people who die goes up, the damage to our systems goes deeper, it takes longer to get things going again. And each time, people in America insist something like that could never happen again.
So, what will the fourth one be like?
When I lived in Indonesia, Balinese religious traditions ran on the same logic.
Nyepi, the Day of Silence, is preceded by a night full of sounds and flames intended to scare away bad spirits.
But the belief behind it isn’t about good winning against evil. It’s about Shiva, who is both destroyer and creator — not two opposing forces, but a single unfolding movement.
The whole order of things can’t be renewed unless the current order falls apart. I didn’t understand this way of thinking at first, not when I was experiencing it amidst the sounds of gamelan orchestras and the incense at the temples.
It finally clicked, though, on a Friday evening in Wisconsin, as I looked at a graph of numbers that did nothing but fall and fall.
The Machines Are Measuring the Rot
Picture a number. Back in 1958, 73 percent of people in the United States had faith that the federal government would do what’s best.
The Pew Research Center has been tracking this for sixty-seven years.
And by September 2025, that number had fallen to 17 percent. Democrats, who aren’t in power right now, were at 9 percent, which is the lowest score any political group has ever gotten in the poll.
All five of Gallup’s measurements of how much faith people have in institutions are almost as low as they’ve been in fifty years.
And the trend is all in one direction.
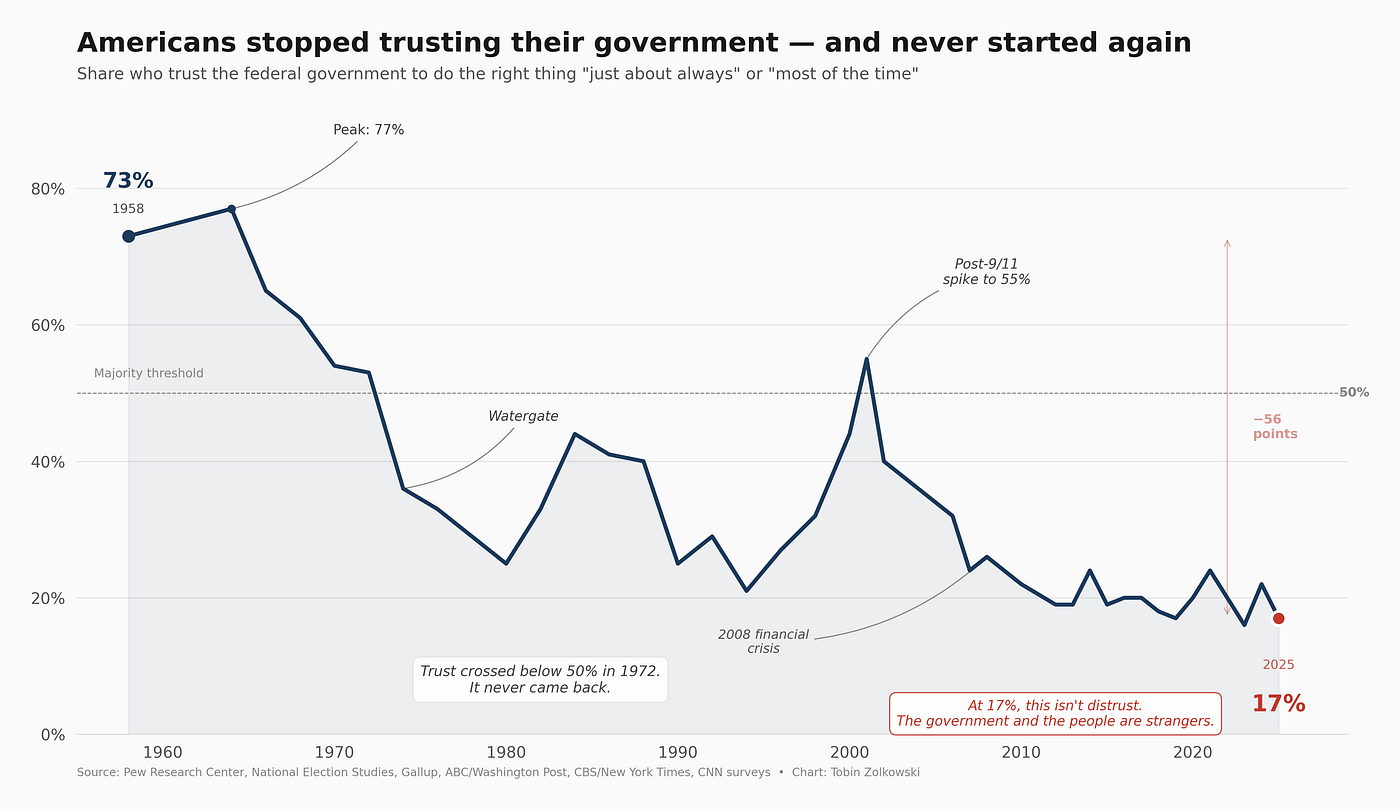
That seventeen percent…I really stared at it. It almost felt like looking at it would change it. My coffee went cold as I reloaded the Pew Research Center page three times. Three times, and it showed the exact same thing.
A nation needs people to trust in it to function. All of what I’m about to describe happens when that trust breaks down.
Before Covid, Americans had been living shorter lives for three years running. We hadn’t seen that happen since 1915 to 1918, during the Spanish Flu. And at the time, the flu was claiming lives more quickly than the war.
I had thought things would bounce back, that the figures would return to something more expected. But they didn’t.
And a study from March 2026, from the Proceedings of the National Academy of Sciences, got to the heart of the problem. It wasn’t what I would have guessed. The generation into which someone was born. Not government decisions, not how people chose to live, but something intrinsic, as if part of each group’s makeup.
People born after 1970 are increasingly dying from heart disease, cancer, and accidents, compared to all the generations before them. It isn’t leveling off. It’s becoming worse, worse, worse. Each generation is getting sicker than the last. If you’re from a birth year after 1970, your age group is dying from long-term illnesses at a quicker rate than your mom and dad’s did when they were the same age. Which shouldn’t happen in a country that throws around $4.5 trillion every year on medical care.
I read the first few lines of that study and couldn’t pull away. What got to me wasn’t the findings themselves — it was that almost nobody I’d talked to had even heard of it.
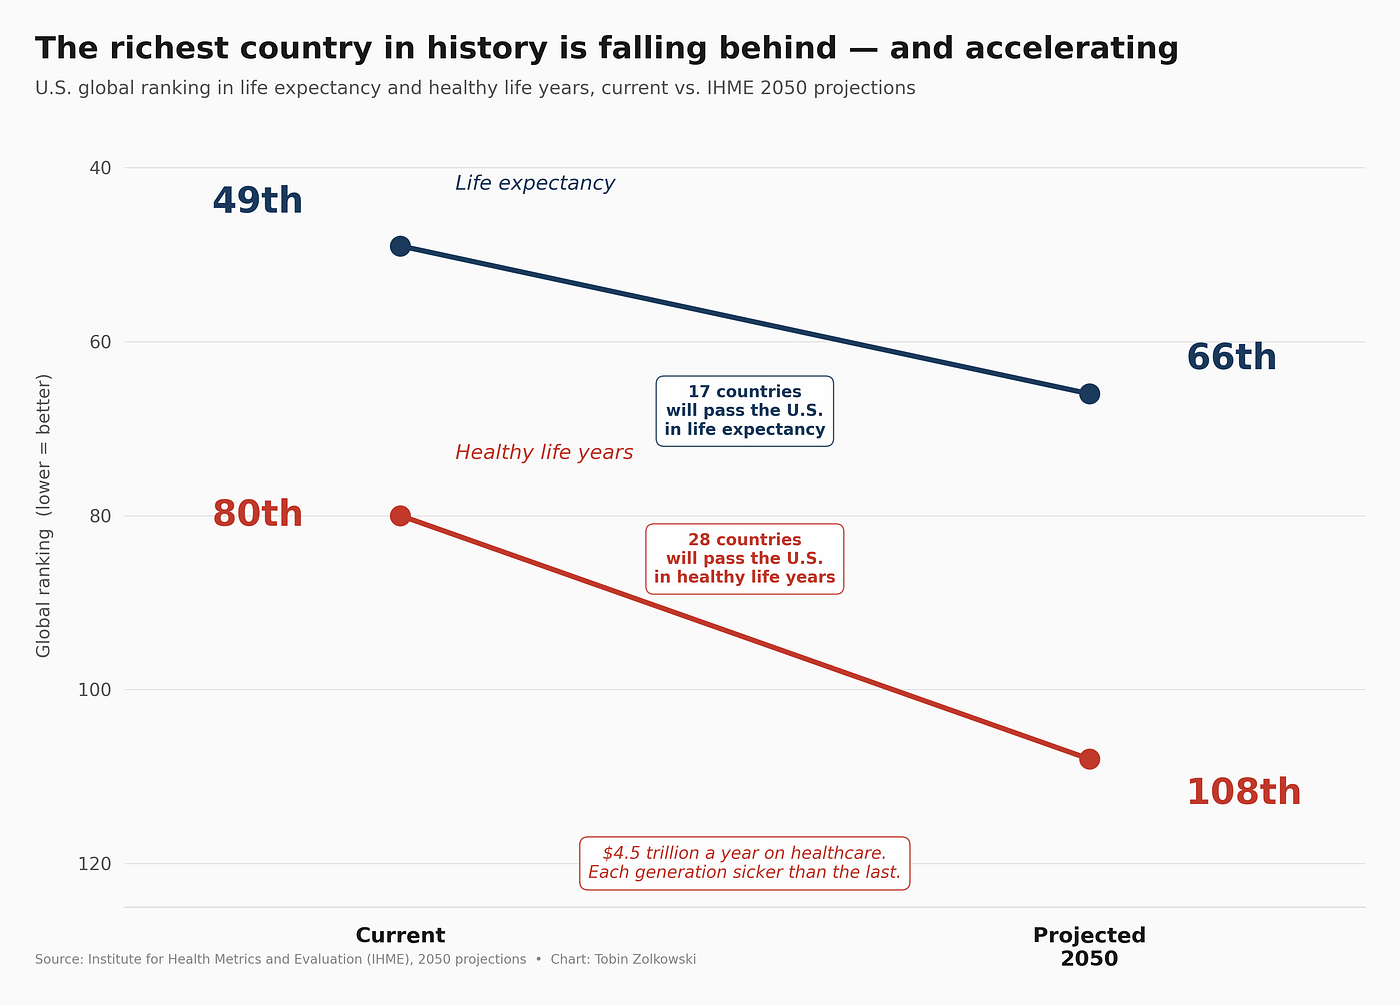
And each successive generation is less healthy than the one before. This isn’t a policy failure. It’s the system itself breaking down.
I looked at income figures after all that about life expectancy, almost expecting them to paint a different picture. They didn’t. Economists use something called the Gini coefficient to measure how much difference there is in earnings — a number from 0 to 1 where 0 means everyone earns the same and 1 means one person has everything.
In 1967 the US was at 0.397. By 2021? 0.494. The highest it’s ever been.
Let’s say that again: the country that created the middle class has been taking it apart for fifty-seven years. The top one percent averages forty times the income of the bottom ninety percent. Forty times. And as anyone who pays rent already knows, the Census Bureau confirmed in 2019 that income inequality is at a fifty-year high. Of the G-7 major economies, only the United States is near the levels of a developing nation.
And neither of the main political parties have stopped it, or even slowed it down.
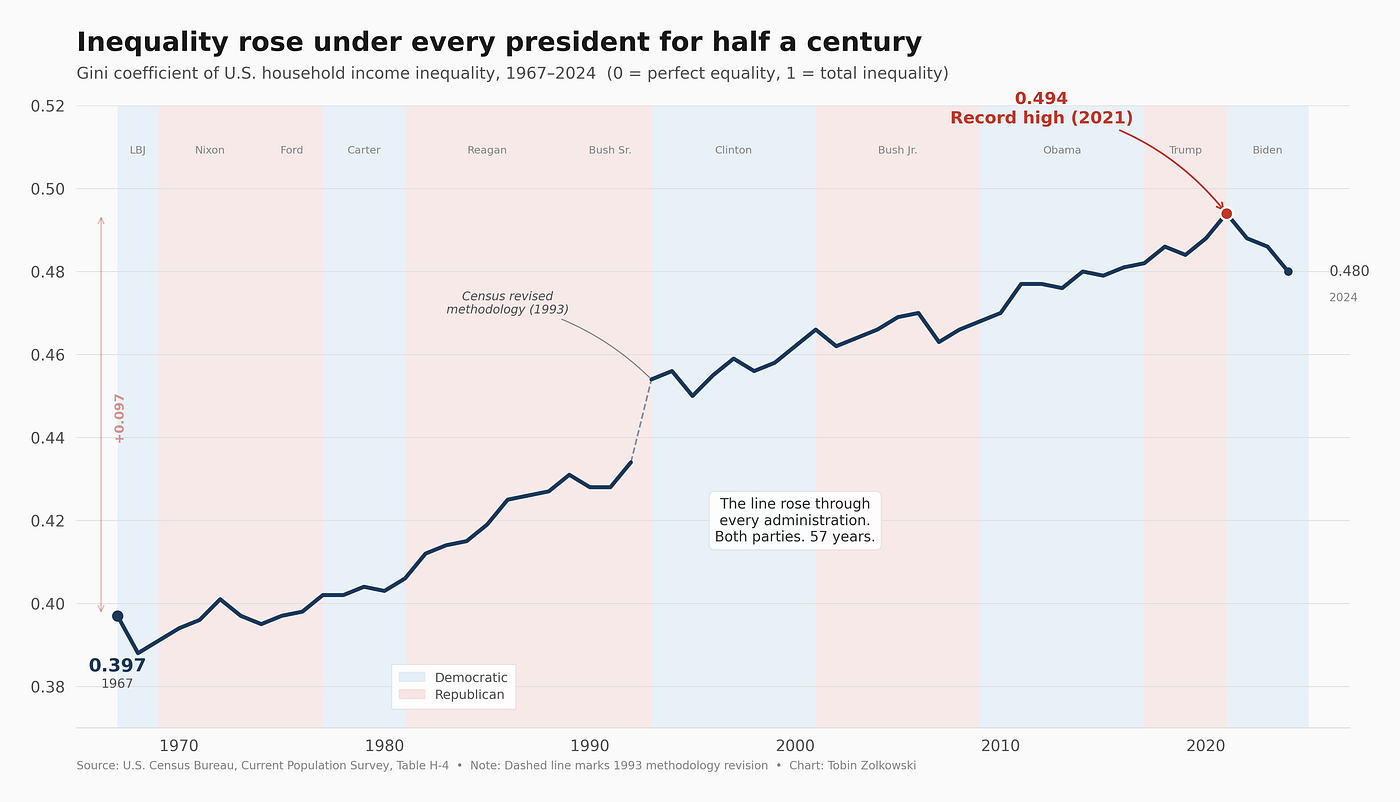
I wouldn’t lose sleep over inequality by itself. Countries can get by with a big gap between rich and poor as long as people at the lower end of the scale can manage to eat, get medical care, and generally live a complete life. What really shook my expectations was seeing both these things at once, displayed as lines on a graph: one heading upwards, and the other going down, within the very same nation and during the same time period.
The lowest level of support is collapsing. In West Virginia, people live to 72.2, whereas in Hawaii, they reach 80.0. Eight years of life, and all that divides them is a flight.
Looking ahead to 2050, twenty states (and I checked that number twice!) are likely to find that women’s expected years of healthy life are going down. And they’re in the places you’d predict: the South and the Midwest. Those are the same states struggling with high poverty, and the highest rates of diabetes and opioid addiction. Eventually, this disparity stops being about salaries and begins to be about survival itself.
This combination, of an increasing gap between rich and poor and worsening life-spans for those with the least, is a pattern that has repeated throughout American history. After a hundred years of Britain draining the colonies, the Revolution happened. The Civil War came after forty years of the plantation system gutting workers in the South.
Then came the Depression after the excessive wealth of the Gilded Age. The fundamental pattern is the same, the breaking point is the same…only the specifics causing it have changed.
The Rogue Superpower
I was braced for a bad three months when I looked at the economic figures for the conflict with Iran. But the results were far, far worse…reminiscent of 2008, only much uglier.
Oxford Economics’ calculations are stark. If the Strait of Hormuz stays closed, the world’s economic growth will slump to 1.4%, inflation will climb to 7.7%, and the United States will fall into a recession. I read that outlook three times; it wasn’t going to be a small downturn, but a catastrophic collapse.
Then the energy economists at MIT brought in the number I couldn’t shake. The destruction of refineries, pipelines, tanker terminals, all the oil infrastructure, means this isn’t going to be over when the fighting stops. The effects will go on for years. The World Economic Forum has termed it a fundamental shock to the global economy and I’ve written the bond yields on a Post-it on my screen: 4.46%. Mortgage rates are already above 6.38%.
And this is only after five weeks. This week President Trump told the country the operation is nearly finished, claiming Iran has “no anti-aircraft equipment” and “their radar is 100% annihilated.”
Two days later, Iran shot down an F-15E Strike Eagle. The pilot was rescued within hours, but the weapons systems officer spent two days hiding from Iranian forces in the Zagros Mountains before a 155-aircraft operation pulled him out over Easter weekend. During those rescues, Iran damaged an A-10 and two Black Hawk helicopters.
On the very day Trump gave that speech, the Wall Street Journal said he’d told his staff he’d be happy to finish the war even if the Strait of Hormuz didn’t reopen. Consider what that means. The US started a war which has halted about a fifth of the world’s oil shipments and the plan for ending it doesn’t involve getting that oil flowing again.
An analysis on Substack (my father’s friend emailed it to me at 11pm on a Tuesday — and that seems to be where a lot of us are getting our war information these days) had some cost calculations I hadn’t encountered anywhere else. The author thinks Iran’s whole offensive has cost around $200 million. I tried to check that with the Department of Defense or CSIS, but couldn’t. But this is confirmed: the Pentagon is asking for an extra $200 billion (according to the Washington Post, The Intercept, and pretty much everyone on Capitol Hill). Even if the Substack estimate for Iran is five times too high, the comparison is still ridiculously skewed.
[embed]So much winning Please make it stop, Mr. Presidentno01.substack.com
It’s not simply about the oil, the shutting of the Strait of Hormuz simultaneously disrupted seven key supply routes for things we need: oil, liquefied natural gas, phosphate, helium, ammonia, sulfur, urea. Seven of them all at once.
The harm to farming is already a done deal. The US Department of Agriculture is predicting the tiniest wheat harvest in the United States since 1919. Farmers have planted over three million fewer acres of corn. Zippy Duvall, head of the American Farm Bureau, says that if a farmer didn’t buy their fertilizer ahead of time, they might not be able to get any, regardless of how much they offer. And that same article on Substack pointed out that 318 million people were facing extremely serious food shortages even before the fighting started. The best time to get crops in the ground is quickly ending.
Prices are changing far too quickly for any official report to properly describe.
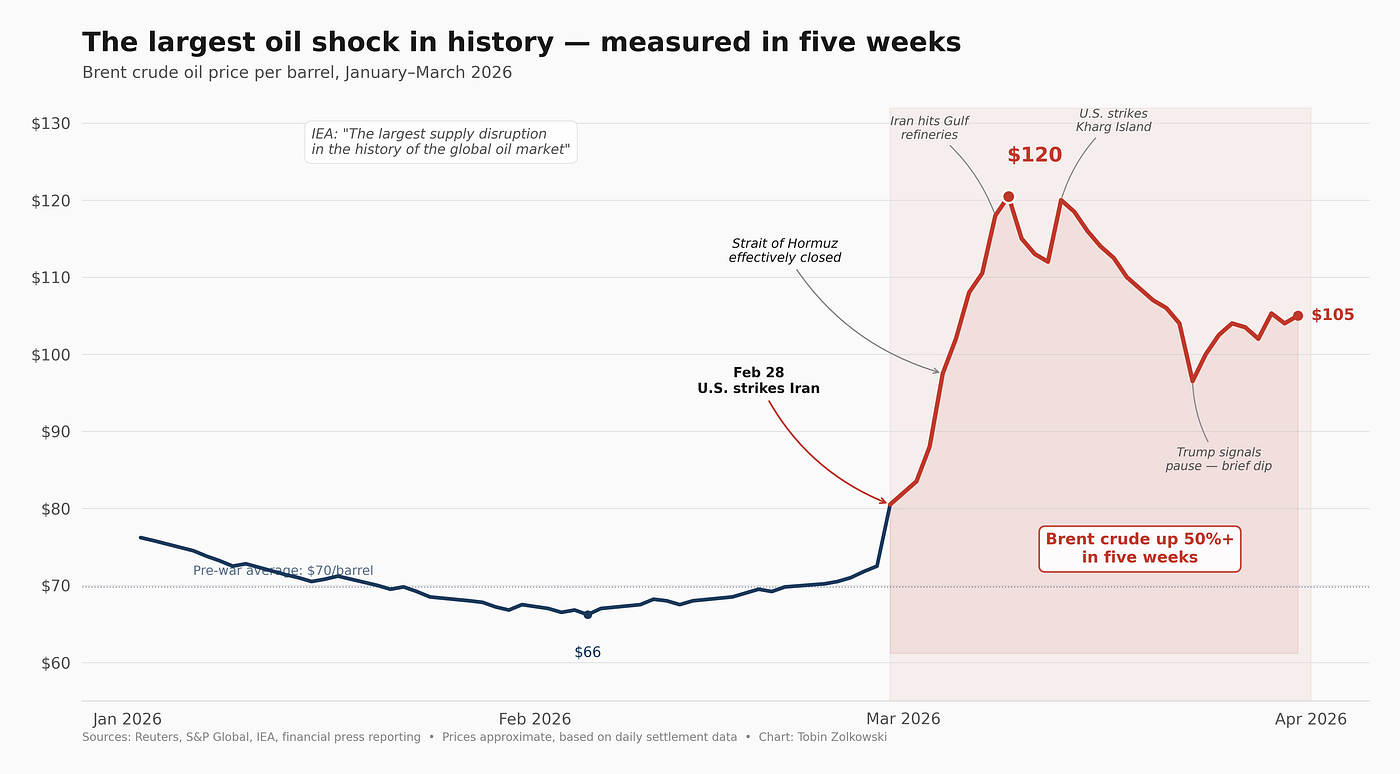
I had to close my laptop when I saw this figure: Iran is now pumping out 1.5 million barrels of oil a day. That’s up from 1.1 million before the war began, and that’s according to Tasnim, with CNN backing it up. Oil was $47 a barrel before the war, and now it’s $110. So, we went to war to hurt Iran financially, and they are making more money each day than before the first bomb fell.
The problems with other countries are even past them just saying they won’t get involved. France refused to support Trump’s military group, then wouldn’t let American military planes use their airspace. Spain did the same thing. Italy wouldn’t let the US use its Sigonella base, and Germany is actually thinking of getting rid of US bases in their country altogether.
Four of our NATO allies haven’t just said no to helping out, they have closed the door.
An analysis in Georgetown University’s Journal of International Affairs (and this isn’t a political protest, it’s a serious journal on international policy) warns that the war is in danger of becoming a case of biting off more than you can chew, of an empire expanding too far. This is the sort of thing historians say about empires when they’re beginning to fall apart.
Sit with that for a second. Georgetown, a foreign policy publication, is drawing a comparison between this President’s war and the patterns that show when major powers are in decline. It’s not a slogan on a protest poster; it’s the opinion of an institution.
The US isn’t just in a war, it’s in one with allies who won’t participate, and is paying for it by borrowing money, all while the economic effects are most damaging to those Americans who can least afford it. Four dollar a gallon gasoline doesn’t hit everyone equally and the statistics on wealth disparity have already shown who will be most deeply impacted.
China is watching. A country that thinks in centuries, not election cycles, can afford patience. I’ve spent a week going over reports from the Atlantic Council about what China is doing in the Middle East, and Beijing is deliberately positioning itself in the area.
They’re the biggest trading partner for most of the countries in the region, and one of the largest investors in them (says the Atlantic Council), and they’ve covered all of this with something called the Global Security Initiative, which is deliberately presented as a different way of doing things to the system led by America.
These moves aren’t just about protecting themselves if America falls, they are investments in that fall. The question isn’t if Beijing will benefit from the US overstretching itself, it’s how much they will benefit.
The Neighbors Feel It First
China can observe from far away across the Pacific Ocean, but the countries right next to America don’t have that option. They get the aftereffects, the fallout.
Canada’s economy only inched forward in January, a 0.1% increase. Bloomberg described this as a fairly small growth before the issues with energy prices really hit. I almost had to laugh at that. Oil and gas are about 7% of Canada’s total economic output — seven times the proportion for the US. You’d think a big jump in crude oil prices would be a good thing for Canada?
It isn’t. The Globe and Mail did the calculations and the result wasn’t good. Any extra money Canada gets from higher prices, inflation eats in other sectors. Gas in Vancouver is now a staggering C$2.14 per litre. The Bank of Canada didn’t change interest rates, stuck between inflation that refuses to calm down and a weakening job market.
Canada added its voice to the international disapproval of Iran’s attacks on ships. But saying something is different than joining a war effort. Ottawa understands that perfectly well.
Canada finds the oil, then sells the oil, and yet it can’t sidestep the price problems created by its biggest trading partner. This is what happens when countries’ economies are closely linked but they don’t have the same political goals.
Mexico’s situation is different in its specifics. Eighty percent of what Mexico sells to other countries goes to the United States. This reliance was intended to be a positive aspect of the USMCA deal, not a weakness.
It quickly became a weakness. The Baker Institute has shown how the damage is happening: US tariffs are causing economic hardship, less money coming in from overseas, and job losses in all three countries involved in USMCA. Both BYD and Tesla scrapped their plans for factories in Mexico. Uncertainty over trade ended those projects before construction even started.
I kept reading, looking for a plan. There isn’t one yet.
Mexico’s economy actually shrunk in the third quarter of 2025. And the reworking of the USMCA agreement, the one that’s meant to solve all the issues? It won’t even begin until the very end of 2026 at the earliest. Mexico’s economic future rests on a negotiation that hasn’t begun, with a trading partner who is currently engaged in a global conflict that hasn’t ended.
With the current tariffs in place, Yale’s Budget Lab believes Mexico’s economy will get smaller. FocusEconomics predicts average growth of only 1.6% through 2029, and that’s less than the average for Latin America as a whole. The country that was expected to be the biggest beneficiary of companies moving production ‘near’ to the US is actually paying the price for the troubles in America.
Both of America’s neighbors are learning the same thing: being close to a problem this serious doesn’t protect you from it. It makes you more at risk.
The Nuclear Gap
Something a reader pointed out on a previous article has really stuck with me. He looked at figures from the World Nuclear Association and put it very simply: China is currently building over 28 nuclear reactors. The United States isn’t building a single one.
I got the World Nuclear Status Report to double check, and the situation is starker than he said. In the last five years, forty reactors have begun construction around the world, twenty-six of those in China. Russia, Egypt, India and Turkey are responsible for the other thirteen, and the only nations actually starting to build are China and Russia.
I searched for the United States on that list…and it’s not there.
The US did get Units 3 and 4 of the Vogtle plant in Georgia running in 2023 and 2024. They took eleven years, and $35 billion, which is two and a half times more than originally expected. The Energy Information Administration put it in a single sentence after Vogtle 4 was connected: “No nuclear reactors are under construction now in the United States.”
China gets a reactor up and running in six years. Their goal is 200 gigawatts of nuclear power by 2035, and to get there they’ll need 150 more reactors at a cost of $440 billion. That’s not just a nice idea, they’re one-third of the way to achieving it already.
We have 96 older reactors in the US, and on average they’ve been operating for over thirty years. Donald Trump issued executive orders in 2025 with the ambition of 400 gigawatts by 2050. Westinghouse said they’d have ten new AP1000 reactors going by 2030. But today, the number of reactors under construction in the US remains exactly as that first commenter said. Zero.
And China isn’t only building at home. They’re sharing the know-how. The Hualong One is China’s standard reactor for export, and it’s already been deployed or is contracted for use in Pakistan, Argentina, and is being discussed as part of the Belt and Road Initiative across many countries. America once exported nuclear technology, now we export only statements about it.
Three Systems, One Decade
He came back at me with an even more pointed response, noting that both China and Russia are run by authoritarian regimes, but have completely different ideas about what to spend their money on. And the US? Well, our system is a frustrating tangle of conflicting interests, where getting anything actually constructed is the rare thing.
I thought he might have something to that and here’s what I’ve found.
In 2025, China’s Belt and Road Initiative has been more active than ever. The Griffith Asia Institute found $213.5 billion in new agreements, a 75% increase from 2024. That’s $1.4 trillion invested in total since 2013 in 150 different nations. Ports in Pakistan, railways in Kenya, power stations in Indonesia, data centers in Kazakhstan.
In fact, energy projects alone brought in $93.9 billion in 2025 — more than twice what they had the year before. China isn’t looking to the next century, they are paying for the infrastructure that will define it.
Russia should have been a similar case — a comparable authoritarian government, and you’d anticipate a huge building program. But the money flowed into the military. More than 40% of the Russian government’s spending is now on defense and keeping control within the country, the biggest proportion since the Cold War with the Soviet Union. Infrastructure investment was reduced by 7% in 2025, and even the Baikal-Amur Mainline and Trans-Siberian Railway extensions, Russia’s big, important construction projects, had their budgets cut by as much as 28%.
Economic growth has plummeted from 4.1% in 2023 to around 1% in 2025. Factories are producing less and the Carnegie Endowment thinks this is a permanent slide into economic standstill. Analysts are comparing Russia to the Soviet Union of the 1980s, where all the funds went to the military and the public buildings and services fell apart.
And the United States? When I had all three countries’ information laid out on my computer screen, it was the US column that remained almost bare. Our most recent big nuclear reactor took eleven years and $35 billion. We haven’t even started to renegotiate USMCA. And the infrastructure bill from 2021 is still going through the process of getting permission to begin. China constructed twenty-six reactors in the same time it took the US to complete two.
Three governments. Ten years. China is constructing, Russia is falling apart, and America is debating whether to begin.
What History Says, and What It Doesn’t
No one saw the Soviet Union’s fall coming. In 1988, the CIA’s experts were busily outlining when the Soviets would reform, and the economy, though ill, did not seem on the verge of falling apart. And yet, by 1991, the Soviet Union was gone. Similarly, in the 1980s, Japan was widely predicted to utterly surpass the United States, to take over as the most powerful nation. But that didn’t happen.
One of those two superpowers disappeared much sooner than anticipated, and the other, where everyone thought dominance was guaranteed, instead got stuck. A country’s fundamental weakening doesn’t send a warning, it doesn’t formally announce its arrival. Instead, it’s seen in a build-up of things that don’t seem too terrible on their own, but when taken all together, reveal they were a disaster.
I’m not saying the United States will just fall apart. That’s not what the modelling suggests. What’s more probable is something harder to say: a crisis will break down the way we are organized and we’ll have to build a new system.
This has occurred every time, and after each time, the new version of things was better than the old. The Constitution superseded how things were under the colonies and lasted for ages. After the Civil War, Reconstruction, though flawed and enforced with a great deal of violence, fundamentally changed the social agreement. And the New Deal and Bretton Woods created a new international framework from the devastation of the Depression, and that lasted for seventy years.
But every one of those rebuilds required something I didn’t think about until I looked at the trust numbers: enough Americans willing to believe in each other long enough to build something.
And this is the statistic that bothers me: 17%.
The level of trust that allowed for all those previous rebuilds is not present. In 1958, seventy-five percent of Americans were comfortable with the government changing the way things worked. And in 1946, soldiers returning from the war had enough faith in the common structures of society to construct the post-war agreement, from the ground up.
Who has faith in those common structures now? Nine percent of Democrats, twenty-six percent of Republicans.
These figures aren’t going to lead to agreement. They are going to create completely separate worlds for different groups of people.
Where I Might Be Wrong
I’m worrying I’m looking at the figures in a way that simply proves what I already believe. I’ve been guilty of this with smaller projects, and the Strauss-Howe model is so neat and tidy that it’s tempting for someone analyzing data to stop hunting for evidence that suggests it isn’t right.
And the model isn’t based on any actual process; it’s just noticing similarities in three different areas. Three! That’s far too small a number to publish as a proper study. The US has survived every “Fourth Turning” of this cycle in the past, and perhaps it will this time too.
This whole thing could unfold over many decades, or even centuries.
The Roman Empire fell over 300 years, though even comparing it to that isn’t perfect. America is a democratic republic with elections in 2026 and 2028 which could be crucial turning points. America isn’t Rome, the ways things work are different, and our influence in the world might lessen without the country itself collapsing.
The dollar throws a really weird curveball into the mix. S&P Global said the dollar actually strengthened after the attacks in Iran. The world’s main currency went up in value because when people are frightened, they still run to the US to keep their money safe.
That’s a stark fact that goes against the idea of a country in decline. No declining power in history has ever had that advantage. It’s something we’ve never seen before and I’m not quite sure how to deal with it.
But every time I try to convince myself the pattern is wrong, the data draws me back in. Faith in institutions is at its lowest in 67 years, Americans aren’t living as long as people in countries that spend a quarter as much on healthcare, and income inequality is at a 50-year high and continuing to climb.
The conflict in Iran resulted in the biggest ever disruption to oil supplies, according to the International Energy Agency. That’s all there is to it.
I’ve been adding more and more data sets hoping to find something to suggest the opposite, but nothing does.
Our allies have left the coalition, Canada and Mexico are both suffering financially from problems they didn’t cause, and China is in the position the US used to be in: the calm one, observing the overstretched power as it makes errors.
I’ve been looking at nine different indicators, and searching for one that doesn’t fit the pattern. I haven’t found it.
The cycle tells us that destruction happens before something new is built. The data says the destruction is happening now. And neither suggests that the rebuilding will happen by itself.
Shiva the Hindu god destroys in order to create. But Shiva doesn’t do the creating all by himself — everyone else has to participate.
And right now, 83% of the population doesn’t have faith in the institutions they’d need to be involved in that rebuilding.
메타데이터
- post_id
- edcc202c1ca6
- slug
- america-doesnt-need-saving-it-needs-a-funeral-edcc202c1ca6
- url
- https://medium.com/@grateful_aqua_goat_147/america-doesnt-need-saving-it-needs-a-funeral-edcc202c1ca6
- canonical_url
- https://medium.com/@grateful_aqua_goat_147/america-doesnt-need-saving-it-needs-a-funeral-edcc202c1ca6
- author_url
- https://medium.com/@grateful_aqua_goat_147
- status
- ok
- fetched_at
- 2026-06-09 15:37:30