From git push to Live HTTPS App: A Complete DevOps Pipeline on AWS EKS
From a git push to a live HTTPS banking app with CI/CD, GitOps, Kubernetes, and real-time monitoring — a complete walkthrough of VaultX
From git push to Live HTTPS App: A Complete DevOps Pipeline on AWS EKS
From a git push to a live HTTPS banking app with CI/CD, GitOps, Kubernetes, and real-time monitoring — a complete walkthrough of VaultX
Most portfolio projects stop after getting an application running. I wanted to build something closer to how modern engineering teams deploy software, where the infrastructure, deployment pipeline, security, and observability are just as important as the application itself.
The result is VaultX, a microservices banking platform built with FastAPI, React, and PostgreSQL, deployed on AWS EKS using Terraform, automated CI/CD with Jenkins, GitOps through ArgoCD, and monitored with Prometheus and Grafana.
In this article, I’ll walk through the architecture, explain the design decisions behind each component, share the challenges I encountered, and show how everything fits together — from a Git push to a production-style deployment.
What is VaultX?
VaultX is a banking application that lets users register, open accounts, deposit and withdraw funds, and view transaction history. The application itself is straightforward — the interesting part is everything underneath it.
The platform is split into five independently deployable services:
- auth-service — registration, login, JWT issuance and verification
- account-service — account creation and management
- balance-service — balance queries
- transaction-service — deposits, withdrawals, transaction history
- frontend — React 18 + Vite, served by Nginx
Each service has its own Dockerfile, its own Jenkins pipeline, its own Kubernetes manifests, and its own Grafana metrics. They are decoupled in every meaningful sense.
The Architecture
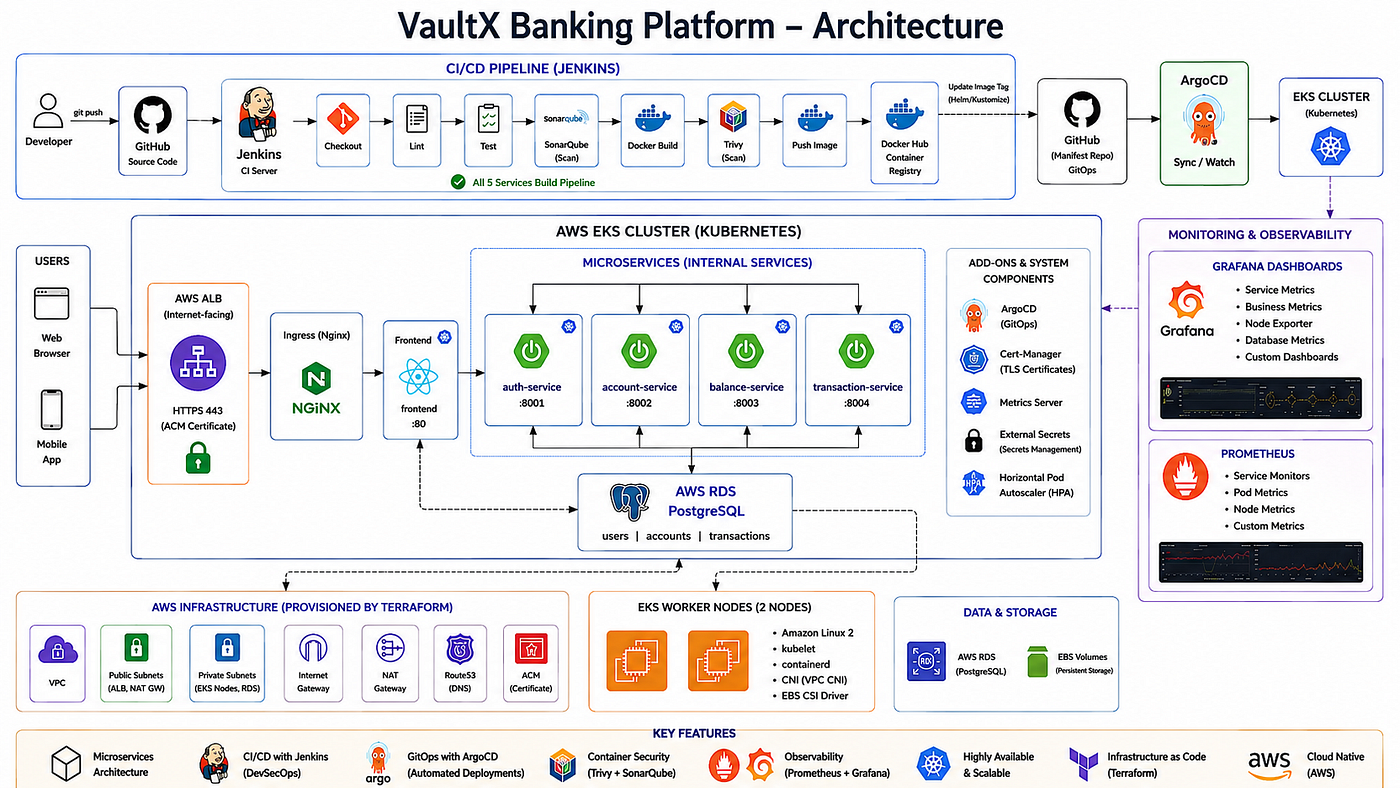
At a high level:
- A developer pushes code → Jenkins runs the full CI pipeline → Docker image is pushed to Docker Hub → image tag is committed back to the GitOps repo → ArgoCD detects the change → rolling update on EKS
- Users hit HTTPS on a custom domain → AWS ALB → Nginx Ingress → frontend → backend services → AWS RDS PostgreSQL
- Prometheus scrapes all four backend services via ServiceMonitors → Grafana displays business metrics in real time
Infrastructure — Terraform on AWS
Everything is provisioned with Terraform. Nothing was clicked into existence in the AWS console.
The infrastructure module creates:
- VPC with public subnets (ALB, NAT Gateway) and private subnets (EKS nodes, RDS)
- EKS Cluster — 2 managed worker nodes running Amazon Linux 2
- RDS PostgreSQL 16 — in a private subnet, encrypted at rest, not publicly accessible
- AWS Load Balancer Controller — installed via Helm with IRSA (IAM Roles for Service Accounts) so it can provision ALBs on behalf of Kubernetes Ingress objects
- Security Groups — least-privilege rules allowing only EKS nodes to reach RDS on port 5432
- before applying the changes we need to steup our backend for statefile instead of local i used Amazon S3 for the, just edit backend.tf is with your bucket name, Region then follow the following steps:
cd Terraform/environments/dev
terraform init && terraform apply
aws eks update-kubeconfig --region ap-south-1 --name $(terraform output -raw eks_cluster_name)
After terraform apply, the only manual step is copying the RDS endpoint into kubernetes/configmaps/configmaps.yaml and pushing that change to Git. ArgoCD picks it up from there.
CI/CD — Jenkins with a Shared Library
Every service has an 8-line Jenkinsfile:
@Library('vaultx-shared-lib@main') _pythonMicroservicePipeline(
serviceName : 'auth-service',
serviceDir : 'auth-service',
containerName : 'auth-service',
deploymentFile : 'kubernetes/auth-service/auth-service-deployment.yaml',
coverageThreshold : 85,
gitCredentialsId : 'github-token',
dockerCredentialsId : 'docker'
)All the actual pipeline logic lives in a Jenkins Shared Library — a separate repo that all five services reference. The pipeline runs these stages in order:
Stage What it does Checkout Clones the repo, sets IMAGE_TAG = <git-sha>-<build-number> Lint Runs flake8 — fails on any Python style issue Test Runs pytest with coverage enforcement (85% threshold) SonarQube Runs quality gate — fails if conditions not met Docker Build Builds the image with BuildKit layer caching Trivy Scan Scans image for CVEs — fails on CRITICAL or HIGH Docker Push Pushes image to Docker Hub with the git-sha tag GitOps Update Uses yq to patch the image tag in the deployment YAML and pushes to Git
The GitOps Update step is the bridge between CI and CD. After a successful build, the pipeline commits the new image tag directly into the Kubernetes manifests repo. ArgoCD polls Git every 3 minutes and detects the change, triggering a rolling update.
What I like about this setup: if the build fails at Trivy, the image never reaches the registry and ArgoCD never gets a new tag to deploy. The cluster is protected at multiple layers.
SonarQube — Quality Gate in the Pipeline
All five services pass SonarQube’s quality gate with 87–96% test coverage and zero security hotspots. Tests are written with unittest.mock — no database or external services required to run them, which makes the CI loop fast.
The coverage threshold is enforced in the Jenkinsfile parameter (coverageThreshold: 85) — if coverage drops below that, the build fails before even reaching SonarQube.
GitOps — ArgoCD App of Apps
This is the part I’m most proud of in the infrastructure layer.
Instead of one ArgoCD Application syncing the entire kubernetes/ directory (which would create a single point of failure and make it hard to know which service had a problem), I implemented the App of Apps pattern.
There is one root Application (app-of-apps) that watches kubernetes/argocd/apps/. Inside that folder are 11 child Application manifests — one per Kubernetes folder:
bankapp-namespace          (wave -1)
bankapp-configmaps         (wave 0)
bankapp-db-init            (wave 1)
bankapp-account-service    (wave 2)
bankapp-auth-service       (wave 2)
bankapp-balance-service    (wave 2)
bankapp-transaction-service (wave 2)
bankapp-frontend           (wave 3)
bankapp-hpa                (wave 4)
bankapp-ingress            (wave 4)
bankapp-monitoring         (wave 5)
The sync waves guarantee deploy order — namespace before pods, configmaps before services, database schema before backends, backends before frontend, HPA after deployments exist to scale.
The secret problem: ArgoCD pulling secrets from Git was a concern from day one. The solution is three layers of protection:
.argocdignore— ArgoCD never reads thesecrets/folderdirectory.excludein the Application manifest — source-level exclusionnamespaceResourceBlacklist: Secretin the ArgoCD Project — even if a secret file is accidentally committed, ArgoCD refuses to sync it
Real secrets are applied once via a bootstrap script before ArgoCD is set up, and never touched again.
Domain, DNS and HTTPS
The app runs on a custom domain (techpluse.online) purchased from GoDaddy, with DNS managed in AWS Route53.
The setup:
- Create a Route53 Hosted Zone → get 4 AWS nameservers
- Update GoDaddy to use those nameservers (important: no trailing dot)
- Create Route53 A records aliasing to the ALB DNS name
- Request an ACM certificate for
techpluse.onlineand*.techpluse.onlinewith DNS validation — Route53 auto-creates the CNAME validation record - Update the Ingress annotations with the cert ARN and
ssl-redirect: "443"
One thing that caught me: GoDaddy rejects nameservers with a trailing dot — AWS includes the dot in its output but GoDaddy’s form doesn’t accept it. Strip the trailing dot before pasting.
Monitoring — Prometheus, Grafana, and Custom Metrics
Each backend service exports custom Prometheus metrics via prometheus_client in a dedicated metrics.py file:
- auth-service — login attempts by status, registration rate
- account-service — accounts created by type, operations by outcome
- balance-service — balance queries by outcome
- transaction-service — transaction volume in USD, errors by type, processed by type/status
These are scraped by Prometheus via ServiceMonitors deployed to the monitoring namespace. The key configuration that makes this work is:
helm install kube-prometheus-stack prometheus-community/kube-prometheus-stack \
  --set prometheus.prometheusSpec.serviceMonitorSelectorNilUsesHelmValues=false
Without that flag, Prometheus only picks up ServiceMonitors that match its own Helm release labels — and misses everything in the bankapp namespace.
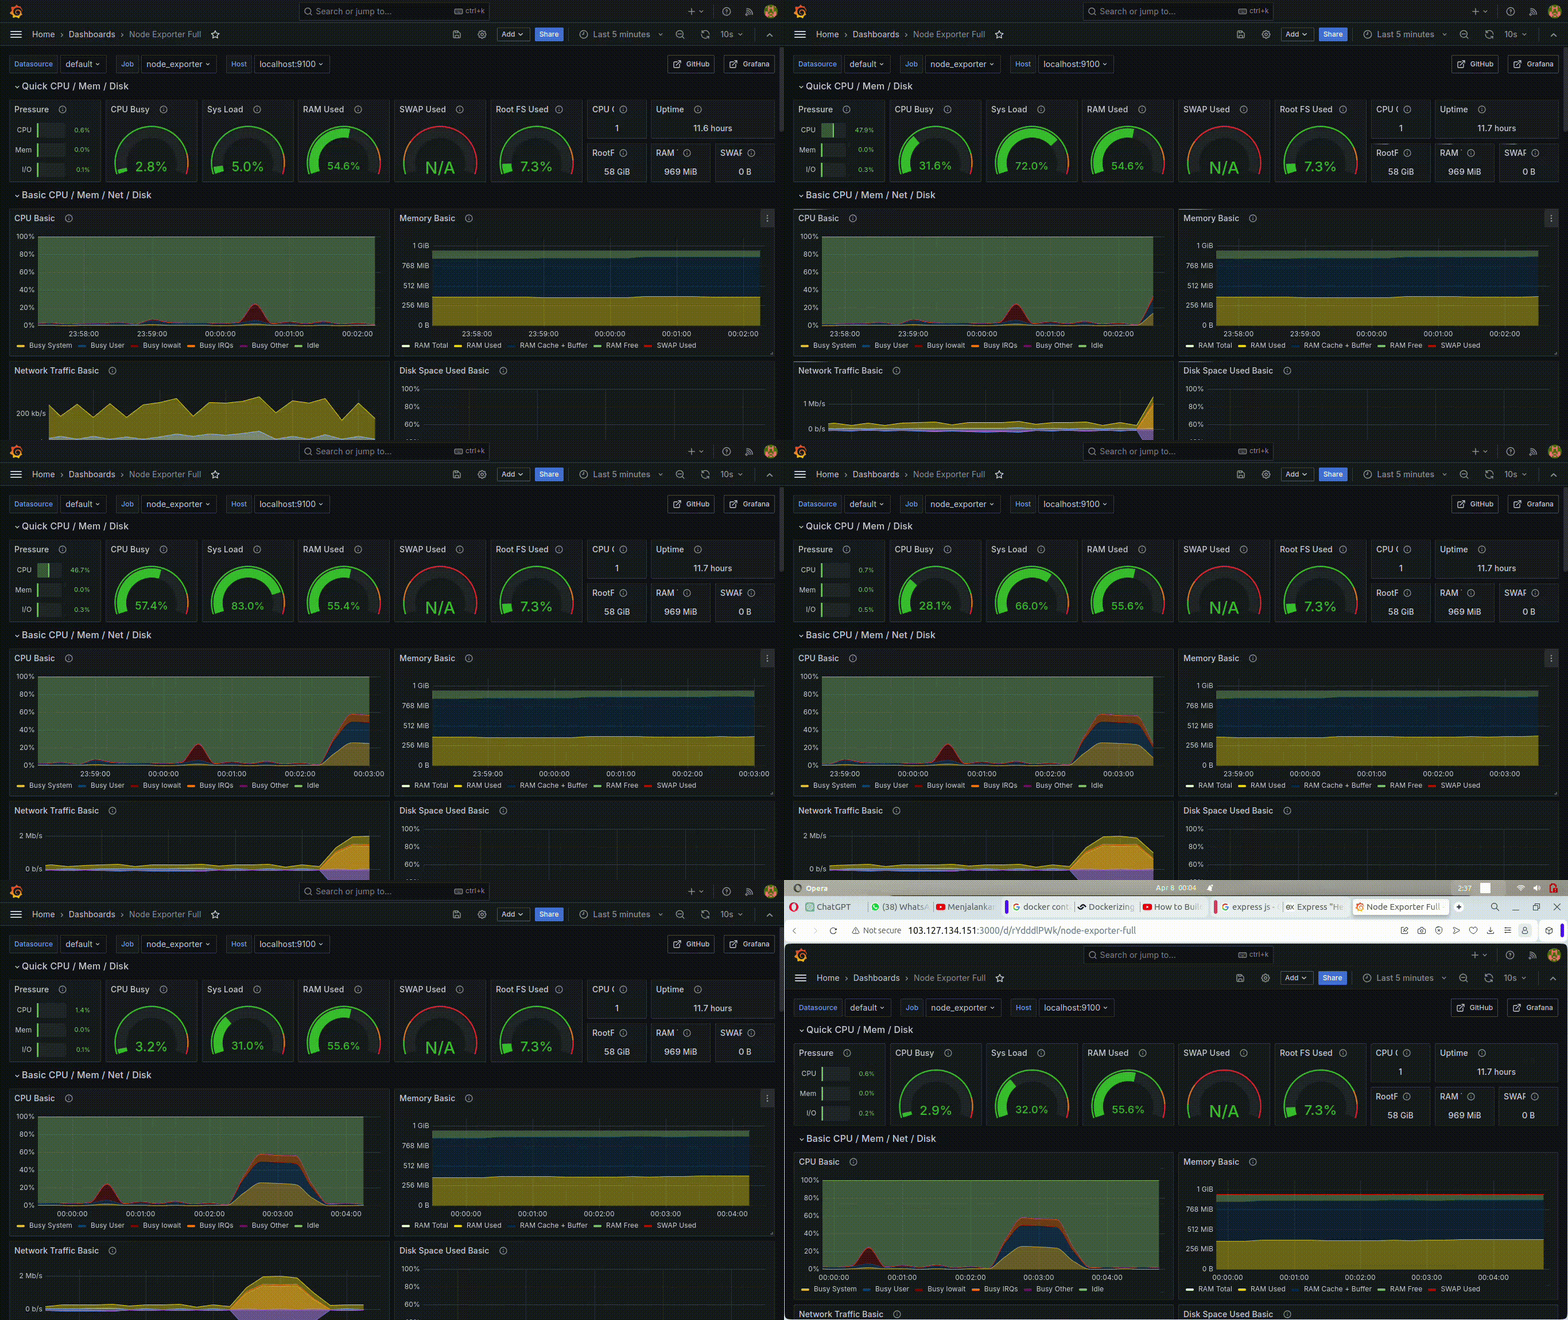
The Grafana dashboard JSON is committed to kubernetes/monitoring/bank_dashboard.json and can be imported in one step. During load testing with k6 (ramping to 800 virtual users), you can watch the dashboard live — request rates climbing, HPA scaling up replicas, transaction volume hitting $600K/sec, auth service CPU at 237% of its request triggering scale-out.
Autoscaling — HPA Under Load
HPA is configured for all four backend services. The thresholds came from actual load testing, not guesswork:
Service CPU Target Min Max Why auth-service 60% 2 8 bcrypt is CPU-bound by design — scaled out to 6 under load test account-service 70% 2 6 Near-idle during load — conservative defaults balance-service 70% 2 6 Near-idle during load transaction-service 70% 2 6 CPU low, but SELECT ... FOR UPDATE lock contention is invisible to HPA
One detail that matters: HPA requires the Metrics Server to be installed separately. It’s not bundled with kube-prometheus-stack. Without it, kubectl get hpa shows <unknown> for TARGETS and autoscaling never kicks in.
Key Design Decisions
Stateless services — JWT is validated locally in each service using a shared JWT_SECRET. This means any replica can handle any request — no sticky sessions, no shared session store, clean horizontal scaling.
Row-level locking in transactions — transaction-service uses SELECT ... FOR UPDATE on account rows. This prevents double-spend race conditions when multiple replicas process concurrent withdrawals against the same account.
Append-only ledger — the transactions table is never updated or deleted. Balance lives in accounts.balance and is updated atomically in the same database transaction as the ledger insert. This gives you a complete audit trail by default.
Non-root containers — all Dockerfiles drop to a non-root user before the CMD. This is required by most production Kubernetes security policies and is a good habit regardless.
What I Would Do Differently
External Secrets Operator instead of bootstrap script — the current approach of manually applying secrets works, but in a real team environment you’d want secrets pulled from AWS Secrets Manager or HashiCorp Vault automatically. The bootstrap script is a reasonable stopgap for a solo project.
Separate config repo from app repo — the Kubernetes manifests live in the same repo as the application code. In a multi-team environment, these should be separate repos — one team owns the app, another owns the deployment config.
Cluster Autoscaler — HPA scales pods, but if the nodes are full, new pods sit in Pending. Adding Cluster Autoscaler would let EKS automatically add nodes when HPA tries to schedule more pods than the cluster can fit.
Teardown — The Thing Nobody Talks About
Tearing down an EKS cluster with an Ingress requires a specific order that isn’t obvious:
# 1. Delete Ingress first — ALB Controller removes the ALB from AWS
kubectl delete ingress bankapp-frontend-ingress -n bankapp
# 2. Wait for ALB to be gone (~60 seconds)

# 3. Delete ArgoCD root app — prevents it recreating the Ingress
kubectl delete application bankapp-root -n argocd

# 4. Now terraform destroy works cleanly
cd Terraform/environments/dev && terraform destroy
If you run terraform destroy before deleting the Ingress, Terraform fails trying to delete the VPC because the ALB (created by the ALB Controller, not Terraform) still exists inside it. The VPC can't be deleted while resources exist in it. This leaves you with a partially destroyed stack and orphaned AWS resources that you have to clean up manually.
The Numbers
- 5 microservices — 4 FastAPI backends + React frontend
- 12 ArgoCD applications — App of Apps pattern
- 87–96% test coverage — enforced in CI
- ~1 min 20s average pipeline run per service
- 0 CRIT/HIGH CVEs — Trivy gate
- 800 VUs peak load test — k6 breakpoint test
- $0 infra cost during writing — destroyed after demo ✅
Links
- Live Demo: techpluse.online
- GitHub: banking-microservices-devops
- Shared Library: bankapp-shared
If you’re building a DevOps portfolio project, the advice I’d give is: don’t stop at getting the app to run. The CI/CD pipeline, the GitOps setup, the monitoring, the teardown order — that’s where the real learning is, and that’s what separates a portfolio project from a demo.
Thanks for reading. If you have questions about any specific part of the setup, drop them in the comments.
메타데이터
- post_id
- edf3e7a715bf
- slug
- from-git-push-to-live-https-app-a-complete-devops-pipeline-on-aws-eks-edf3e7a715bf
- url
- https://blog.devops.dev/from-git-push-to-live-https-app-a-complete-devops-pipeline-on-aws-eks-edf3e7a715bf
- canonical_url
- https://blog.devops.dev/from-git-push-to-live-https-app-a-complete-devops-pipeline-on-aws-eks-edf3e7a715bf
- author_url
- https://medium.com/@kishorbhairat
- status
- ok
- fetched_at
- 2026-07-08 17:17:42