Our API Had a 6-Second P99 for 8 Months. Nobody Noticed Until a Customer Tweeted.
The metric that wasn’t being measured. The alert that was never set up.
Our API Had a 6-Second P99 for 8 Months. Nobody Noticed Until a Customer Tweeted.
The metric that wasn’t being measured. The alert that was never set up.
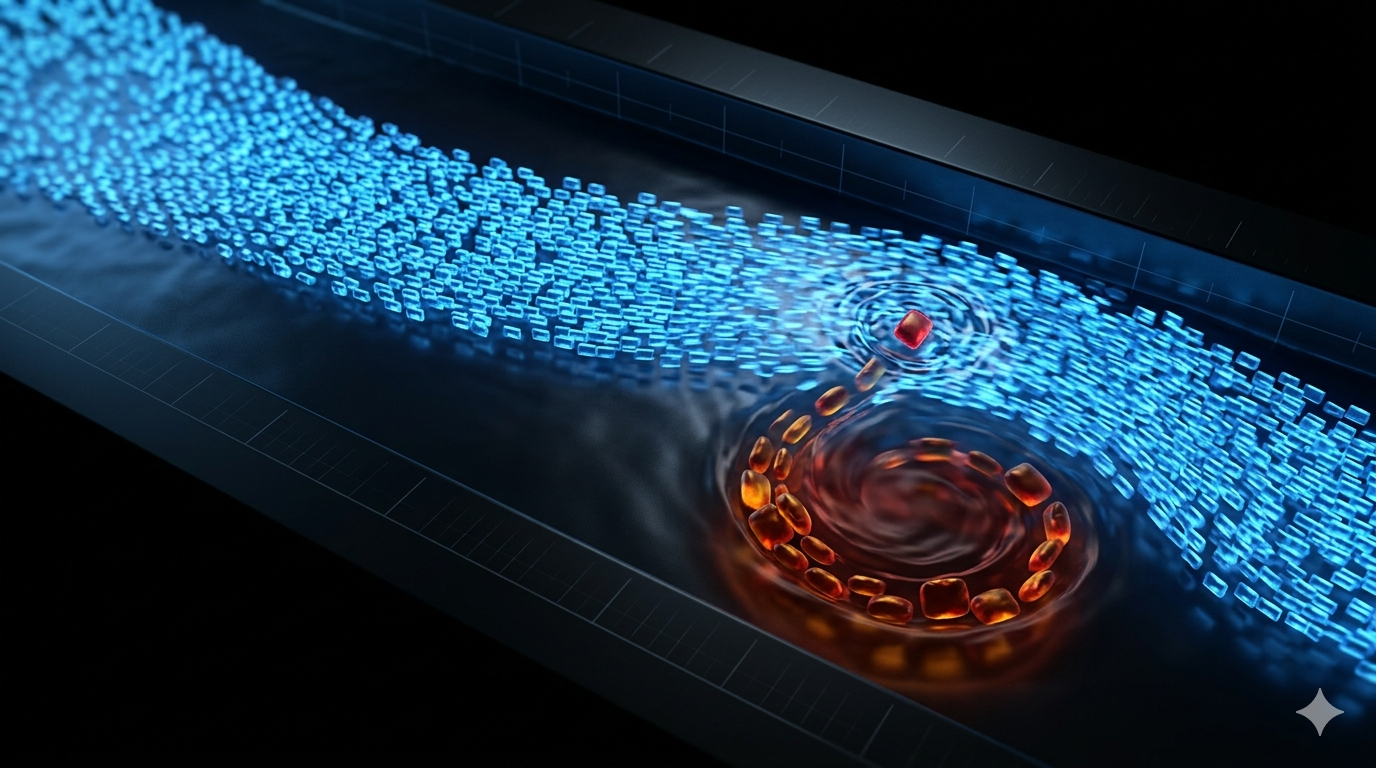
Ninety-six percent of requests flowed perfectly. The other four percent were drowning where nobody thought to look.
The Tweet That Changed Everything
The Slack notification came in at 9:47 on a Tuesday morning. Our head of sales had pasted a screenshot from Twitter. A customer our second-largest enterprise account had tagged us publicly: “Anyone else noticing @OurAPI taking forever on certain requests? Some calls return in 80ms. Others take 6+ seconds. What is going on?” My stomach dropped. I opened our monitoring dashboard and stared at it. Average response time: 210 milliseconds. Everything looked green. So why was a paying customer publicly calling us slow?
The Dashboard That Lied
We had built the API over fourteen months. I was proud of it. Our average latency sat comfortably under 250 milliseconds, and I had set alerts to fire if that number ever crossed 500. I ran load tests monthly. I presented latency charts in sprint reviews. “Our API is fast,” I told the VP of Engineering during a quarterly review, pointing at the flat green line. I thought I understood latency monitoring. I did not.
Six Seconds in Slow Motion
After the tweet, I pulled the raw request logs. Not the dashboard. The actual logs. I filtered by response time, sorted descending, and felt the air leave the room. There were requests taking four seconds. Five seconds. Six-point-three seconds. Not a handful roughly four percent of all requests over the past eight months had response times above three seconds.
I checked the P50. It was 140 milliseconds. Beautiful. The P95 was 380 milliseconds. Still fine. Then I looked for the P99. It was not there. We had never configured it. Our monitoring tool collected averages and medians. Nobody had ever added a percentile histogram.
I ran a quick query across eight months of logs, bucketing response times. The distribution had a long, fat tail. Wait it was not just a tail. It was bimodal. A second cluster of requests sat between three and seven seconds, invisible behind the median. Every aggregated chart we had built was doing exactly what averages do: hiding the extremes behind the middle.
“How long has this been happening?” my manager asked on a call that afternoon. I pulled the timestamps. The slow cluster first appeared the week we shipped a caching layer in March. A cache miss on a cold key triggered a synchronous database fallback with no timeout cap. For eight months, roughly one in twenty-five requests had been falling through that path. The P50 never moved. The average barely flinched. But the customers hitting those cold keys were waiting six seconds every single time.
The Aftermath
The enterprise customer’s renewal was up in six weeks. Their procurement team cited “reliability concerns” and asked for a sixty-day extension to evaluate alternatives. Our sales lead sent a one-line Slack message to the engineering channel: “We need to talk about this API.” There was no yelling. The quiet disappointment was worse.
What P99 Actually Tells You
The core problem was not the cache miss. It was that we measured the wrong thing. A P50 tells you what the typical user experiences. A P99 tells you what your unluckiest one-in-a-hundred user experiences and in a system handling thousands of requests per minute, that “unlucky” user shows up constantly. Think of it like a restaurant: if the average wait time is twelve minutes but one in fifty guests waits ninety minutes, your Yelp reviews will not mention the average. They will mention the ninety. The fix was a histogram-based latency metric with alerting on P95 and P99, combined with a timeout cap on the database fallback path. The timeout added a trade-off: a small percentage of cold-key requests would now return a partial response instead of a slow complete one. That partial response was still better than six seconds of silence. No monitoring setup eliminates tail latency entirely the goal is to make it visible before a customer makes it visible for you.
What to Do on Monday
Open your monitoring stack this week and check whether you have percentile-based latency tracking configured not just averages. If your P99 is missing or has never been reviewed, add a histogram metric and set an alert threshold. In your next pull request review or post-mortem, ask this question out loud: “What does the P99 look like, and when was the last time someone actually checked it?” That single sentence will surface more hidden production issues than any retrospective template.
The Green Dashboard
I still think about that flat green line on the monitoring dashboard. It told us exactly what we asked it to tell us and we never asked the right question. Eight months of invisible six-second responses, hiding behind a 210-millisecond average. The tweet is still up. I have not asked the customer to take it down. It is the most useful bug report we ever received. Have you checked your P99 this week? What would your monitoring dashboard hide from you if you only asked it for the average?
Understanding tail latency and percentile monitoring is not just about keeping your production systems healthy it is exactly the kind of real-world systems thinking that comes up in senior engineering interviews. If you are preparing for system design rounds at companies where distributed systems and observability matter, resources like NeetCode and ByteByteGo are solid for learning architectural patterns. For practicing with actual interview questions asked at specific companies, I have found **PracHub** useful for that kind of targeted preparation.
Follow me for more such content.
메타데이터
- post_id
- ee173cdcbfaa
- slug
- our-api-had-a-6-second-p99-for-8-months-nobody-noticed-until-a-customer-tweeted-ee173cdcbfaa
- url
- https://medium.com/beyond-localhost/our-api-had-a-6-second-p99-for-8-months-nobody-noticed-until-a-customer-tweeted-ee173cdcbfaa
- canonical_url
- https://medium.com/beyond-localhost/our-api-had-a-6-second-p99-for-8-months-nobody-noticed-until-a-customer-tweeted-ee173cdcbfaa
- author_url
- https://medium.com/@speedcraft21
- status
- ok
- fetched_at
- 2026-08-03 09:09:56