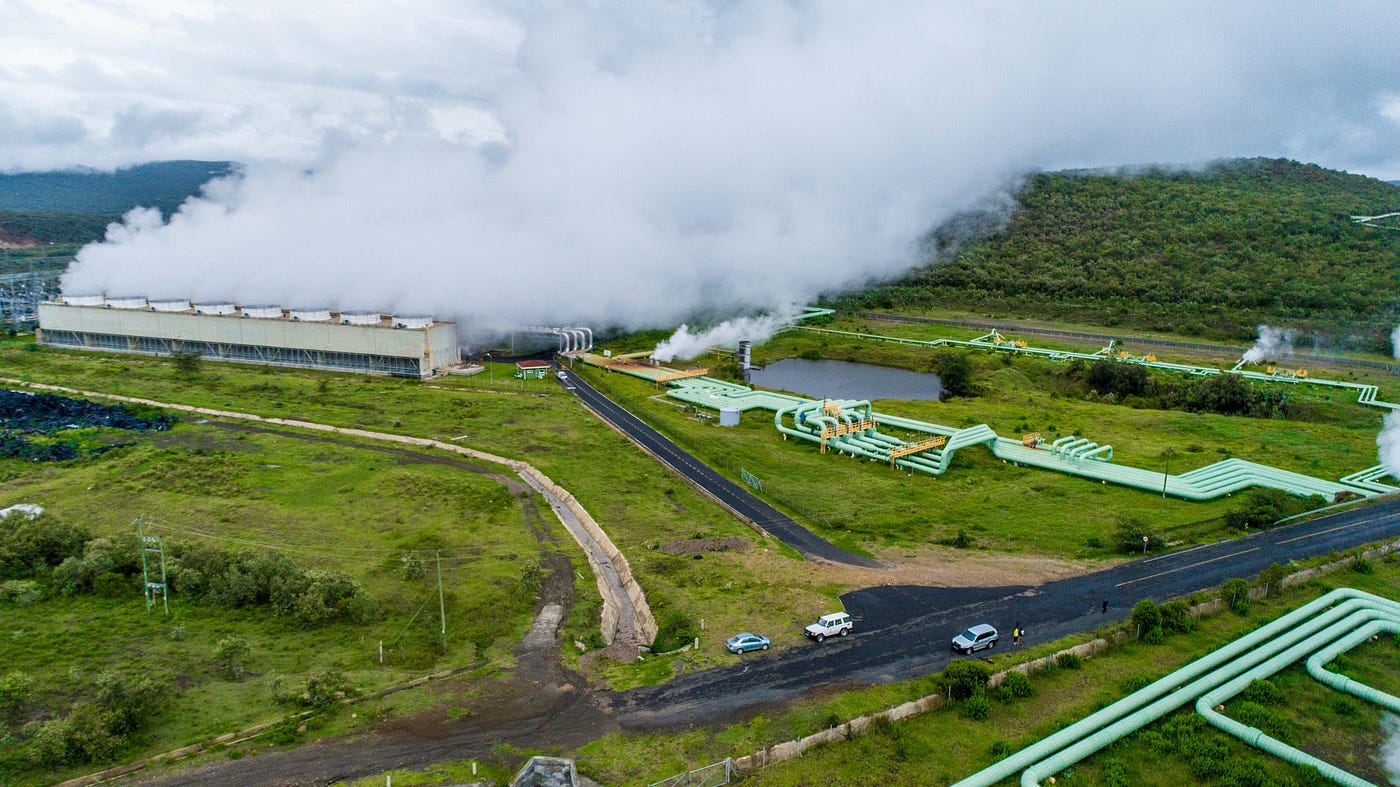
The Hidden Footprint of Solar Energy
An LCA investigation into the environmental impacts of solar PV manufacturing
The Hidden Footprint of Solar Energy
An LCA investigation into the environmental impacts hidden behind the solar panels
AI-generated media
Does Solar mean impact-free?
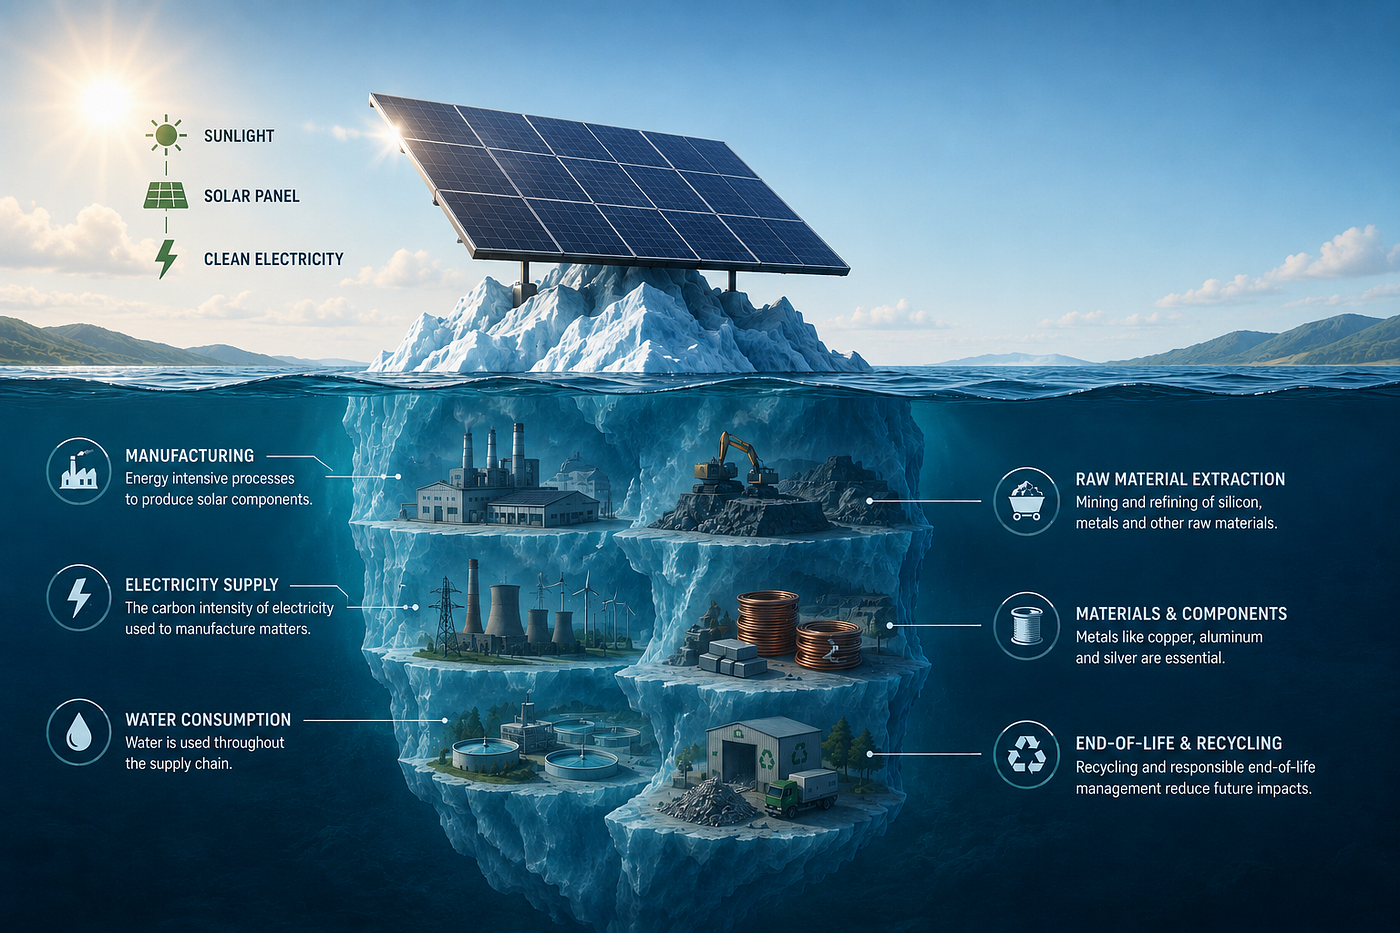
When we think about solar energy, we often think about what happens when the sun is shining: clean electricity, no fuel combustion and virtually no direct emissions during operation. And that’s true. Unlike coal- or natural gas-fired power plants, solar photovoltaic (PV) systems generate electricity without burning fuel during operation. But what about everything that happens before the solar panels start generating electricity? Have you ever thought about how your solar panels, and the components that support them, from inverters to mounting structures, are actually made? It might be surprising to realise that a solar PV system isn’t a 100% impact-free. Its environmental footprint begins long before it is installed. Silicon, the key material used in most solar cells, has to be extracted and processed. Metals such as aluminium, copper and steel have to be mined and manufactured. Glass and other materials have to be produced. And most importantly, the factories making these components need electricity to operate. As shown in Figure 1, a solar PV system has an environmental footprint across its entire lifecycle, from extracting raw materials to manufacturing, installation, operation and eventual end-of-life treatment.

Figure 1: Lifecycle of a Solar PV System (AI-generated media)
So while a solar panel doesn’t produce significant direct emissions while generating electricity, the story doesn’t start when the panel is installed, and it doesn’t end when the sun goes down.
So, how much does the way solar panels are manufactured actually affect how environmentally friendly solar energy is?
How do we measure the environmental footprint?
To understand the environmental footprint of a solar PV system, I used Life Cycle Assessment (LCA). LCA looks beyond a product’s operation and considers the environmental impacts associated with the different stages of its life, from raw material extraction and manufacturing through to use and, where included, end-of-life.
For this analysis, I adopted a cradle-to-grave perspective, with a particular focus on the manufacturing stage. I wanted to understand how manufacturing decisions, such as the electricity used during production and the materials used to manufacture components, can influence the overall environmental performance of a utility-scale solar PV system.
To carry out the LCA, I used openLCA, an open-source LCA software. A major part of an LCA is having reliable data about the processes involved. For example, how much electricity and raw material are required to manufacture a solar component? What emissions are associated with producing a kilogram of copper or processing silicon? Therefore, for this analysis, I used the BAFU lifecycle inventory database, an open-source database developed by the Swiss Federal Office for the Environment (FOEN) used for environmental impact assessments and sustainable decision-making. This database provided the necessary background data, such as the production of materials, electricity generation, transport, water use and waste treatment, needed to model the environmental impacts of the PV system.
But simply knowing what goes into and comes out of a system isn’t enough. Those flows need to be translated into meaningful environmental impacts. This is where Life Cycle Impact Assessment (LCIA) comes in. In simple terms, an LCIA takes data such as energy use, water consumption and emissions, and tells us what those flows could mean for things like climate change, air pollution, resource depletion and water use. For this, I used the ReCiPe 2016 Midpoint (H) impact assessment method. ReCiPe was selected because it provides a broad and established set of midpoint environmental indicators, allowing the analysis to look beyond greenhouse gas emissions and capture other environmental pressures associated with solar PV manufacturing.
This gave me a consistent basis for comparing different manufacturing configurations across several environmental impact categories. Rather than focusing only on carbon emissions, I selected five impact categories that were particularly relevant to the materials, energy use and manufacturing processes within a solar PV system:
- Global Warming — Measures the contribution of the system to climate change. This is a key indicator for evaluating whether changes in manufacturing electricity and material production can reduce the climate impact of solar PV.
- Fine Particulate Matter Formation — Captures the potential contribution of manufacturing activities to fine particulate air pollution, which can have significant effects on human health. This is particularly relevant to energy-intensive industrial processes and metal production.
- Terrestrial Acidification — Measures emissions that can contribute to the acidification of soils and ecosystems. It captures environmental effects that would be missed if the analysis focused solely on greenhouse gas emissions.
- Mineral Resource Scarcity — Assesses the pressure placed on mineral resources through the extraction and processing of materials such as copper and other metals. This category is particularly important for investigating the potential benefits of using secondary or recycled materials.
- Water Consumption — Measures water consumption associated with the lifecycle of the system. This is particularly relevant to solar PV because the production of materials such as silicon can involve significant water use.
To make the different scenarios directly comparable, the analysis used 1 kWh of electricity generated by the utility-scale solar PV system as the functional unit. This means that the environmental impacts reported throughout the analysis represent the impacts associated with generating one kilowatt-hour of electricity, allowing different manufacturing configurations to be compared on a like-for-like basis.
Establishing a baseline
For a scenario analysis like this, a baseline is important because it gives us a reference point against which all the alternative scenarios can be compared. It also ensures that the results remain consistent, with only the parameters being investigated changed between scenarios. Without a baseline, it would be difficult to determine whether changing a manufacturing decision actually improves or worsens the environmental performance of the solar PV system.
For this analysis, I established a baseline representing the original solar PV system before making any changes to its manufacturing location, electricity mix or material inputs. The model was based on the BAFU life cycle inventory database, and since the specific utility-scale PV process selected is a Swiss (CH) dataset, the baseline represents a ground-mounted PV system in a Swiss context.
The baseline system is a 560 kWp open-ground photovoltaic installation using monocrystalline silicon modules. Monocrystalline silicon was selected as it is a widely used crystalline-silicon PV technology.
All subsequent scenarios were compared against this baseline while keeping the other aspects of the system consistent. The results in Table 1 represent the environmental impacts associated with generating 1 kWh of electricity, the functional unit used throughout the analysis.
[embed]Table 1: Baseline LCA Results
At first glance, these numbers might seem surprisingly small. After all, 0.04192 kg of CO₂-equivalent per kWh doesn’t sound particularly significant. But these values represent the impact per unit of electricity generated. A solar PV system doesn’t generate electricity just once; it continues producing electricity throughout its lifetime. So what happens when we look at the environmental footprint over the 30-year lifetime of the system?
![Figure 2: Real-World Scale Comparison of Environmental Impacts [1], [2], [3], [4], [5] (AI-generated media)](https://miro.medium.com/v2/resize:fit:1400/1*ny4HISjz34Ta4JV75uSjmQ.png)
Figure 2: Real-World Scale Comparison of Environmental Impacts [1], [2], [3], [4], [5] (AI-generated media)
NB: Real-world comparisons are illustrative scale comparisons and should not be interpreted as direct physical equivalents of the LCIA results. In particular, CO₂-eq, PM₂.₅-eq, SO₂-eq and Cu-eq are characterised impact units rather than necessarily representing the physical quantity of the reference substance emitted or consumed.
These environmental impacts of a solar system are mostly influenced by decisions made even before the system ever produces its first kilowatt-hour of electricity. Manufacturing decisions such as where the individual components are manufactured, what electricity is used during manufacturing and what materials are used affect the environmental impact, and this is what I wanted to investigate.
Does manufacturing location matter?
To evaluate which components contribute most to the environmental impact of the system, I broke down the system into its individual processes and analysed the five highest-contributing processes for each impact category.
The hotspot analysis in Figure 3 showed that the environmental footprint of the PV system is distributed across different components and processes. The PV laminate was a particularly important contributor to global warming and water consumption, while the inverter and electrical installation were more influential for fine particulate matter, acidification and mineral resource scarcity. Rather than attempting to change every component simultaneously, I focused the manufacturing-location scenario on the PV laminate, as it was one of the major contributors to the overall environmental footprint. This provided a controlled way to investigate whether the geographical location of a major manufacturing stage influences the overall environmental performance of the system.
[embed]Figure 3: Hotspot Analysis
Now, narrowing in on manufacturing location, I found that the baseline PV laminate supply chain is split between China and the European region, with approximately 72% represented by the China (CN) dataset and 28% by the European (RER) dataset. To investigate whether manufacturing location matters, I varied the contribution of these two regions while keeping the rest of the system unchanged, creating the scenarios shown in Table 2
[embed]Table 2: Share of PV Laminates by Manufacturing Region
The baseline represents the original configuration in the BAFU dataset, while the balanced scenario assumes an equal contribution from both regions. The Europe-dominant and China-dominant scenarios represent the two extremes, allowing me to isolate the effect of manufacturing location and understand how much the results could change when the PV laminate supply chain is shifted entirely towards one region.
So, does manufacturing location actually matter?
The results suggest that it does, but not equally across all environmental impacts.
[embed]Figure 4: Effect of Manufacturing Location on Environmental Impact
Looking at the results in Figure 4, we see that shifting the PV laminate supply to Europe generally reduces the environmental footprint of the system, while shifting towards China increases it. What I didn’t expect was to see such a large difference in water consumption, particularly compared with the relatively small changes observed for some of the other impact categories. I explore this result further in chapter 9, “What surprised me”.
Global warming followed a similar pattern, although the difference was smaller: the Europe-dominant scenario reduced the impact by 3.75%, while the China-dominant scenario increased it by 1.43%.
However, this does not necessarily mean that manufacturing PV laminates in China is more environmentally harmful than manufacturing them in Europe. One possible explanation is that differences in the electricity mix used in manufacturing could be driving some of these results. Previous research also comparing PV manufacturing in Europe and China has found that differences in regional electricity mixes can materially affect the environmental footprint of PV production [6].
The effect of location was negligible for acidification and mineral resource scarcity. This suggests that sourcing PV laminates from Europe rather than China may reduce certain environmental impacts, but changing manufacturing location alone is not a universal solution for reducing the environmental footprint of solar PV.
What if manufacturing used cleaner electricity?
We saw in the previous chapter that manufacturing location appeared to matter. But if changing the manufacturing location changes the environmental footprint, what is actually driving that difference? Could the electricity used during manufacturing be part of the reason?
The International Energy Agency (IEA) reports that electricity accounts for around 80% of the energy used in solar PV manufacturing and that coal remains a major source of electricity for PV production. It also notes that locating PV manufacturing in regions with lower-carbon electricity can reduce manufacturing emissions. This provided a useful basis for the next scenario: what happens if we clean up the electricity used to manufacture the PV laminate?
The manufacturing-location analysis showed that the China-dominant configuration generally resulted in higher impacts than the Europe-dominant scenario, particularly for global warming and water consumption. I therefore kept the manufacturing location fixed and progressively reduced the carbon intensity of the electricity used in the China-dominant configuration as shown in Table 3. This allowed me to isolate the effect of the electricity mix while keeping the rest of the manufacturing system unchanged.
[embed]Table 3: China Electricity Decarbonisation Scenarios
It is worth noting that the fossil-free scenario represents an idealised case. While a power system can operate with very high shares of renewable electricity, wind and solar are variable resources whose output depends on weather conditions. Reaching a reliably fossil-free electricity system therefore requires sufficient flexibility, such as energy storage, stronger electricity grids, interconnection and other low-carbon dispatchable resources to balance periods of low renewable generation. For this reason, I use “fossil-free” as the most ambitious scenario in this analysis: it represents a hypothetical electricity system in which the fossil component of the manufacturing electricity mix has been replaced by existing low-carbon technologies. It is intended to show the potential environmental benefit of removing fossil electricity, rather than to suggest that this transition is straightforward.
The results, shown in Figure 5, reveal a clear trend: as the electricity mix became progressively less dependent on fossil fuels, the global warming impact fell considerably, reaching an 18% reduction under the fossil-free electricity scenario.
[embed]Figure 5: How Electricity Mixes Affects Manufacturing of PV Laminate
However, the effect was not the same across every environmental impact. While global warming responded strongly to changes in the electricity mix, other impacts changed much less, with mineral resource scarcity remaining essentially unchanged.
This highlights that making the electricity used to manufacture solar panels cleaner can significantly reduce their environmental footprint, but it cannot eliminate every environmental impact.
If we want to reduce the impacts that remain, perhaps we need to look beyond the electricity used to manufacture solar panels and back to the materials themselves.
Can circular manufacturing reduce material impacts?
Research by the U.S. National Renewable Energy Laboratory (NREL) has shown that circular strategies such as extending module lifetimes and recycling can reduce demand for virgin materials and life-cycle waste [7]. But how much could using recycled materials actually reduce the environmental impact of a solar PV system? And would the reduction be significant? This is what I explored next.
First, I carried out a hotspot analysis to identify which materials used in the solar PV system contribute most to its environmental impacts.
[embed]Figure 6: Material Contribution to Impact Categories
The hotspot analysis revealed that different materials drive different environmental impacts, as shown in Figure 6. Copper was particularly dominant for mineral resource scarcity, accounting for 66.22% of the net impact, while the silicon PV cell was the largest contributor to global warming and water consumption, accounting for 25.91% and 142%, respectively. The latter exceeds 100% because some processes in the system generate negative contributions that reduce the overall net impact.
Since copper and the silicon PV cell were among the most significant material contributors, I initially considered both for the circularity scenario. However, the BAFU database did not contain a suitable dataset for recycled PV cells. I therefore focused on copper, increasing its recycled content while keeping the rest of the system unchanged.
The original copper supply mix already contained approximately 21.98% recycled content. Rather than treating the baseline as entirely virgin copper, I therefore increased the recycled share progressively, creating the scenarios in Table 4.
[embed]Table 4: Recyled Copper Content Scenarios
The results in Figure 7 show that increasing the recycled content of copper had a much stronger effect on some environmental impacts than others. As the proportion of recycled copper increased, mineral resource scarcity fell by almost 60%, while fine particulate matter and acidification also decreased substantially. In contrast, global warming showed only a modest reduction, while water consumption remained essentially unchanged.
[embed]Figure 7: Effects of Increased Recycled Copper Content on Environemental Impact
This difference makes sense when we consider where these impacts come from. Producing virgin copper requires the extraction and processing of copper ore, which can contribute to particulate emissions, acidifying emissions and the depletion of mineral resources. Replacing virgin copper with secondary copper reduces the need for these primary extraction processes. However, recycling copper still requires energy and processing, so it does not necessarily eliminate all of the environmental burdens associated with producing and using copper.
The result is an important reminder that there is no single solution to reducing the environmental footprint of solar PV. A material intervention can substantially reduce some impacts while having little effect on others. The IEA even estimates that recycling end-of-life PV modules could supply more than 20% of the PV industry’s demand for aluminium, copper, glass and silicon between 2040 and 2050 under its Net Zero Scenario [8].
Which manufacturing decision matters most?
Looking across the three scenarios we’ve explored, one thing becomes clear: there isn’t a single silver bullet for reducing the environmental footprint of solar PV. It’s not simply about installing more solar panels; how those panels and their materials are produced matters too.
As shown in Figure 8, shifting manufacturing towards Europe had the greatest effect on water consumption, cleaner electricity had the largest effect on global warming, while increasing the use of recycled copper produced the largest reduction in mineral resource scarcity and also reduced acidification and fine particulate matter.
[embed]Figure 8: Summary of Scenario Analysis
The most effective intervention therefore depends on which environmental impact you’re trying to address:
- If your priority is climate change, cleaner electricity appears to offer the greatest opportunity.
- If your priority is mineral resource use, increasing the use of recycled materials, particularly copper, could have the greatest benefit.
- If your priority is water consumption, look beyond the PV panel itself and consider the water intensity of electricity generation and upstream PV-cell and silicon manufacturing.
- If your priority is reducing the overall environmental footprint, there is no single solution. The different interventions need to be considered together.
The takeaway isn’t that one manufacturing location, energy source or material is always better. It’s that different decisions solve different environmental problems. Making solar more sustainable therefore requires us to look at the entire supply chain, from the electricity powering factories to the materials going into the panel and what happens to them at the end of their life.
What surprised me
Why did changing the manufacturing location affect water consumption?
One of the most surprising results from the analysis was the change in water consumption when the PV laminate supply was shifted from China towards the European region.
At first, this seemed counterintuitive. If the physical process of manufacturing the PV laminate is broadly similar, why should simply changing its location have such a noticeable effect on water consumption?
Upon investigating further, I realised that the difference is not necessarily because a solar factory in one region physically uses more water than a factory in another. The environmental footprint of manufacturing also depends on the processes happening behind the scenes.
One important factor is electricity.
Manufacturing crystalline-silicon PV requires significant amounts of electricity, particularly further upstream in the silicon and wafer supply chain. Electricity generation can itself consume water, particularly in thermal power generation, where water is commonly used for cooling. Therefore, changing the electricity supply associated with manufacturing can also change the water footprint of the PV system.
Previous IEA-PVPS research estimated that electricity supply accounted for approximately 82% of the water-stress impact of mono-Si PV in its assessment. This highlights how important the electricity supply chain can be when assessing the water-related impacts of solar PV [9].
My own LCA showed a similar pattern. When I isolated the electricity contribution in the model, the China electricity supply had approximately 1.9 times the water-consumption impact per MJ of electricity compared with the European electricity supply in Table 5.
[embed]Table 5: Electricity Contribution and it’s water impact to PV laminate production
This means that, within the assumptions of my model, the same amount of electricity supplied through the CN electricity system carries a substantially higher water-consumption impact than electricity supplied through the RER system.
And this is perhaps one of the biggest lessons from the analysis:
The environmental footprint of a product isn’t determined only by what happens inside the factory. It can also be shaped by the seemingly invisible processes happening throughout its upstream supply chain.
Why didn’t Europe perform better for everything?
One result that surprised me was fine particulate matter. While shifting the PV laminate supply towards Europe reduced global warming and water consumption, it slightly increased the fine particulate matter impact.
At first, this seemed counterintuitive. Why would a region that performed better for some environmental indicators perform slightly worse for another?
Looking deeper into the contribution tree revealed one possible explanation: lignite combustion, a type of coal used in power plants, became a larger contributor to the fine particulate matter result in the Europe-dominant scenario, as illustrated in Figure 9.
[embed]Figure 9: Contributors to Fine Particulate Matter Impact Across Manufacturing Location Scenarios
This doesn’t mean that European solar manufacturing is inherently more polluting. Rather, it demonstrates how different environmental impacts can respond differently to changes in the electricity supply chain. A change that reduces one environmental impact does not necessarily reduce all other impacts.
However, the difference was very small. Fine particulate matter increased by only 0.19%, compared with the much larger changes observed for water consumption and global warming. The contribution analysis also showed that copper production and processing remained among the largest contributors to particulate-matter impacts regardless of manufacturing location.
This was an important reminder that changing the manufacturing location is not necessarily the most effective way to reduce every environmental impact. For fine particulate matter in this system, reducing impacts associated with upstream copper production and processing may offer greater potential than simply relocating PV laminate manufacturing.
What the analysis doesn’t tell us
It doesn’t tell us exactly what a real factory in China or Europe would consume
The analysis does not tell us exactly how much water, electricity or other resources a specific PV manufacturer in China or Europe would use. The LCA relies on regionalised background datasets, which represent average or modelled conditions rather than the performance of a particular factory. Actual impacts could therefore vary depending on factors such as production technology, plant efficiency, water recycling and the specific electricity supply.
The data may not represent today’s PV industry
Another limitation is the age of some of the underlying life-cycle inventory data. PV manufacturing has evolved rapidly, with improvements in cell efficiency, manufacturing processes, electricity sourcing and material use. As a result, older datasets may not fully represent current manufacturing conditions.
This means that my results should be interpreted as a comparison under the assumptions represented by the BAFU dataset, rather than as a definitive comparison of current Chinese and European PV manufacturing.
It doesn’t capture a circular PV supply chain
In the results, we saw that PV cell production contributes substantially to some of the impact categories, similar to copper production. However, we could not assess how recycling could reduce these impacts because the modelled system is based on conventional PV manufacturing and does not include a scenario in which recovered silicon or other materials from end-of-life modules are fed back into the production process.
This is an important limitation because recycling can reduce the need for virgin material extraction and, depending on the recycling process, could reduce the environmental impacts associated with producing new PV materials. As a result, the analysis provides a picture of the environmental footprint of a conventional PV supply chain, rather than a future circular PV system.
It doesn’t capture social and economic considerations
The analysis captures important environmental impacts, but environmental sustainability is only one part of the bigger picture. While we are working towards a cleaner climate and environment, there are people behind these systems who produce the materials, manufacture the components and operate the infrastructure. There are also financial and economic considerations involved in implementing these changes.
An environmental LCA does not automatically tell us about factors such as labour conditions, worker health and safety, human rights, manufacturing costs or energy security. These socioeconomic factors would need to be assessed separately to understand the broader implications of an intervention and whether it is truly sustainable from environmental, social and economic perspectives.
The big takeaway
Solar energy isn’t impact-free. Manufacturing the materials, generating the electricity needed to produce them and extracting the resources required for the technology all have environmental consequences.
But perhaps the more important finding is that these impacts aren’t fixed. Where we manufacture solar components, how we power those factories and whether we use virgin or recycled materials, among other manufacturing decisions, can all influence the environmental footprint.
Now, this article wasn’t written to say that solar is bad for the environment. Solar doesn’t have to be impact-free to be part of a cleaner energy system. Nothing is perfect. But if we’re serious about making renewable energy truly sustainable, we need to look beyond what happens when the sun hits the panel and start paying attention to what happens long before it gets there.
References
[1] O. US EPA, ‘Greenhouse Gases Equivalencies Calculator — Calculations and References’, US EPA. Accessed: Aug. 17, 2026. [Online]. Available: https://19january2021snapshot.epa.gov/energy/greenhouse-gases-equivalencies-calculator-calculations-and-references
[2] J. E. Houck, L. Y. Pitzman, and P. Tiegs, ‘Emission Factors for Aged Uncertified Residential Cordwood Heaters’.
[3] W. S. Smith and C. W. Gruber, ‘Atmospheric Emissions from Coal Combustion’.
[4] B. Nogrady, ‘Your old phone is full of untapped precious metals’. Accessed: Aug. 17, 2026. [Online]. Available: https://www.bbc.com/future/article/20161017-your-old-phone-is-full-of-precious-metals
[5] ‘Your views needed: Providing sustainable water-based play facilities in Elmbridge | Elmbridge Borough Council’. Accessed: Aug. 17, 2026. [Online]. Available: https://www.elmbridge.gov.uk/news/2022/your-views-needed-providing-sustainable-water-based-play-facilities-elmbridge?utm_source=chatgpt.com
[6] L. Stamford and A. Azapagic, ‘Environmental Impacts of Photovoltaics: The Effects of Technological Improvements and Transfer of Manufacturing from Europe to China’, Energy Technology, vol. 6, no. 6, pp. 1148–1160, Jun. 2018, doi: 10.1002/ente.201800037.
[7] H. Mirletz, S. Ovaitt, S. Sridhar, and T. M. Barnes, ‘Circular economy priorities for photovoltaics in the energy transition’, PLoS ONE, vol. 17, no. 9, p. e0274351, Sep. 2022, doi: 10.1371/journal.pone.0274351.
[8] ‘Executive summary — Solar PV Global Supply Chains — Analysis’, IEA. Accessed: Aug. 15, 2026. [Online]. Available: https://www.iea.org/reports/solar-pv-global-supply-chains/executive-summary
[9] P. Stolz et al., ‘Water Footprint of European Rooftop Photovoltaic Electricity based on Regionalised Life Cycle Inventories’, NREL/TP — 6A20–73844, IEA-PVPS-T12–11:2017, 1561520, Dec. 2017. doi: 10.2172/1561520.
Note: Parts of this article were reviewed and edited with the assistance of generative AI to improve clarity and accuracy. All final content reflects the author’s own analysis and perspective.
메타데이터
- post_id
- ee84f53e38b8
- slug
- the-hidden-footprint-of-solar-energy-ee84f53e38b8
- url
- https://medium.com/@theodora.matekole/the-hidden-footprint-of-solar-energy-ee84f53e38b8
- canonical_url
- https://medium.com/@theodora.matekole/the-hidden-footprint-of-solar-energy-ee84f53e38b8
- author_url
- https://medium.com/@theodora.matekole
- status
- ok
- fetched_at
- 2026-08-20 06:23:42