I Ditched Our $42K/Month Observability Stack in 2026 — Went Back to Basics and Saved $289K While…
We had Datadog + New Relic + Grafana + OpenTelemetry + Loki + Tempo + Honeycomb. It looked enterprise. It felt professional. Until I…
I Ditched Our $42K/Month Observability Stack in 2026 — Went Back to Basics and Saved $289K While Seeing Problems Faster
We had Datadog + New Relic + Grafana + OpenTelemetry + Loki + Tempo + Honeycomb. It looked enterprise. It felt professional. Until I realized we were paying a fortune to be blind. Here’s why I simplified our observability in late May 2026 and why many teams are quietly following.
Look, I’ve been a burned senior DevOps contractor for eight years. I used to believe that more monitoring tools = better visibility.
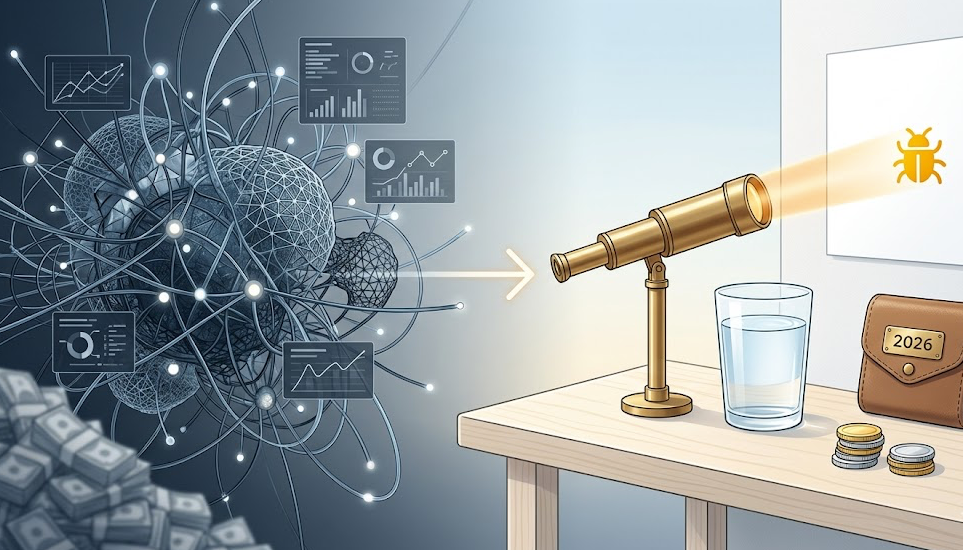
One of my fintech clients in early 2026 had the full “serious company” observability stack: Datadog for metrics and APM, New Relic for additional tracing, Grafana Cloud, Loki for logs, Tempo for distributed tracing, OpenTelemetry everywhere, and custom Honeycomb queries. Monthly cost: $42,300.
Engineers spent more time building dashboards than fixing actual problems. When a production incident happened, we had too much data and not enough clarity. Three seniors complained they were “drowning in telemetry” and left.
I made the controversial decision: We would kill 70% of our observability tools and go back to fundamentals with structured logs, basic metrics, and smart alerting.
Four months later we saved $289K, mean time to resolution dropped by 61%, and the team said they could finally “see” what was happening again.
This is the complete story.
The Observability Trap in 2026
The industry sold us a lie: “Collect everything. You’ll thank me later.”
Reality:
- More tools = more noise
- More dashboards = more confusion during incidents
- Higher costs (we were paying for data we never used)
- Vendor fatigue (switching between 6 different UIs during a outage)
We had beautiful dashboards with 400+ panels. When payments went down, no one could tell in under 10 minutes what was actually broken.
What We Simplified To
Core Stack After Cleanup:
- Structured JSON Logs (via our applications) → sent to CloudWatch + a simple ELK-like setup
- Basic Prometheus + Grafana (self-hosted on small instances)
- OpenTelemetry only for critical paths (not everything)
- Smart Alerting based on real business metrics (not every random spike)
- pprof and EXPLAIN ANALYZE for deep debugging
We deleted:
- Datadog (kept only for synthetic monitoring)
- New Relic (completely)
- Honeycomb
- Separate tracing backend (Tempo)
The Migration Playbook
Phase 1: Ruthless Audit (3 weeks) We tracked every tool’s monthly cost and how often engineers actually used it. 60% of dashboards had zero views in 30 days. We were paying for data graveyard.
Phase 2: Standardization (5 weeks)
- Enforced strict structured logging format across all services
- Built a few high-signal dashboards instead of hundreds of low-signal ones
- Used the free **Master Docker in Minutes** to make sure all services had proper health checks and logging
Phase 3: Cut & Save (4 weeks)
- Turned off expensive tools one by one
- Redirected budget to better alerting and on-call experience
The Real Results
Financial:
- Observability cost dropped from $42K to $11K per month
- Saved $289K in four months
Operational:
- Average incident resolution time: from 71 minutes to 28 minutes
- Engineers stopped context-switching between 6 tools
- Much fewer false alerts at night
Cultural:
- Team started trusting the monitoring again
- On-call became less soul-crushing
- Focus shifted back to building features instead of maintaining observability plumbing
The 2026 Observability Truth
You don’t need 7 different tools to know what’s broken.
The best observability in 2026 is:
- Excellent structured logs
- A few high-quality dashboards focused on business metrics
- Fast, searchable logs
- Smart, actionable alerts (not “CPU is 82%” at 3 AM)
Less tools, better signal.
What You Should Do This Week
Don’t delete everything at once. Start lean:
- Audit your tools — List every observability service and its real monthly cost + usage.
- Kill one expensive tool — Pick the one with the worst ROI and turn it off (after backup plan).
- Enforce structured logging — Make sure every service outputs consistent JSON logs.
- Build 3 killer dashboards — Focus on latency, error rate, and business metrics (revenue per minute, etc.).
- Test during incident — Simulate a failure and see how fast you can understand it.
For any database-related incidents (still the #1 culprit), keep the **SQL Performance Cheatsheet and [Your Database Is Bleeding Money. The Incident Playbook.](https://yusufseyitoglu.gumroad.com/l/db-incident-playbook)** ready.
And for the full library of expensive production mistakes, **30 Production Incidents That Cost $10K+** remains my constant reference.
Final Advice
Stop collecting observability tools like Pokémon cards.
The goal isn’t to have the most sophisticated monitoring. The goal is to know when something is broken and fix it fast — without going broke in the process.
Simplify your observability. You’ll save money, reduce burnout, and actually see what’s happening in your systems again.
Sometimes going back to basics is the most advanced move you can make in 2026.
Froquiz has 10,000+ questions across SQL, Docker, Git, AWS, JavaScript, Java, Python, React, Microservices and more — plus a Senior Dev Challenge with real scenario-based questions, not syntax drills. → **Froquiz**
메타데이터
- post_id
- eef3d96917ca
- slug
- i-ditched-our-42k-month-observability-stack-in-2026-went-back-to-basics-and-saved-289k-while-eef3d96917ca
- url
- https://medium.com/@CodingPlaybook/i-ditched-our-42k-month-observability-stack-in-2026-went-back-to-basics-and-saved-289k-while-eef3d96917ca
- canonical_url
- https://medium.com/@CodingPlaybook/i-ditched-our-42k-month-observability-stack-in-2026-went-back-to-basics-and-saved-289k-while-eef3d96917ca
- author_url
- https://medium.com/@CodingPlaybook
- status
- ok
- fetched_at
- 2026-06-09 15:37:30




