Probability & Sampling for Data Analysts: Understanding Uncertainty in Data
Understanding uncertainty, sampling variation, and why averages stabilize
Probability & Sampling for Data Analysts: Understanding Uncertainty in Data
Understanding uncertainty, sampling variation, and why averages stabilize
Series Note:
This article continues Series 3 (Part 2) of the Shahnaz Insights roadmap.
In Part 1,**Statistics for Data Analysts , we explored how descriptive statistics summarize patterns in data. Now we go one step deeper — understanding uncertainty, sampling variation, and why averages stabilize with repeated sampling**.

Understanding:
A marketing team noticed that 18% of sales days crossed ₹7,000 after analyzing their dataset. Leadership saw this spike and wanted to scale the strategy — but one key question remained: was this improvement meaningful or just random variation?
Every dataset contains natural fluctuations, and analysts must separate real signals from noise.
In this article, we explore probability, sampling variation, and the Central Limit Theorem, which explain why averages stabilize as sample sizes grow.
What You Will Learn:
By the end of this article, you will understand:
- Why probability helps interpret uncertainty in data
- How analysts estimate event likelihood from observed data
- Why random samples fluctuate
- The difference between population parameters and sample estimates
- Why repeated sampling produces stable averages
- How sampling bias can distort conclusions
Why Probability Matters in Business:
Descriptive statistics summarize what happened in the data.
Probability helps us understand how reliable those observations are.
Without probability:
- A trend could be random fluctuation
- A performance spike could be temporary
- A decision could be misleading
Probability provides the framework for interpreting uncertainty in business data.
Basic Probability — Business Interpretation:
Probability measures the likelihood of an event.
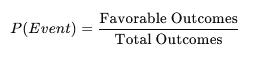
But analysts rarely calculate coin tosses. They calculate customer behavior.
Coding Setup (Used Throughout This Article):
Analyst Note: We set a random seed to ensure reproducible results so the same random samples appear each time the code runs.
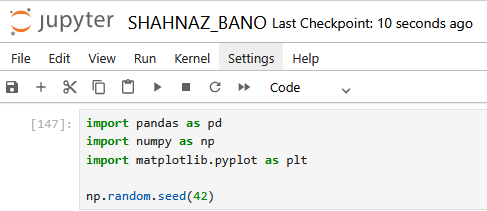
Why the Seed Matters: A random seed keeps random simulations consistent and reproducible.
1️⃣ Probability — Measuring Likelihood in Business:
Probability measures how likely something is to happen.
In analytics, this could mean:
- Probability of high sales
- Probability of churn
- Probability of conversion
It converts observation into measurable likelihood.
Creating the Dataset:
We start with a simple sales dataset.
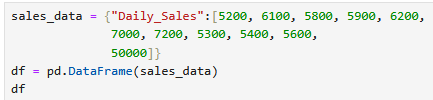
Result
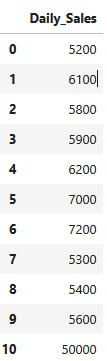
You’ll notice:
- Most sales values are between 5200 and 7200
- One value (50,000) is extremely large
- This represents an outlier
Such outliers can strongly influence averages, which we discussed in Part1.
Now we explore how probability helps interpret this variation.
Probability of a High Sales Day —
Let’s define a high sales day as sales above 7000.

Result

You’ll notice:
- Only a small portion of days exceed 7000
- The dataset contains a limited number of high-performing days
Mathematically:
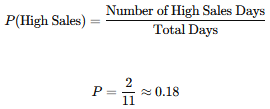
Analyst Interpretation
Only 18% of days are high-performing. And one of them is an extreme outlier.
Probability gives context to performance.
2️⃣ Why Sampling Matters:
In business analytics, analysts rarely have access to complete population data.
Instead, decisions are based on samples.
Reasons include:
- collecting full data can be expensive
- it may take too much time
- some populations are too large to measure fully
Because of this, analysts rely on samples to estimate reality.
Population Mean vs Sample Mean —
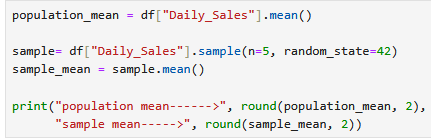
Result

You’ll notice:
- Sample mean ≠ Population mean
- The two values are close but not identical
This difference is called sampling variation.
Even with random sampling, estimates naturally fluctuate.
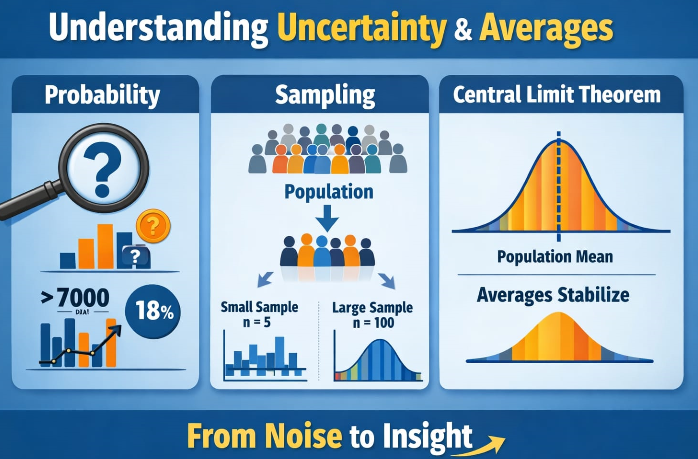
Central Limit Theorem — Why Averages Stabilize:
When we repeatedly draw samples:
- sample means begin to form a normal distribution
- the distribution centers around the population mean
This principle is called the Central Limit Theorem (CLT).
It explains why averages become stable as sample size increases.
Central Limit Theorem (Under Sampling):
When we repeatedly draw samples and compute their means, the distribution of those means tends to become approximately normal, even if the original data is skewed. This explains why sample averages stabilize around the population mean as sampling is repeated.
CLT Rule of Thumb — The 30 Sample Guideline:
In practice, analysts often use a simple rule: when the sample size is 30 or more (n ≥ 30), the sampling distribution of the mean tends to become approximately normal. This is why larger samples produce more stable and reliable averages.
Small vs Large Samples —
The size of the sample plays a crucial role in how stable the averages become.
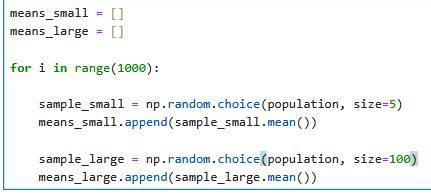
Small samples (n = 5) show greater fluctuation, so sample means can differ noticeably from the population mean. With limited data, the sampling distribution may appear irregular.
Larger samples (n = 100) produce more stable averages that move closer to the population mean. As sample size increases, the distribution becomes smoother and estimates become more reliable.
CLT Simulation:
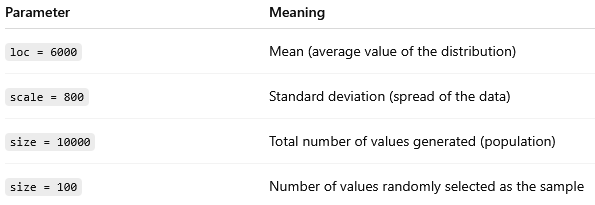
Let’s simulate drawing a random sample from a larger dataset.

This generates numbers from a normal distribution.
Result

You’ll notice:
- The sample mean is close to the population mean
- However, the two values are not exactly the same
This variation is natural.
Probability explains why this difference exists when we observe samples rather than the entire population.
Visualizing the Sampling Distribution:
To better understand how sample means behave, we repeatedly draw samples from the dataset and compute the mean of each sample.
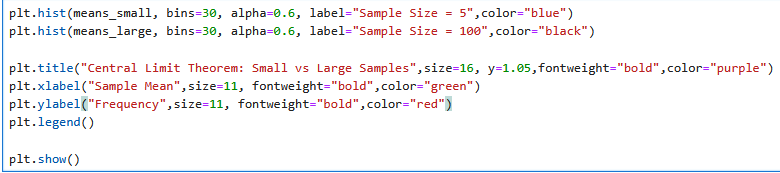
Next, we visualize how these sample means are distributed.
Result

You’ll observe:
- You’ll observe:
- The distribution for small samples (n = 5) is wider and more irregular.
- The distribution for larger samples (n = 100) becomes smoother and more concentrated.
- Both distributions center around the population mean.
This demonstrates an important property of the Central Limit Theorem.
As sample size increases, the distribution of sample means becomes more stable and closer to a normal (bell-shaped) distribution.
Connecting Probability to Decision-Making:
Now we combine the key ideas from this article:
- Descriptive statistics summarize what we observe in the data.
- Probability helps interpret uncertainty and variability.
- Sampling theory explains why estimates fluctuate.
- The Central Limit Theorem shows why averages stabilize as sample size increases.
Together, these principles allow analysts to make reliable decisions even when working with samples instead of entire populations.
Sampling Risk — Sampling Bias:
Not all samples represent the population accurately.
Bias can occur when sampling focuses on:
- only premium customers
- only one geographic region
- only a specific time period
When this happens, conclusions may become misleading or incomplete.
Reliable analysis therefore depends on random and representative sampling.
Key Takeaways:
- Probability helps interpret uncertainty in data.
- Random samples naturally fluctuate, creating variation in estimates.
- Sampling variation is normal, even with unbiased samples.
- The Central Limit Theorem explains why averages stabilize.
- Reliable analysis depends on representative sampling.
Final Reflection:
A pattern observed in a sample is not automatically a fact about the population.
It is only an estimate.
Strong analysts recognize this uncertainty and rely on statistical reasoning before drawing conclusions.
🔎 What’s Next — Series 3 (Part 3):
In the next article, we move from observing patterns in data to determining whether those patterns are truly meaningful or simply random variation. Because seeing change is easy — proving it matters is the real analytical skill.
If this article clarified probability and sampling for you, consider following Shahnaz Insights for structured, career-aligned data content.
And if you found it valuable, a clap 👏 helps this reach other aspiring analysts. 🚀
메타데이터
- post_id
- ef2c7e4017e2
- slug
- probability-sampling-for-data-analysts-understanding-uncertainty-in-data-ef2c7e4017e2
- url
- https://medium.com/@shahnazinsights/probability-sampling-for-data-analysts-understanding-uncertainty-in-data-ef2c7e4017e2
- canonical_url
- https://medium.com/@shahnazinsights/probability-sampling-for-data-analysts-understanding-uncertainty-in-data-ef2c7e4017e2
- author_url
- https://medium.com/@shahnazinsights
- status
- ok
- fetched_at
- 2026-08-07 04:39:38