The Floor Tile That Knows Your Customers Better Than You Do — Using Just a Step
Most stores don’t have a real idea of how customers really move. They rely on surveillance, rough estimates, and expensive analytical…
The Floor Tile That Knows Your Customers Better Than You Do — Using Just a Step
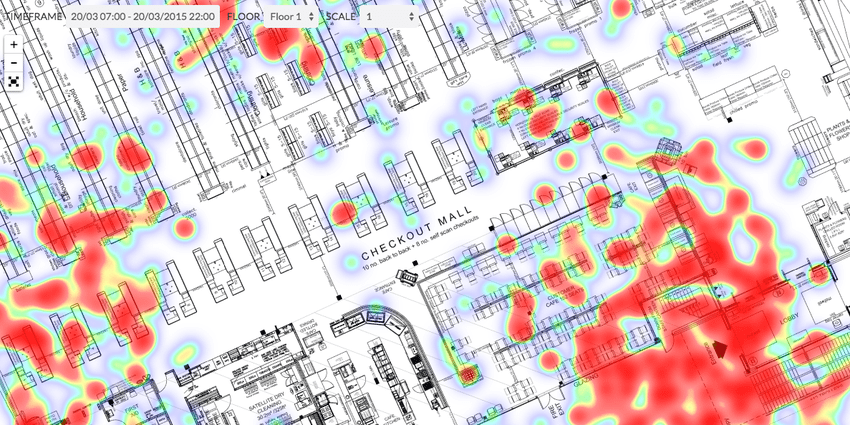
Figure 1.1 // Image by Vasilios Mavroudis on Research Gate // Heat map showing customer movement in a retail store
Most stores don’t have a real idea of how customers really move. They rely on surveillance, rough estimates, and expensive analytical systems that costs stores thousands of dollars per store. Meanwhile the data of customer’s foot path patterns, most efficient aisle placements, and how effective certain displays are, is literally right under their feet.
Nowadays, heat maps are extremely outdated and tells you little data of how customers move. Customers are viewed as hot spots that don’t exactly tell you how many individuals are in that cluster. Cluster data is very limited; rather it just shows where they are at a given time. So how can we be more accurate of consumer shopping patterns related to how long we stay in a certain area? Well the answer is simpler than you might think.
The Hidden Gaps with In-store Analytics
There are six methods of tracking accurate data of consumers in a retail store according to Shopify.
- Mobile Devices
- People Counting Sensors
- Wi-Fi Traffic
- Video Analytic Platforms
- Manual Counting
- POS Data
Let’s look a bit deep to each method and their inaccuracies.
- Mobile Devices

Figure 2.1 // Image by BeCo on Medium // Product Locator System
Mobile Devices are considered the innovation of our lifetime. Everything we ever needed are packed in a device as small as my palm. Retail stores take advantage of this; look on your app list on your phone, how many of those apps are retail stores? Retail brands are now able to track data on your location when you are in stores without you even thinking about it. So many people fall for their marketing strategies and end up selling themselves out for an extra 10% off. Mobile devices are extremely efficient at detecting customer patterns as it has live data of where every customer with an app is. However, it does come with its inefficiency as well. Relying on this strategy will ultimately create sample bias and effect the customer’s view on the company. By making decisions with sample bias, results will be less effective to the general population of consumers.
2. People Counting Sensors

Figure 2.2 // Image by Camlytics // People Counting Sensor Software
Realistically in the a retail environment, you want your workers to focus on their actual job not thinking about how they can involved in your next marketing campaign. People counting sensors operate on their own with little to no maintenance at all unlike mobile apps that require employees to promote them. These sensors are privacy friendly and doesn’t require location track that you would see with mobile apps. Where this falls short is with large groups and accuracy throughout the store; this method is more built for individual enter and exit counting rather than actual shopping patterns.
3. Wi-Fi Tracking

Figure 2.3 // Image by Haptic Networks // Wi-Fi Signal Tracking within a store
Much like mobile apps, it tracks the location of Wi-Fi signals that create a visual heat map showing where the most signal came from. Heat maps don’t have that element of tracking where we can see how long customers spend on in a specific areas. They are just categorized as a colour on a heat map.
4. Video Analytic Platforms

Figure 2.4 // Image by Retail Sensing // Cameras Tracking Customer’s Journey in a Store
Using CCTV to collect information on customers with special software that can track their movement within the store. These softwares can create data on individual movements, which areas gets busier than others, and detect suspicious activity from customers. Although this is widely popular, there are concerns of privacy and requires significant storage.
5. Manual Counting

Figure 2.5 // Image by SFL Worldwide // Manual Counting of Packages
This might be the most ineffective method out of any options. Instead of focusing purely on sales and customer relations, this method uses manual labour to create marketing data. Half of the time the data made from manual counting won’t be used. This is because there isn’t enough man power in the store to keep up manual counting, new marketing structures, and operations.
6. POS Data

Figure 2.6 // Image by Retail Data Systems // POS Data Tracks Visitors in a Store
This tracks how many people in a store through buying. The system keeps track of sales that “count” how much people have visited the store. Again, this data is relatively useless to marketing strategies since it virtually detects no patterns. Additionally, it only accounts for people that have actually bought something, not those who browse or are curious in certain products.
Thought Process
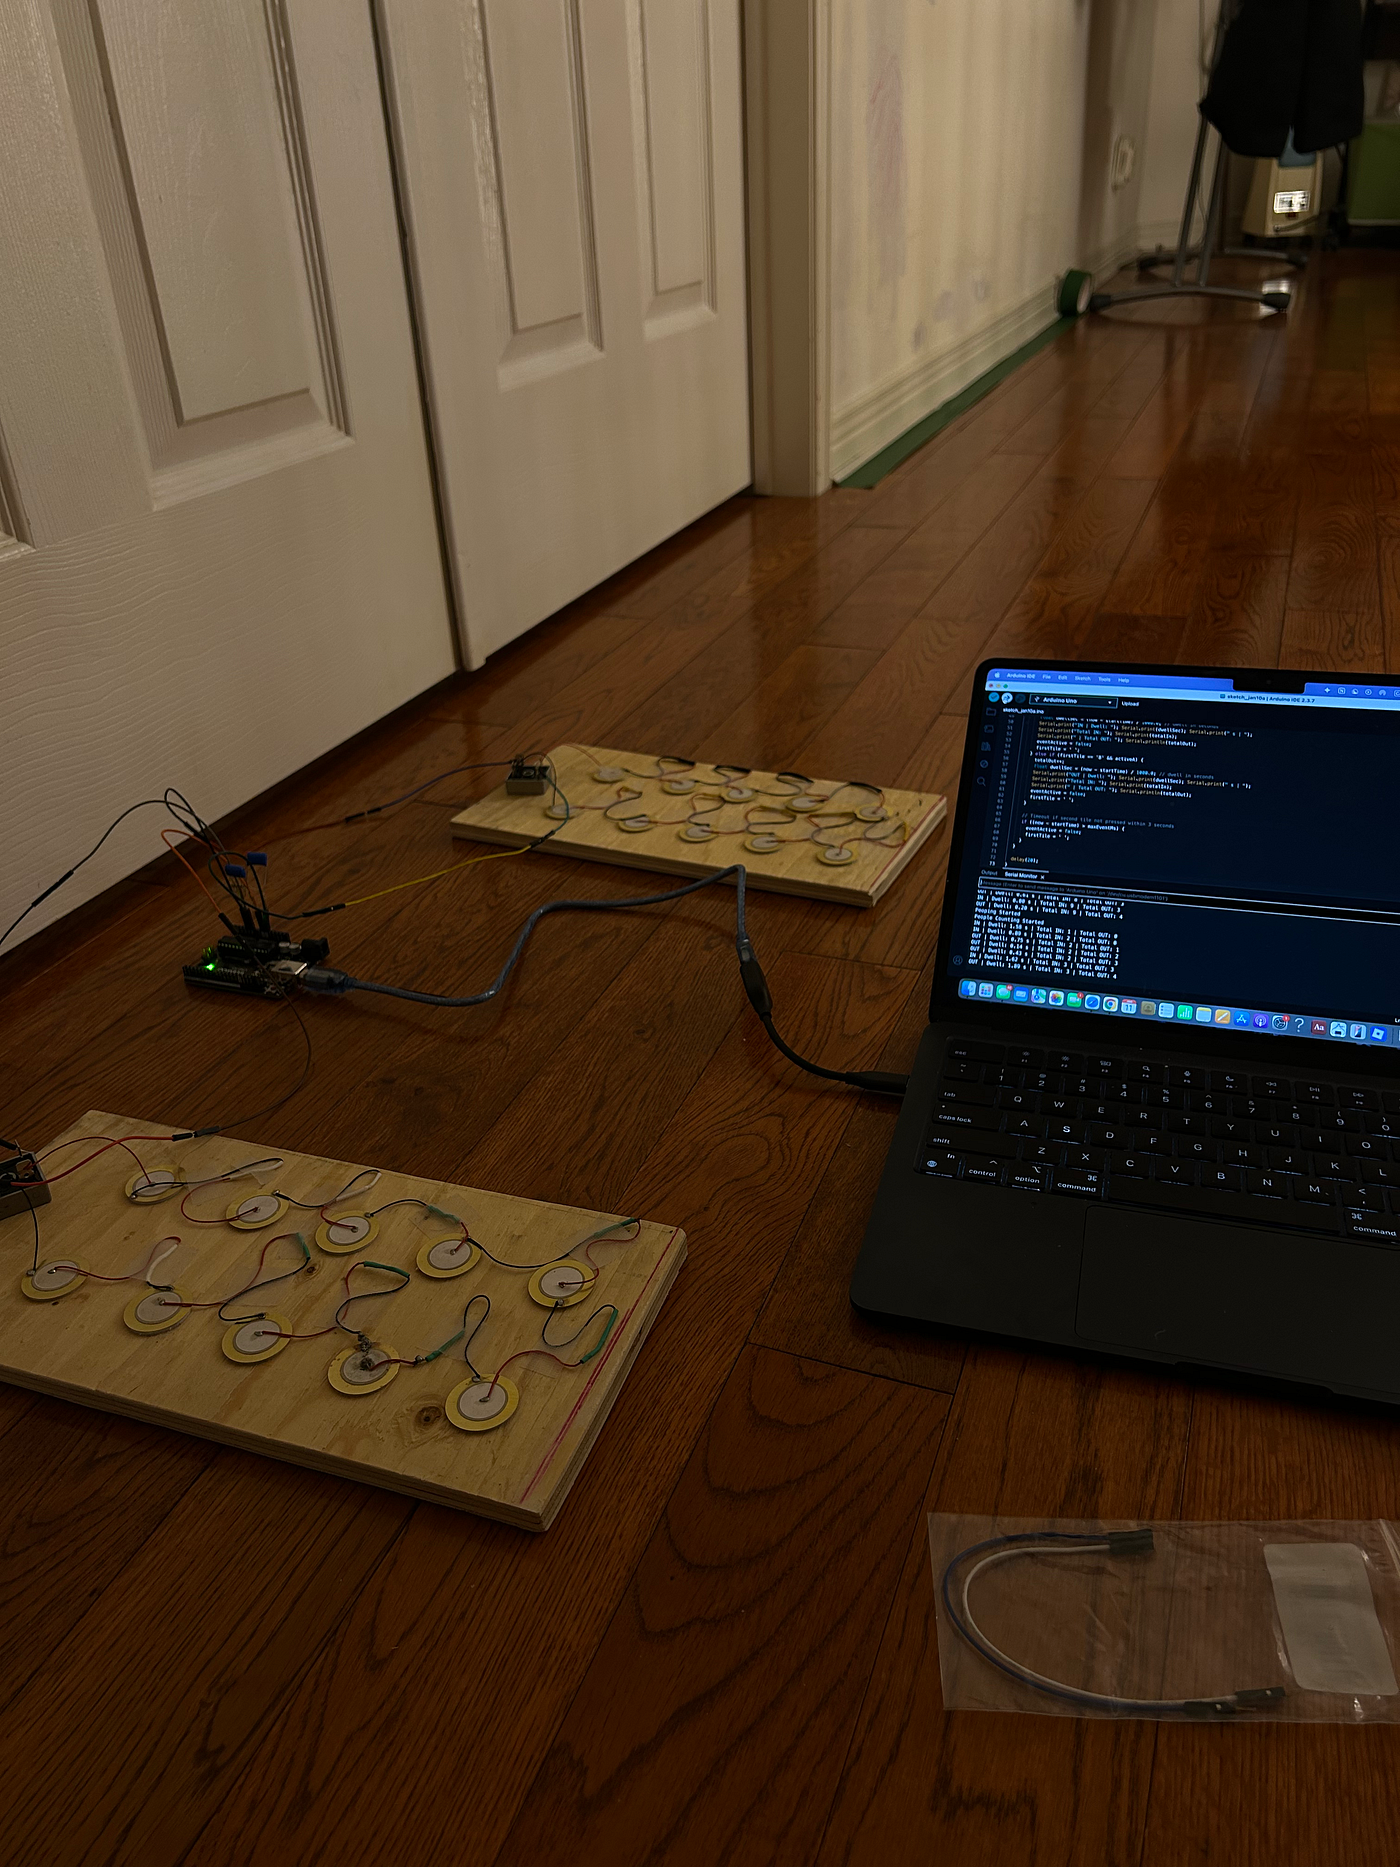
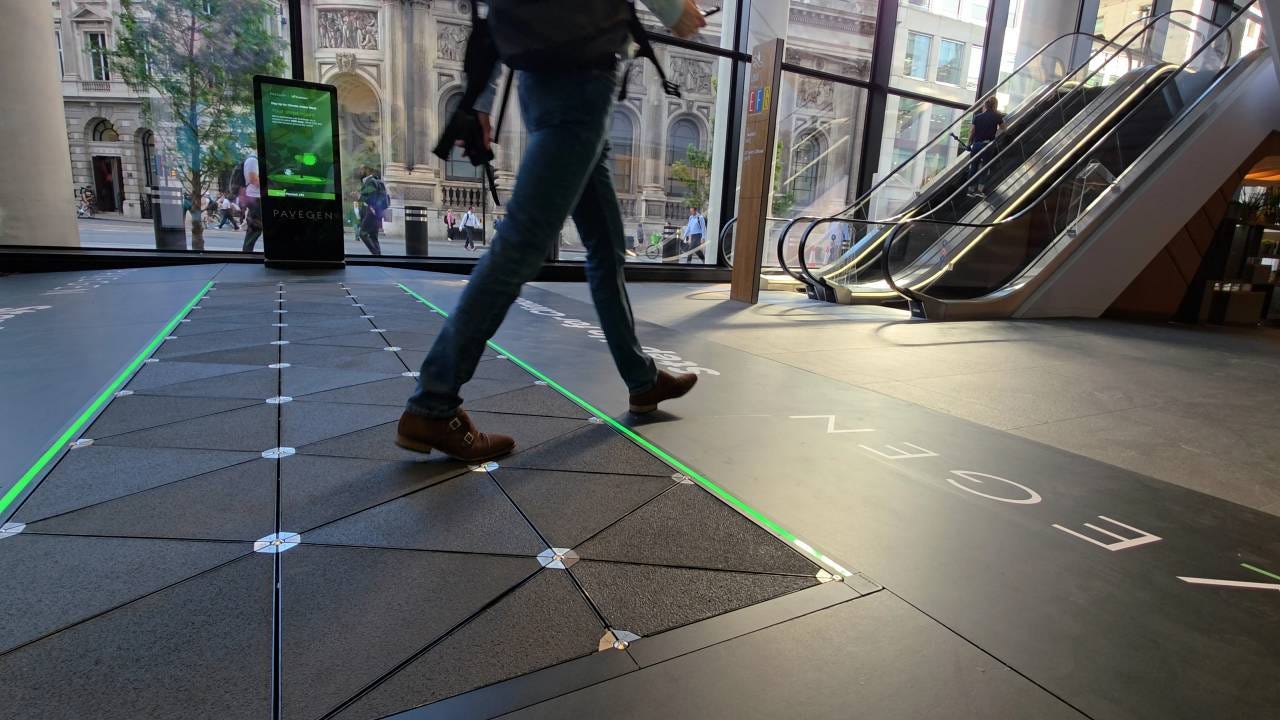
For my project, I saw the gaps in people counting sensors where they lack accuracy in large groups. To solve this issue I thought of using piezos to estimate how many people are in that group. When piezos are pressed down they output current. If we can determine how much one footstep is approximately we can find how much people are in a group based on the output of the piezo. It’s simple. If the output of the piezo is double the approximate output current then the group of people has two people. Usually people counting sensors are placed at the front and exit of stores, but if these piezo-data collecting tiles are placed throughout the store, we are able to track data by grid. This solves the issue of it being limited to counting fixed locations. With tiles, grid by grid data is extremely crucial in understanding how the consumer thinks. The tile itself should do more than just counting it should be able to: count how long someone has stayed on a tile, read how much pressure is on the tile for identifying groups, and display information easily. That became the basis for my prototype on Tinkercad.
[embed]Figure 2.7 // Video By Daniel Fung on Youtube // Piezo — Data Collection Tile
Now why do stores even need this data? I mean it’s not like product placement would actually increase sales right?
We see this concept often with store like IKEA and Walmart. The layout of their stores directly interrelates with sales, but why is that?

Figure 3.1 // Image by Fixtures Close Up // IKEA Store Layout
IKEA’s stores are built in a path that lead customers to likely impulse spend. To get what they came for they must go through the whole store, maybe picking up one or two things. This is how layout can become profitable.

Figure 3.2 // Image by 24/7 Wall Street // Walmart Floor Plan
Walmart has been notorious for changing layouts in favour of more profit. Recently my local Walmart has changed layouts as well. Their new layout is built for maximum efficiency of sales; to get what you need, you’ll see something you want.
To get all these layout changes, brands must collect the data to improve their systems, layouts, and operations. Traditionally this meant spending thousands on somewhat accurate systems, but now organizing layouts can be so much more simple, accurate, and cost effective.
One step on this tile can tell retailers everything they need to know: Prototype on Tinkercad

Figure 4.1 // Image by Daniel Fung on Tinkercad // Overview of Prototype
To fix the inaccuracies with infrared people counting sensors I used two piezo tiles that are connected in parallel. Now the piezos on Tinkercad are designed for sound output rather than the current output that we need. I represented the tiles as function generators that produced the output current we need that feeds to the Arduino Uno.

Figure 4.2 // Image by Daniel Fung on Tinkercad // Function Generator Settings
I set the function generators settings as:
→ Frequency: 3.50 Hz
→ Amplitude: 2.00 V
→ DC Offset: Value must be higher than 0 V, change up or down to represent footsteps. If the value is higher than the predetermined footstep value, it will account for multiple individuals.
→ Function: Sine

Figure 4.3 // Image by Daniel Fung on Tinkercad // Connecting Function Generators to Arduino Uno
Then connected Function Generator #1’s positive terminal to the Arduino’s A0 while the negative connected to GND.
Similarly to Function Generator #1, connect Function Generator #2’s positive terminal to the Arduino’s A1 while negative connected to same GND as Function Generator #1.

Figure 4.4 // Image by Daniel Fung on Tinkercad // Connecting 10 kΩ Resistors to Arduino Uno
To ensure that the Arduino isn’t being fed currents that may damage the board, I placed a 10 kΩ resistor with each Function Generator. Connecting the resistors are the same as connecting the Function Generators.
Resistor #1 → Positive Term 1 to A0, Negative Term 2 to GND
Resistor #2 → Postive Term 1 to A1, Negative Term 2 to GND
Now for the actual code. I wanted the code to match all of the following criteria so that it can work with actual piezos and solve the inaccuracies in traditional PCS models.
- Two Tile Direction Detection for IN/OUT
- The system must read each tile independently, Tile A/ Tile B
- Whatever tile reads the higher voltage will be considered first tile stepped on. This isn’t the case in real life, but this is the only way it can work in the CAD demonstration.
If → Then Statements must follow:
- Tile A → Tile B = IN
- Tile B → Tile A = OUT
2. Simple Counting System
- The system tracks total IN count
- The system tracks total OUT count
3. Dwell Time — How long someone stays on a tile
- When a person activates the first tile: System starts a timer
- When the person activates the second tile: Timer stops
- Dwell time is printed in seconds
4. Group Detection — Identify how much people are within a cluster
- Determine an estimate output for one footstep
- Analysis of estimate: Total Output/Estimated Output for One Footstep = Number of People in Cluster
Final Code with Criteria:
// Tiles
int tileA = A0;
int tileB = A1;

// Baseline voltages
int baselineA = 100; // idle voltage for tile A
int baselineB = 100; // idle voltage for tile B

// Threshold above baseline to detect a footstep
int threshold = 150;

// Counters
int totalIn = 0;
int totalOut = 0;

// Track event state
bool eventActive = false;
unsigned long startTime = 0;
char firstTile = ' ';

void setup() {
  Serial.begin(9600);
  Serial.println("People Counting Sensor Starting");
}

void loop() {
  // Read analog values and adjust for baseline
  int valA = analogRead(tileA) - baselineA;
  int valB = analogRead(tileB) - baselineB;
  if (valA < 0) valA = 0;
  if (valB < 0) valB = 0;

  // Check if either tile is active (above threshold)
  bool activeA = valA > threshold;
  bool activeB = valB > threshold;

  // Start event when one tile is pressed
  if (!eventActive && (activeA || activeB)) {
    eventActive = true;
    startTime = millis();

    // Decide which tile is first by higher voltage
    if (valA >= valB) firstTile = 'A';
    else firstTile = 'B';
  }

  // Event is ongoing: wait for the other tile to be pressed
  if (eventActive) {
    if (firstTile == 'A' && activeB) {
      // ENTER: first = A, second = B
      totalIn++;
      float dwellSec = (millis() - startTime) / 1000.0;
      Serial.print("IN | Dwell: "); Serial.print(dwellSec); Serial.print(" s | ");
      Serial.print("Total IN: "); Serial.print(totalIn); Serial.print(" | Total OUT: "); Serial.println(totalOut);
      eventActive = false;
      firstTile = ' ';
    } else if (firstTile == 'B' && activeA) {
      // EXIT: first = B, second = A
      totalOut++;
      float dwellSec = (millis() - startTime) / 1000.0;
      Serial.print("OUT | Dwell: "); Serial.print(dwellSec); Serial.print(" s | ");
      Serial.print("Total IN: "); Serial.print(totalIn); Serial.print(" | Total OUT: "); Serial.println(totalOut);
      eventActive = false;
      firstTile = ' ';
    }
  }

  // Reset event if both tiles go back below threshold without completing sequence
  if (eventActive && !activeA && !activeB) {
    eventActive = false;
    firstTile = ' ';
  }

  delay(200); // small delay for stability
}
Real World Implementation + Use Cases
Outside of data collection this tile can be used for so many applications. In industries that is fueled by maximizing profit, this tile can fill in those gaps where there is a lack of data. Let’s go through some industries that can potential need this technology in the near future.
1. Retail Stores & Shopping Malls
- Track customer flow patterns
- Optimize store layouts
- Identify high traffic product zones
- Determine peak hours where there is more customers
2. Public Transportation Hubs
- Subway entrances
- Airport gates
- Give insight on congestion
- Peak rush hour intensity
3. Stadiums, Arenas, and Event Venues
- Manage crowd safety through monitoring clusters at a certain area
- Track which entrances have heavy traffic
- Calculate real time occupancy for security
5. Schools & Universities
- Monitor hallway traffic to reduce congestion
- Count students entering events
6. Theme Parks & Attractions
- Measure line lengths effectively
- Track ride popularity
- Detect movement flow across different rides
7. Smart City Infrastructure
- Crosswalks — Public data helping with planning infrastructure
- Public facility usage like washrooms and community centres
- Parking tracking
8. Healthcare Facilities
- Track patient and visitor flow
- Monitor crowding in waiting rooms
Final Thoughts
This piezo tile integrated with data collection demonstrates how simple hardware can be transformed into a powerful analytical tool we can use to our leverage. By focusing on what is beneath our feet rather than external tools like mobile devices or cameras, the tile keeps accuracy, preserves customer privacy, and keeps maintenance costs low.
This prototype has a lot of potential especially with the gaps in data collect. Scalability is a key highlight of its potential; while a single tile can monitor small movements, a network of these tiles can provide full insight of movements throughout the building. This opens the door to applications in retail malls, transportation hubs, schools, events, and city infrastructure. As more and more tiles are added, the system becomes smarter, more adaptive, and more valuable for decision making. At the end of the day, we must realize that the ground beneath us is becoming a source of knowledge — not just something we walk on.
Hey! My name is Daniel and I’m a 15 year old TKS innovator interested in Mechanical Engineering! I love building and designing different possible solutions to problems we have. In the future, I hope to become an entrepreneur and start a business from inventions I make in my engineering background. If you found this interesting and have questions, don’t hesitate to reach out to me at danielfung0529@gmail.com. Thank you for reading and hope you enjoyed it!
Words Cited:
Staff, Shopify. “Retail Foot Traffic Data: Use Cases & How to Collect (2025) — Shopify Canada.” Shopify, 7 May 2025, www.shopify.com/ca/retail/retail-foot-traffic-data.
Kadysewski. “IKEA In-Store Wayfinding Strategy Explained.” Fixtures Close Up, 10 June 2021, www.fixturescloseup.com/2019/02/04/ikea-wayfinding-strategy/.
Mavroudis, Vasilios. Heatmap Generated by Walkbase Tracking Product …, July 2018, www.researchgate.net/figure/Heatmap-generated-by-Walkbase-tracking-product-showing-customer-movement-in-a-retail_fig1_325433910.
Lutz, Ashley. “12 Sneaky Ways That Big Retailers Track Your Every Move.” Business Insider, Business Insider, 1 Jan. 2013, www.businessinsider.com/retail-tracking-2012-12.
메타데이터
- post_id
- ef2d1ab9643d
- slug
- the-floor-tile-that-knows-your-customers-better-than-you-do-using-just-a-step-ef2d1ab9643d
- url
- https://medium.com/@daniel-fung/the-floor-tile-that-knows-your-customers-better-than-you-do-using-just-a-step-ef2d1ab9643d
- canonical_url
- https://medium.com/@daniel-fung/the-floor-tile-that-knows-your-customers-better-than-you-do-using-just-a-step-ef2d1ab9643d
- author_url
- https://medium.com/@daniel-fung
- status
- ok
- fetched_at
- 2026-08-07 09:22:55