Market Regime Detection: Identifying Bull, Bear and High-Volatility Environments
Financial markets do not behave the same way all the time. A strategy that performs exceptionally well during a strong bull market can…
Market Regime Detection: Identifying Bull, Bear and High-Volatility Environments
Financial markets do not behave the same way all the time. A strategy that performs exceptionally well during a strong bull market can struggle when volatility rises.

Momentum models that benefit from persistent trends may suddenly experience repeated false signals during sideways markets. Defensive strategies that protect capital during bear markets may lag significantly when equities enter a powerful expansion.
This changing market behavior is why market regime detection has become an important area of research for quantitative investors, institutional portfolio managers, hedge funds, family offices, and systematic traders.
Instead of assuming that one investment model should operate identically under every condition, market regime detection attempts to answer a more fundamental question:
What type of market environment are we currently experiencing?
The answer can influence asset allocation, equity exposure, hedging, position sizing, volatility targets, sector selection, and risk limits.
A market may broadly operate as a bull regime, bear regime, sideways regime, low-volatility environment, high-volatility environment, inflationary regime, recessionary regime, or liquidity-driven transition.
The challenge is identifying those changes early enough for investors to act without reacting to every short-term fluctuation.
What Is Market Regime Detection?
Market regime detection is the process of identifying distinct financial-market environments based on measurable changes in price behavior, volatility, economic conditions, liquidity, correlations, interest rates, credit markets, or investor positioning.
The basic idea is simple.
Markets move through different states.
During one state, equities may trend consistently higher with low volatility.
During another, prices may decline while volatility rises.
During a third, markets may fluctuate sharply without establishing a clear directional trend.
A regime-detection framework attempts to classify these environments.
For example, a simplified model could define three regimes:
Bull market.
Bear market.
High-volatility or transitional market.
More sophisticated regime models may include five, seven, or even more market states.
The objective is not necessarily to predict the exact future.
It is to determine which market behavior is currently most probable and adjust portfolio decisions accordingly.
Why Market Regimes Matter for Investors
Many traditional investment models assume that historical relationships remain relatively stable.
Real markets rarely behave that way.
Correlations change.
Volatility changes.
Interest-rate sensitivity changes.
Market leadership changes.
Investor psychology changes.
Liquidity conditions change.
A portfolio optimized for one environment can therefore become poorly positioned when the regime changes.
This is particularly important for institutional investors.
Portfolio managers are not only concerned with return.
They also need to manage volatility, drawdowns, liquidity, correlation, leverage, and risk budgets.
Recognizing a transition from a stable bull market into a higher-risk environment can therefore be extremely valuable.
The Three Core Market Regimes
Although markets can be divided into many categories, three broad environments provide a useful starting point.
Bull Market Regime
A bull regime generally features rising equity prices, improving or stable earnings expectations, healthy market breadth, supportive liquidity, relatively contained volatility, and positive investor risk appetite.
Not every day is positive.
Corrections still occur.
However, the broader trend remains upward.
Bear Market Regime
A bear regime generally involves sustained downward price trends, weakening earnings expectations, tighter financial conditions, deteriorating breadth, rising credit stress, and increased investor risk aversion.
Bear regimes can develop gradually or suddenly.
High-Volatility Regime
A high-volatility environment may occur within either a bull or bear market.
Large daily price swings become common.
Correlations between assets may change rapidly.
Liquidity can deteriorate.
Traditional technical signals may produce more false breakouts.
This regime is especially important because risk can increase substantially even if the longer-term market trend has not yet changed.
Bull Market Regime Characteristics
Bull markets typically contain several identifiable features.
Price momentum remains positive.
Major indices trade above important long-term moving averages.
Market breadth is healthy.
Credit conditions remain relatively stable.
Volatility stays contained.
Investors generally favor risk assets.
Corporate earnings expectations improve.
Liquidity is supportive.
However, bull markets can contain temporary corrections.
This creates an important distinction between a correction and a full regime change.
A 5% or 10% decline does not automatically mean that a bear market has begun.
The broader structure matters.
Bear Market Regime Characteristics
Bear markets often show a very different combination of signals.
Long-term price trends weaken.
Stocks fall below major trend measures.
More securities begin making new lows.
Credit spreads widen.
Volatility increases.
Earnings expectations decline.
Defensive sectors may outperform.
Liquidity conditions become less favorable.
Investor sentiment deteriorates.
A robust market regime detection model attempts to recognize these changes as a group rather than relying on a single indicator.
That reduces the risk of reacting to temporary market noise.
High-Volatility Regimes Are Different From Bear Markets
One of the most important concepts in regime analysis is that high volatility and bearish direction are not identical.
Markets can experience extremely high volatility while ultimately remaining within a broader bull trend.
Similarly, a bear market can sometimes decline gradually without an immediate volatility explosion.
This distinction matters for portfolio construction.
A volatility-sensitive strategy may reduce position size even if its directional view remains bullish.
A trend model might remain invested but operate with tighter risk limits.
Therefore, sophisticated regime models frequently classify both direction and volatility.
Why Traditional Buy-and-Hold Models Ignore Regimes
A passive buy-and-hold strategy normally remains invested regardless of regime.
That simplicity has important advantages.
Investors avoid repeated timing decisions.
They remain exposed to long-term market growth.
They cannot miss a recovery because they never exit.
However, passive portfolios also experience the full impact of major bear markets.
Regime-based investing takes a different approach.
Instead of maintaining identical exposure through every environment, the portfolio may adjust according to the estimated level of market risk.
The objective is often not perfect prediction.
It is improved risk management.
Market Regime Detection vs Market Timing
Market regime detection and market timing are closely related, but they are not exactly the same.
Traditional market timing often asks:
Should I buy or sell today?
Regime detection asks:
What type of environment are we operating in?
The second question may be more useful for institutional portfolio management.
If the system identifies a low-volatility bull regime, equity exposure might remain high.
If it identifies a deteriorating transitional regime, exposure might be gradually reduced.
If a confirmed bear regime develops, defensive positioning may increase.
The resulting decisions can be slower and more systematic than short-term trading.
Trend as a Market Regime Signal
Price trend is one of the simplest ways to identify a market regime.
If the S&P 500 remains above a long-term moving average and the moving average is rising, the environment may be classified as bullish.
If the index remains below a falling long-term average, the environment may be classified as bearish.
This approach is simple, transparent, and easy to test.
Why Trend Models Can Work
Large market cycles often persist.
Bull markets can continue for years.
Bear markets can continue for months.
Trend models attempt to capture that persistence.
However, they also have weaknesses.
They are inherently backward-looking.
A trend model will rarely identify the exact market top.
Instead, it waits for enough price deterioration to confirm that conditions have changed.
The benefit is fewer premature bearish signals.
The cost is delayed entry and exit.
Moving Averages and Bull Bear Signals
Moving averages remain among the most widely used bull bear signals.
Common measures include:
50-day moving average.
100-day moving average.
200-day moving average.
A market trading above all three may indicate positive trend structure.
A market falling below them may indicate increasing weakness.
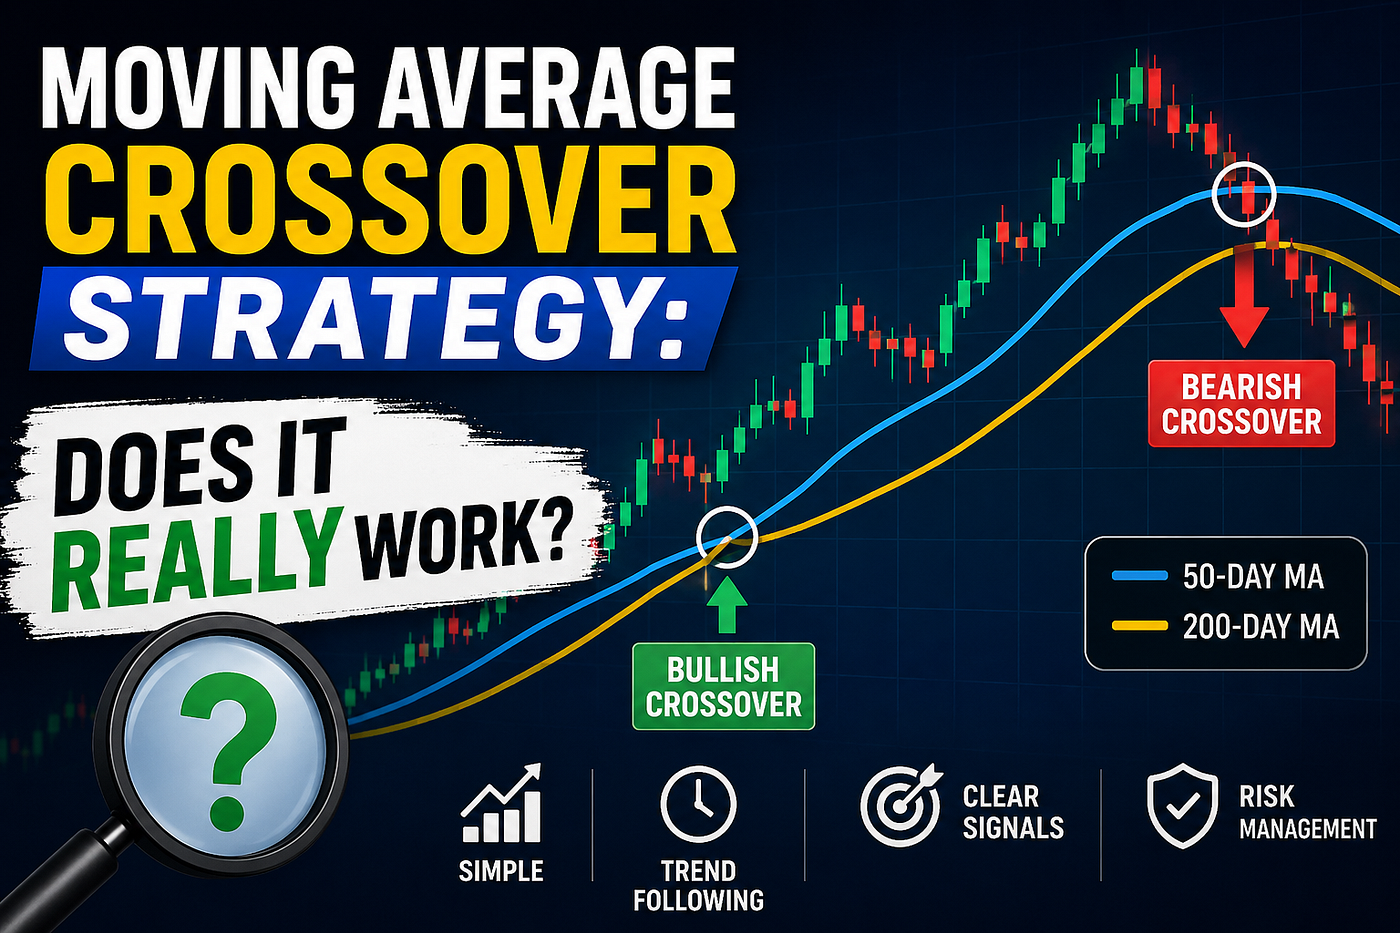
Crossovers can also provide regime information.
For example, when a shorter moving average falls below a longer moving average, it may indicate deteriorating momentum.
However, moving averages should not be viewed as perfect forecasting tools.
Sideways markets can generate repeated false signals.
This is why multi-factor regime models often perform more consistently than one-indicator approaches.
Volatility as a Regime Indicator
Volatility is one of the most powerful regime variables.
Markets behave differently when volatility is low compared with when it is high.
During low-volatility environments:
Position sizes can often be larger.
Price trends may develop more smoothly.
Risk appetite may remain elevated.
Correlations can remain relatively stable.
During high-volatility regimes:
Price swings become larger.
Stop losses may be triggered more frequently.
Portfolio correlations can increase.
Liquidity may decrease.
Leverage becomes more dangerous.
Therefore, institutional portfolios frequently incorporate realized and implied volatility into their regime models.
Using the VIX in Market Regime Detection
The VIX can provide useful information about expected S&P 500 volatility.
Low VIX environments often accompany relatively calm equity markets.
Rapid VIX increases can indicate rising uncertainty.
Exceptionally high readings can occur during financial stress or panic.
However, the VIX should not be interpreted mechanically.
A low VIX does not guarantee that risk is low.
A high VIX does not guarantee that a bottom has formed.
Instead, the direction and persistence of volatility can help identify whether the market environment is changing.
Market Breadth as a Regime Signal
Market breadth asks whether an index move is supported by a large number of stocks.
This can reveal information hidden by capitalization-weighted indices.
Suppose the S&P 500 continues rising.
At first glance, the market appears bullish.
But imagine that fewer and fewer stocks participate.
Only a small group of mega-cap companies continues moving higher.
That divergence may indicate weakening internal conditions.
Common breadth measures include:
Advance-decline lines.
New highs versus new lows.
Percentage of stocks above the 50-day moving average.
Percentage above the 200-day moving average.
Sector participation.
Equal-weighted index performance.
Healthy breadth generally strengthens a bullish regime signal.
Weakening breadth can signal deterioration.
Credit Markets and Regime Changes
Credit markets can provide some of the earliest signs of financial stress.
When investors become concerned about corporate default risk, they demand higher yields to own lower-quality bonds.
Credit spreads widen.
This can indicate tighter financial conditions even before equity indices experience major declines.
A comprehensive market regime detection framework can therefore include credit spreads alongside equity signals.
For example:
Rising equities + stable credit = constructive regime.
Rising equities + widening credit = potential warning.
Falling equities + widening credit = higher-risk regime.
Falling equities + improving credit = possible stabilization.
Cross-market confirmation can improve regime classification.
Interest Rates and Monetary Policy
Monetary policy strongly influences financial conditions.
Falling interest rates can support economic activity and asset valuations.
Rising rates can increase financing costs and place pressure on highly valued assets.
But the relationship is not always straightforward.
Stocks can rise while interest rates are increasing if earnings growth remains strong.
Therefore, the direction of rates should be studied alongside inflation, growth, credit conditions, and liquidity.
The most important issue may be whether monetary conditions are becoming more or less restrictive than markets previously expected.
Liquidity as a Market Regime Variable
Liquidity is one of the most important but frequently underestimated drivers of market behavior.
When financial liquidity is abundant, investors may become more willing to own risk assets.
Valuations can expand.
Credit conditions can improve.
Volatility may decrease.
When liquidity tightens, these relationships can reverse.
Institutional regime models may therefore monitor variables such as:
Central-bank policy.
Money-market conditions.
Credit availability.
Funding stress.
Yield curves.
Real interest rates.
Financial-condition indices.
Liquidity does not determine every market movement, but it can strongly influence the broader regime.
Economic Growth and Regime Models
Economic conditions also help define market environments.
A growing economy with improving corporate profits typically supports equities.
A weakening economy can create a more difficult environment.
However, stock markets are forward-looking.
Markets can decline before a recession begins.
They can also recover before economic data improves.
Therefore, regime models often favor leading economic indicators rather than lagging ones.
Potential inputs include:
Manufacturing surveys.
Consumer expectations.
Employment trends.
Corporate earnings revisions.
Housing activity.
Credit creation.
Yield curves.
Business investment.
The objective is to determine whether the economic cycle is accelerating or decelerating.
Inflation Regimes
Inflation can create another layer of market classification.
A low-inflation growth environment may favor equities and longer-duration assets.
A high-inflation environment can produce very different behavior.
Interest rates may rise.
Bond prices may fall.
Equity valuations may compress.
Commodity-related sectors may outperform.
This means a sophisticated model may classify markets across both growth and inflation dimensions.
For example:
Rising growth + falling inflation.
Rising growth + rising inflation.
Falling growth + rising inflation.
Falling growth + falling inflation.
Each environment can have different implications for asset allocation.
Hidden Markov Models for Market Regime Detection
Quantitative investors often use statistical models to identify regimes.
One commonly discussed framework is the Hidden Markov Model, or HMM.
An HMM assumes that the market operates in hidden states that cannot be directly observed.
Instead, investors observe variables such as returns and volatility.
The model then estimates the probability that the market is currently in one state or another.
For example, an HMM might identify:
Low-volatility bull regime.
High-volatility bear regime.
Transitional regime.
Unlike simple threshold models, probabilistic models recognize uncertainty.
Instead of declaring that the market is definitely bearish, the system might estimate a 70% probability of a bearish regime.
That approach fits naturally with professional portfolio management.
Markov-Switching Models
Markov-switching models are another method used in regime research.
These models allow market behavior to change between different statistical states.
For example, average return and volatility may differ significantly between regimes.
A low-volatility state may have positive expected returns.
A high-volatility state may have lower or negative expected returns.
The model estimates when transitions between those states are likely to have occurred.
The advantage is flexibility.
The disadvantage is model risk.
Results can depend heavily on the variables, assumptions, and historical period used.
Machine Learning and Regime Detection
Machine learning has expanded the range of possible regime models.
Instead of relying on one or two variables, machine-learning systems can analyze many features simultaneously.
Potential inputs may include:
Price momentum.
Volatility.
Volume.
Options activity.
Credit spreads.
Interest rates.
Yield curves.
Economic indicators.
Currency movements.
Commodity prices.
Market breadth.
Sentiment measures.
Alternative data.
The model can search for combinations of conditions that historically corresponded with different market environments.
However, more complexity does not automatically produce better forecasts.
The Danger of Overfitting Regime Models
Overfitting is one of the biggest risks in quantitative market research.
A model may perform exceptionally well on historical data because it has effectively memorized the past.
When exposed to new data, its performance collapses.
This is especially dangerous with market regime detection because historical regimes are relatively limited.
There have only been a finite number of major recessions, crashes, inflation shocks, and financial crises.
Researchers should therefore emphasize robustness.
Useful testing techniques include:
Out-of-sample testing.
Walk-forward analysis.
Parameter stability tests.
Cross-market validation.
Transaction-cost assumptions.
Stress testing.
Sensitivity analysis.
Simple models that survive multiple tests may be more useful than extremely complex systems with perfect backtests.
Rule-Based Regime Models
Not every regime model needs artificial intelligence.
A transparent rule-based system may combine several indicators.
For example, a model might assess:
Long-term trend.
Market breadth.
Realized volatility.
Credit spreads.
Monetary conditions.
Each factor could receive a score.
The combined score would then determine whether the environment is bullish, neutral, defensive, or bearish.
The primary advantage is interpretability.
Portfolio managers can understand why the system changed its classification.
That is particularly important for institutional investment committees.
Multi-Factor Market Regime Detection
A stronger framework often combines independent categories.
Price
Is the long-term trend rising or falling?
Breadth
How many stocks participate in the move?
Volatility
Is market uncertainty increasing?
Credit
Are financing conditions improving or deteriorating?
Liquidity
Is monetary policy supportive or restrictive?
Economy
Are leading indicators accelerating or weakening?
Valuation
Is the market expensive or inexpensive relative to historical conditions?
No single category provides perfect information.
Together, they can create a broader market picture.
Bull Regime Example
Imagine the following environment:
The S&P 500 is above its rising 200-day moving average.
Market breadth is strong.
Credit spreads are stable.
Volatility remains moderate.
Earnings revisions are positive.
Liquidity conditions are supportive.
Economic leading indicators remain constructive.
A regime model could classify this as a high-confidence bull environment.
The portfolio might maintain normal or above-normal equity exposure.
Bear Regime Example
Now consider a different environment.
The index falls below its long-term trend.
Breadth deteriorates sharply.
Credit spreads widen.
Volatility increases.
Corporate earnings expectations decline.
Liquidity tightens.
Economic indicators weaken.
No single signal guarantees a bear market.
However, simultaneous deterioration across several independent indicators creates a stronger bearish regime signal.
The portfolio might respond by reducing risk.
High-Volatility Transition Example
The most difficult environment is often the transition between regimes.
Imagine that equities remain near historical highs while:
Volatility starts rising.
Breadth weakens.
Credit spreads begin widening.
Interest-rate expectations change.
The long-term index trend remains technically bullish.
The market may not yet qualify as a bear regime.
But risk conditions have changed.
A portfolio manager could classify the environment as transitional or high volatility and reduce position sizes without completely exiting equities.
This illustrates why regime detection can be more useful than binary bull-versus-bear thinking.
Market Regime Detection and Position Sizing
One of the most practical uses of regime analysis is position sizing.
The model does not necessarily need to predict where the S&P 500 will trade next month.
Instead, it can answer:
How much risk should the portfolio take right now?
During a stable bull regime, the portfolio may accept normal exposure.
During a transitional regime, exposure can be reduced.
During extreme volatility, leverage can be lowered further.
This makes regime detection a risk-allocation framework.
Regime Models and Asset Allocation
Market regimes can also influence allocation between asset classes.
Different environments may favor different assets.
A growth-oriented bull regime might favor equities.
An inflationary environment may improve relative opportunities in certain commodities or value-oriented sectors.
A recessionary environment may increase interest in defensive assets.
However, asset relationships change over time.
Therefore, historical correlations should not be assumed to remain constant.
The regime itself can influence correlation.
Correlations Rise During Market Stress
Diversification sometimes becomes less effective during financial crises.
Assets that normally behave differently may suddenly decline together.
This happens because investors reduce risk broadly.
Margin calls can force liquidation.
Liquidity needs become more important than fundamental valuation.
Regime models can account for this behavior.
A portfolio manager who expects higher correlations during a stress regime may reduce overall leverage or increase truly defensive exposure.
Regime Detection for Institutional Portfolios
Institutional investors often have constraints that make regime analysis particularly valuable.
They may need to manage:
Maximum drawdowns.
Volatility targets.
Liquidity requirements.
Leverage limits.
Tracking error.
Risk budgets.
Regulatory requirements.
Regime detection can serve as an overlay rather than replacing the primary investment strategy.
An institution might maintain a strategic allocation while adjusting tactical risk according to market conditions.
Regime Detection for Quantitative Funds
Quantitative managers can use regimes to decide which models deserve more capital.
For example:
Momentum strategies may perform better during persistent trends.
Mean-reversion strategies may perform better during range-bound environments.
Volatility strategies respond differently during calm and stressed markets.
Carry strategies can become vulnerable during liquidity shocks.
Rather than running every strategy with identical weight at all times, a multi-strategy fund can adjust allocation depending on the detected regime.
The Problem of Regime Lag
Every regime model faces an unavoidable problem.
Confirmation requires data.
By the time enough evidence appears to confirm a bear regime, the market may already have declined substantially.
This is the trade-off between speed and reliability.
A fast model reacts quickly but produces more false signals.
A slower model produces fewer false signals but reacts later.
There is no perfect solution.
Model design depends on investor objectives.
False Bull and Bear Signals
Markets are noisy.
A sharp correction can temporarily resemble the beginning of a bear market.
A powerful rally inside a bear market can resemble the beginning of a bull market.
This creates false regime shifts.
Whipsaw is particularly common around major turning points.
Multi-factor confirmation can help reduce this problem.
For example, investors may require agreement between trend, breadth, credit, and volatility before significantly changing exposure.
Probabilistic Regime Detection
Markets rarely provide certainty.
Therefore, probability-based classification may be more realistic than binary labels.
A model could estimate:
65% probability of bull regime.
25% probability of transitional regime.
10% probability of bear regime.
If conditions deteriorate:
35% bull.
40% transition.
25% bear.
Portfolio exposure can respond gradually.
This reduces the need to make all-or-nothing decisions.
Market Regime Detection Is Not Perfect Forecasting
One of the biggest misconceptions is that regime detection should predict every market top and bottom.
That is not its primary purpose.
A regime model may identify the bear market only after prices begin declining.
It can still be useful if the decline continues.
Likewise, the model may identify a bull regime after the exact market bottom.
It can still capture a large part of the subsequent advance.
The objective is to participate in persistent environments while controlling risk during unfavorable ones.
Combining Regime Detection With Market Timing
Regime detection can form the foundation of a broader market-timing system.
The regime determines the strategic environment.
Shorter-term indicators help refine entry and exit timing.
For example:
Regime model = bullish.
Short-term signal = oversold.
The combination could support increasing exposure.
Alternatively:
Regime model = bearish.
Short-term signal = overbought rally.
The combination could indicate that risk remains elevated despite short-term strength.
This hierarchical approach can reduce conflicting signals.
How Institutions Can Use Bull Bear Signals
Professional portfolio managers rarely need a signal that simply says “buy” or “sell.”
They need signals connected to portfolio actions.
A regime framework might translate conditions into:
Normal risk.
Moderately reduced risk.
Defensive risk.
Capital-preservation mode.
Re-entry phase.
Each state can have predetermined portfolio rules.
This improves consistency and reduces emotional decision-making.
Risk Management Is the Real Objective
The strongest argument for market regime detection is not that it predicts the market perfectly.
It is that markets do not have constant risk.
A portfolio that ignores changing volatility, liquidity, credit conditions, and economic environments implicitly assumes that the same level of exposure is always appropriate.
That assumption may be unnecessarily rigid.
Regime-based portfolio management acknowledges that risk changes.
Exposure can change with it.
Building a Practical Market Regime Framework
A useful regime model should generally be understandable, measurable, repeatable, and testable.
Investors can begin with a small number of independent indicators.
Trend can measure direction.
Breadth can measure participation.
Volatility can measure instability.
Credit can measure financial stress.
Liquidity can measure monetary conditions.
Economic indicators can measure growth.
The system can then assign each component a score.
The objective is not to maximize historical performance at all costs.
The objective is to create a framework that behaves logically across different market cycles.
What Investors Should Avoid
Several mistakes can reduce the usefulness of regime analysis.
Do not change model rules every time performance weakens.
Do not optimize parameters excessively.
Do not assume historical relationships are permanent.
Do not use too many highly correlated indicators.
Do not confuse a backtest with a guaranteed future result.
Do not ignore transaction costs.
Do not treat every short-term correction as a new regime.
Most importantly, do not expect perfect prediction.
Market Regime Detection and the Future of Portfolio Management
The future of market regime research is likely to combine traditional investment indicators with increasingly sophisticated quantitative tools.
Machine learning can analyze more data.
Alternative datasets can provide additional information.
Real-time options markets can measure changing risk perception.
Credit and liquidity data can reveal financial stress.
Macroeconomic nowcasting can provide faster economic signals.
However, the fundamental problem remains unchanged.
Investors are attempting to determine whether the financial environment is becoming more or less favorable.
Technology improves the tools.
It does not eliminate uncertainty.
Final Thoughts: Identifying Bull, Bear and High-Volatility Environments
Financial markets constantly transition between different states.
Sometimes equities rise steadily under supportive economic and liquidity conditions.
Sometimes prices decline as earnings, credit, or monetary conditions deteriorate.
At other times, volatility increases sharply and the market becomes unstable without immediately establishing a clear long-term direction.
Understanding these differences is the foundation of market regime detection.
The most useful regime models do not search for a magical indicator.
They combine multiple sources of evidence.
Price reveals market direction.
Breadth reveals participation.
Volatility reveals uncertainty.
Credit reveals financial stress.
Liquidity reveals the monetary environment.
Economic indicators reveal the underlying business cycle.
Together, these factors can provide a more complete picture of market risk.
The central lesson for investors is that portfolio exposure does not necessarily need to remain identical across every environment.
A bull regime may justify normal risk.
A weakening regime may justify caution.
A high-volatility regime may require smaller position sizes.
A confirmed bear regime may justify stronger defensive measures.
When conditions improve, risk can gradually increase again.
This does not require predicting the exact market top or bottom.
It requires recognizing that probability and risk are changing.
For quantitative investors and portfolio managers, that distinction is crucial.
The objective of a professional regime framework should therefore be classification before prediction, probability before certainty, and risk management before speculation.
Markets will always remain uncertain.
But investors who understand whether they are operating inside a bull, bear, transitional, or high-volatility environment can make more informed decisions about how much risk they are willing to take.
For professional market timing research, quantitative market-cycle analysis, institutional signals, financial forecasts, and advanced market intelligence, visit:
메타데이터
- post_id
- ef32f3e4f09c
- slug
- market-regime-detection-identifying-bull-bear-and-high-volatility-environments-ef32f3e4f09c
- url
- https://medium.com/@fintechastrodunia1/market-regime-detection-identifying-bull-bear-and-high-volatility-environments-ef32f3e4f09c
- canonical_url
- https://medium.com/@fintechastrodunia1/market-regime-detection-identifying-bull-bear-and-high-volatility-environments-ef32f3e4f09c
- author_url
- https://medium.com/@fintechastrodunia1
- status
- ok
- fetched_at
- 2026-08-13 00:08:50