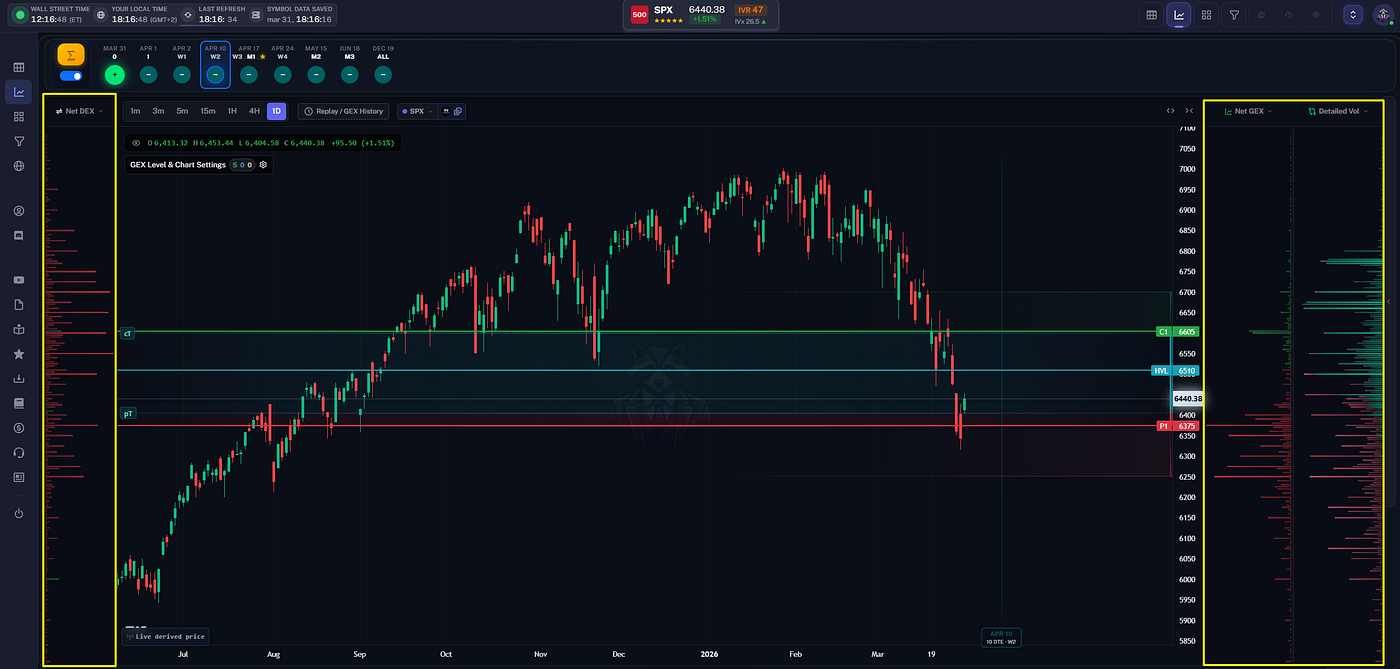
How to Read GEX Step by Step
A Practical Framework for Interpreting Gamma Exposure Without Turning It Into a Signal
How to Read GEX Step by Step
A Practical Framework for Interpreting Gamma Exposure Without Turning It Into a Signal
In the previous two articles of this series, we laid down the foundations of Gamma Exposure (GEX) and the mechanics behind dealer hedging. If you haven’t read them yet, it’s worth starting there:
But finally in this third part, we move from theory to application!
The goal of this article is not to teach you what GEX is, but how to read it correctly, step by step — without turning it into a prediction tool or a mechanical trading system.
Because that is where most traders go wrong.
🔶Before We Start: What GEX Is and What It Is Not
Before diving into steps, profiles, and examples, one thing must be made absolutely clear.
GEX levels are not signals. They do not tell you to buy or sell. They do not predict direction. They do not guarantee reactions.
GEX is built from objective options data, but its output is context, not instruction. What GEX actually does is much simpler and much more subtle.
It highlights:
- price areas where dealer hedging sensitivity may increase,
- zones where volatility characteristics may change,
- and regions where reactions become possible, not inevitable.
That distinction matters.
If you approach GEX looking for directional certainty, it will disappoint you. Otherwise, if you approach it as a structural framework, it can help you organize how you interpret price behavior and where you focus your attention without turning it into a signal.
��How TanukiTrade Uses GEX
At TanukiTrade, we work with GEX profiles every day across indices, single stocks, intraday setups, and swing structures. But even here, GEX is never used in isolation.
We do not treat profiles as trade triggers. We do not assume that levels must hold. And we never force trades just because a GEX wall exists.
Instead, GEX serves one purpose:
It defines the volatility regime and the structural backdrop in which price action unfolds.
Everything else — direction, execution, sizing — comes later. This article formalizes that approach into a clear, repeatable reading process.
🔶A Shared Vocabulary
Before we walk through the steps, we need a common language. These terms will be used throughout the article.
🔹 Put-dominated cluster A price area where Put GEX exceeds Call GEX, meaning put-side gamma is structurally dominant.
🔹Call-dominated cluster The opposite: Call GEX dominates Put GEX in that region.
🔹Walls Strikes or zones where gamma concentration is significantly higher than surrounding levels. These can exist on either the put or call side.
🔹Put support The strongest put-dominated wall below price.
🔹Call resistance The strongest call-dominated wall above price.
🔹HVL (High Volatility Level) A structural reference level separating volatility regimes: above HVL dealer hedging tends to suppress volatility, below HVL volatility expansion becomes more likely.
🔹 cTrans (Call Transition Level) A structural transition zone where call-side gamma begins to dominate, often marking the shift toward call-driven hedging dynamics.
🔹 pTrans (Put Transition Level) The opposite transition zone where put-side gamma becomes dominant, indicating increasing sensitivity to downside hedging flows.

Standalone AAPL GEX for 03/20/2026 expiration using TanukiTrade Options Overlay GRID System and the GEX Profile indicator
These labels describe structure, not behavior. A “support” level can break. A “resistance” level can accelerate price higher. The names are descriptive, not predictive.
🔶Standalone vs. Cumulative GEX
One detail matters more than most traders realize: GEX is always expiration-specific.
Gamma is not a “single market property” that exists independently from time. It’s embedded in options with a specific time to expiry, which means the GEX profile you’re looking at is only meaningful if you know which expiration(s) it represents.
At TanukiTrade we separate GEX into two calculation modes:
🔹Standalone GEX
Standalone GEX means:
Compute the gamma exposure for one specific expiration only, strike by strike.
So if you select SPX Friday expiration in standalone mode, you’re only seeing the GEX contributed by that single Friday chain. Nothing else.
This view is extremely useful when:
- you’re trading intraday and
- you want to isolate the expiration that has the most immediate hedging impact.
🔹Cumulative GEX
Cumulative GEX means:
Compute the gamma exposure for the selected expiration plus all earlier expirations leading up to it — aggregated together.
And here’s the key rule:
🔹Why 0DTE is excluded from cumulative calculation
We do not include 0DTE in the cumulative calculation. Because 0DTE gamma can be so extreme — especially in SPX — that it can distort the entire picture.
0DTE is like dropping a grenade into the dataset:
- gamma is massively compressed,
- charm effects are violent,
- dealer hedging sensitivity is immediate,
- and the profile can dominate everything else.
So instead of producing a “clean aggregated structure”, cumulative would become “whatever the 0DTE chain is doing right now.”
That’s why in our framework:
✅ Cumulative GEX = selected expiration + earlier expirations ❌ but excluding today’s 0DTE
🔹A Concrete Example (SPX on a Monday)
Let’s say today is Monday, and you’re looking at Friday’s expiration.
Standalone Friday GEX shows: only Friday’s chain.
Cumulative Friday GEX shows: everything from earlier expirations inside the same week aggregated into Friday Tuesday expiration Wednesday expiration, Thursday expiration, Friday expiration. But NOT Monday, because Monday is 0DTE — and excluding it keeps the cumulative structure stable and readable.

This also means an important identity:
Standalone is always “inside” cumulative. Cumulative = Standalone + previous standalones (excluding 0DTE).
🔹What This Means for 0DTE
For 0DTE, there is no such thing as cumulative. There is no “earlier expiration” to aggregate. So:
✅ 0DTE → Standalone only (by definition)
This is exactly what you see in the TanukiTrade GEX Matrix:

GEX Matrix for SPX
- Cumulative view in the middle
- Standalone view on the right
Now watch what happens row by row:
- Row 1 (0DTE): standalone and cumulative show the same NETGEX because cumulative cannot aggregate anything.
- Row 2 (the next expiration): standalone and cumulative still match because the only “earlier” thing would be 0DTE — and we exclude it.
- Row 3 and onward: now cumulative starts to diverge, cumulative for Expiration #3 = Standalone #2 + Standalone #3 (still excluding 0DTE)
From here forward, cumulative becomes a true stacked structure — and that’s the entire point of using it.
🔹The Practical Takeaway
If you remember only one thing: standalone tells you what one expiration is doing. Cumulative tells you what the structure looks like when you stack earlier expirations into that target expiration (excluding 0DTE).
And choosing the right one depends on your timeframe — which is exactly what we’ll do next in Step 1.
1️⃣Step 1: Choose the Correct Timeframe
Before interpreting any GEX level, zone, wall, or profile, one decision must be made correctly:
What timeframe am I trading?
This is not a minor setup choice. It determines which expiration’s GEX actually matters — and which one will actively mislead you.
🔹Why Timeframe Comes First
Gamma is time-sensitive by nature.
As expiration approaches:
- gamma concentrates,
- dealer hedging becomes more aggressive,
- and price reactions become faster and more mechanical.
Longer-dated options still matter — but they influence price behavior over days or weeks, not minutes. So asking “what does GEX say?” without first defining timeframe is like asking “What does the market want?” without specifying today or next month.
🔹Step 1a — 0DTE Index Trading (SPX)
If you are trading SPX 0DTE, the most relevant lens is typically the same-day expiration in standalone GEX because that’s where intraday gamma sensitivity is most concentrated.
In 0DTE trading: GEX is immediate, mechanical, and reactive.
This is where you can often observe pinning behavior, air pockets, faster intraday expansions, and sharp mean reversion — depending on flow and regime.
🔹Step 1b — Stock Day Trading
If you are day trading individual stocks, but not 0DTE options directly:
- The front expiration is usually the most relevant
- Use either Standalone or Cumulative GEX they are the same for that expiration
Why? Because:
- near-term gamma still influences intraday behavior,
- but 0DTE-style distortions are usually smaller than in SPX,
- and far-dated options won’t meaningfully hedge intraday moves.
🔹Step 1c — Swing Trading (Stocks)
If you are swing trading stocks (days to weeks): this is where many traders make their first major mistake. Looking only at the front expiration is often misleading.
For swing trading:
- use Cumulative GEX
- preferably Every Expiry, or
- an Optimal Monthly (45–60DTE) aggregation
Why? Because:
- swing trades live across multiple expirations,
- dealer exposure is distributed across the chain,
- and longer-dated gamma defines the structural backdrop.
In this context, cumulative GEX answers: “What is the dominant volatility regime and structural pressure over the life of my trade?”
🔹 AAPL — Cumulative vs Standalone GEX (Optimal Monthly)
To make this distinction concrete, let’s look at a real example using AAPL.
Below, we examine the Optimal Monthly expiration using two different GEX aggregation methods:
- Standalone GEX
- Cumulative GEX
Although the expiration date is the same, the resulting GEX profiles look materially different. Using the Options GEX Pro in TradingView you can select if you want to see cumulative or standalone GEX calculation shown below.

Below you will see the standalone GEX of Apple for Optimal Monthly Expiration.
📷 Image 1 — AAPL Optimal Monthly (Standalone GEX)
In the first image, we look at the same expiration, but calculated using standalone GEX. Here, only the options from the March 20 expiration are included. All earlier expirations are ignored.
The profile is noticeably lighter, more fragmented, and often shows weaker Net GEX values, because it reflects only a single slice of positioning.

Standalone AAPL GEX for 03/20/2026 expiration using TanukiTrade Options Overlay GRID System and the GEX Profile indicator
📷 Image 2 — AAPL Optimal Monthly (Cumulative GEX)
In the second image, you can see the cumulative GEX profile for AAPL’s March 20 optimal monthly expiration. This view aggregates:
- the selected expiration plus
- all prior expirations (excluding 0DTE if there is one)
As a result, the structure reflects broader, longer-term dealer exposure across the option chain.

Cumulative AAPL GEX for 03/20/2026 expiration using TanukiTrade Options Overlay GRID System and the GEX Profile indicator
As you can see, there is a big difference between the two selections.
Why This Difference Matters
The visual difference between these two profiles is not cosmetic — it’s structural.
- Cumulative GEX captures the full buildup of dealer exposure leading into that expiration
- Standalone GEX isolates only the marginal impact of that specific expiry
This is why, in most stock swing-trading contexts, cumulative GEX is usually the most appropriate starting point.
Swing trades often span multiple weeks, multiple expirations, and shifting dealer inventories. Looking only at standalone GEX in that context can significantly underestimate structural pressure.
You can also see the difference between the GEX Profiles using the TanukiTrade GEX Live on the WebApp.

Cumulative GEX profile for AAPL 03/20/2026 using GEX Live

Standalone GEX profile for AAPL 03/20/2026 using GEX Live
🔹Seeing This Even More Clearly in the GEX Matrix
This distinction becomes even more obvious when viewed through the TanukiTrade GEX Matrix focusing on the yellow box for 03/20/2026 expiration.
In the matrix: standalone values represent each expiration in isolation, while cumulative values stack exposure across expirations.

GEX Matrix for AAPL for swing traders
This is exactly what you would expect: cumulative GEX is, by definition, an aggregated measure of exposure, not a single-day snapshot.
🔹The Core Principle of Step 1
There is no “best” GEX view. There is only a timeframe-appropriate GEX view.

If you skip Step 1, everything that follows — HVL, walls, supports, resistances — becomes contextually incorrect.
👉 Only after Step 1 is done correctly does it make sense to ask:
- Are we above or below HVL?
- Is GEX positive or negative?
- Which zones actually matter?
And that’s exactly what we’ll do next in Step 2: Identify the Volatility Regime (HVL & Net GEX).
🔹 The Practical Takeaway — Don’t Overthink the Calculation
One of the main reasons we designed the cumulative GEX framework inside the TanukiTrade system was exactly this: traders shouldn’t need to constantly switch between calculation modes and second-guess which profile they should be looking at.
Cumulative GEX already integrates the relevant exposure across expirations and presents the structure in a way that reflects the real landscape.
In practice this means:
- For swing trading, cumulative aggregation naturally captures the broader structural context.
- For stock intraday trading, it still reflects the dominant near-term positioning.
- Even for SPX 0DTE, cumulative views remain aligned because the current expiration structurally dominates the profile.
👉 The goal is simplicity: keep the framework consistent, avoid unnecessary switching, and let the structure reveal itself automatically.
Once the timeframe is defined, you shouldn’t need to keep adjusting the aggregation logic.
2️⃣ Step 2: Identify the Volatility Regime
Once the correct timeframe and expiration context is selected, the next step is not finding entries, targets, or directions.
The next step is understanding what kind of market environment you are operating in.
This is where HVL (High Volatility Level) and Net GEX come into play.
Before asking what might happen, you first want to understand the environment the market may be operating in.
🔹 What HVL Actually Is and What It Is Not
HVL is a structural reference point derived from the GEX Profile. It separates two fundamentally different volatility regimes when the dealers are long gamma:
- Above HVL → volatility is structurally dampened
- Below HVL → volatility is allowed to expand
That’s it. HVL is not a buy signal, a sell signal a trend trigger.
It does not tell you direction. What it tells you is how aggressively the market is likely to respond once price starts moving.
🔹 Above HVL: Positive GEX Regime
When price trades above HVL, the market is typically in a positive Net GEX environment (primarily in indices). Structurally, this implies:
- dealers are more likely long gamma
- hedging activity works against price movement
Mechanically:
- price rises → dealers sell to hedge
- price falls → dealers buy to hedge
The usually result:
- volatility compression
- slower, grindy moves
- frequent mean reversion
- failed breakouts
- “sticky” price behavior around key levels
This is why positive GEX environments often feel calm, frustrating, and range-bound even when price trends slowly higher.
Important nuance: positive GEX does not mean bullish. It means the environment is more likely to suppress volatility.
🔹 Below HVL: Negative GEX Regime
When price trades below HVL, the market typically enters a negative Net GEX environment (primarily in indices). Here, the structure flips:
- dealers are more likely short gamma
- hedging activity works with price movement
Mechanically:
- price rises → dealers buy more
- price falls → dealers sell more
This can lead to:
- volatility expansion
- faster extensions
- momentum-driven moves
- cascading sell-offs or squeeze-type rallies
Negative GEX environments are where:
- levels break more easily
- reactions are sharper
Again, this does not tell you direction. It tells you how dangerous momentum becomes once it appears.

🔹 Example: Reading the Volatility Regime on a Real Chart
Here’s how this looks in practice. Below is an example of AAPL GEX Profile using the TanukiTrade Options Overlay and GEX Profile indicator.

AAPL GEX for 12/15/2028 expiration using TanukiTrade Options Overlay GRID System and the GEX Profile indicator
At the time of this snapshot:
- price is trading above the HVL
- Net GEX is positive
- call resistance is clearly defined above price
- put support is clearly defined below price
This gives us one structural read before thinking about direction:
The market is likely operating in a volatility-suppressing regime.
What does that actually mean in practice?
It means:
- sharp trend continuation is less likely without a catalyst
- momentum moves are more likely to stall or mean-revert
- reactions at levels tend to be slower and more controlled
At this point, we are not trading yet. We are simply defining the behavioral environment we are operating in.
🔹 Viewing the Volatility Regime on Webapp GEX Live
You can identify the volatility regime directly on TradingView using the GEX Profile indicator. However, the same structure can be easier to parse visually when viewed on GEX Live inside the TanukiTrade Webapp.

GEX profile for MSFT 03/20/2026 using GEX Live
On GEX Live:
- the current price is marked by a gray/white horizontal band,
- the position of price relative to HVL is immediately visible,
- dominant call resistance (CR) and put support (PS) levels are clearly labeled.
In this example:
- price is trading above HVL,
- the nearest call resistance is at 450,
- the strongest put support is at 400.
Compared to TradingView, GEX Live provides a much deeper structural view. Beyond the basic GEX profile, it also displays:
- Net GEX by strike
- Absolute GEX concentration
- Net Delta Exposure (DEX)
- Net volume and net open interest
- Detailed open interest distribution
- GEX by volume
This allows you to assess not just where the key levels are, but how strong and how asymmetric the underlying options positioning actually is.
Importantly, all of this still describes context, not direction. Even above HVL, sharp moves can occur if sentiment shifts suddenly — macro news, earnings, or risk events can always override structure.
🔹 Important Caveat: Regimes Are Conditional
All of the above assumes normal market conditions.
A positive GEX regime does not prevent:
- macro shocks
- earnings surprises
- geopolitical headlines
- sudden risk-on / risk-off transitions
In those moments:
- sentiment overrides structure
- dealer hedging becomes reactive
- GEX shifts from control framework to reference framework
That doesn’t make GEX useless, it changes how it should be used.
🔹 Why This Step Comes Before Walls and Levels
This is critical. Without first identifying the volatility regime:
- the same GEX level can look “wrong”
- reactions can feel inconsistent
- traders misinterpret strength or weakness
That’s not because GEX failed — it’s because the regime wasn’t defined first.
🔹 Index vs Stock Context Still Matters
One more important layer: in index products (SPX, SPY), positive GEX usually implies dealer long-gamma behavior. In single stocks, especially high-beta or retail-driven names, positioning can flip. That’s why a positive GEX zone in SPX often suppresses moves a positive GEX zone in a mania stock can accelerate moves. The regime tells you how to think, not what to trade.
🔹 The Core Takeaway of Step 2
Before asking:
- Will this level hold?
- Is this resistance strong?
- Should I fade or follow momentum?
You must first answer:
Are we in a volatility-suppressing or volatility-amplifying regime?
HVL and Net GEX might answer that question. Once you know the regime, GEX levels stop being confusing lines on a chart and start becoming behavioral reference zones. But always remember, no indicator, level or anything can tell you the future or violent sentiment change if that happens from outside influence, like geopolitics, etc.
GEX does not replace price action analysis. Think of it as the environmental layer. GEX defines how the market may react. Price action determines when and whether participation makes sense.

In Step 3, we’ll zoom into the structure itself identifying dominant call and put walls, understanding clusters, and learning how GEX zones define where reactions are most likely to occur — without turning them into false signals.
3️⃣ Step 3: Read the Structure — Walls, Clusters, and Reaction Zones
Once you’ve identified the correct timeframe (Step 1) and the volatility regime (Step 2), only then does it make sense to zoom into the internal structure of the GEX profile.
This is the step where most traders go wrong — not because the data is complex, but because they rush to interpret levels before understanding what those levels actually represent.
Step 3 is about answering one question:
Where is dealer hedging pressure most concentrated — and what kind of reaction does that concentration make possible?
Not guaranteed. Possible.
🔹 What GEX Walls Actually Are
A GEX wall is simply a strike (or tight strike cluster) where gamma exposure is meaningfully larger than surrounding strikes.

AAPL GEX for 12/15/2028 expiration using TanukiTrade Options Overlay GRID System and the GEX Profile indicator
There are two primary types:
- Call Wall A strike where call-side gamma dominates, the highest is labeled as call resistance
- Put Wall A strike where put-side gamma dominates, the highest value is labeled as put support
Important clarification:
A wall is not a prediction. It is a zone of heightened hedging sensitivity.
Dealers do not defend walls. They respond to price interacting with them.
🔹 Dominant Walls vs Minor Levels
Not all walls matter equally.
A dominant wall:
- stands out clearly from surrounding strikes,
- carries meaningfully higher absolute GEX,
- often aligns with Net GEX inflection points,
- tends to influence price behavior even before price reaches it.
Minor walls:
- may create local reactions,
- but rarely control broader structure,
- are often ignored unless aligned with momentum or regime.
This is why cluttered profiles are dangerous — they hide dominance.
🔹 Understanding Clusters (Not Single Strikes)
GEX is rarely concentrated at a single price.
Most of the time, exposure forms clusters:
- multiple adjacent strikes,
- all skewed toward calls or puts,
- acting together as a structural zone.
This is why treating GEX levels as exact-price lines leads to frustration.
A cluster answers: “If price enters this area, dealer hedging sensitivity increases.”
Not: “Price must reverse exactly here.”
🔹 Put-Dominated vs Call-Dominated Clusters
At any given price zone, one side usually dominates:
- Put-dominated cluster Put GEX > Call GEX → downside hedging sensitivity increases
- Call-dominated cluster Call GEX > Put GEX → upside hedging sensitivity increases
What matters is dominance, not labels.
The same cluster can:
- absorb price,
- accelerate price,
- or do nothing at all
depending on:
- volatility regime (Step 2),
- product type (index vs stock),
- and momentum on arrival.
🔹 Why Walls Are Reaction Zones, Not Trade Triggers
This is the key mental shift.
A GEX wall does not tell you:
- to go long,
- to go short,
- or to place an order.
It tells you:
- where to observe,
- where reactions become meaningful,
- where momentum confirmation matters most.
This is why we always say:
We don’t trade the level. We trade the reaction.
Price behavior at the wall matters more than the wall itself.
The following GEX Zone coloring sheet explains
Below is the GEX Zone Coloring Sheet, followed by a real AAPL example, to show how these abstract zones translate into actual market behavior.
🔹The GEX Zone Coloring Framework
The coloring is not cosmetic. Each zone reflects a different dealer hedging behavior and reaction probability.

Green Zone (Call-Dominated Area) This area contains only positive net GEX strikes, up to the main call resistance.
Red Zone (Put-Dominated Area) This area contains only negative net GEX strikes, down to the main put support.
Transition Zone (HVL Area) This is the most misunderstood region.
Here:
- Call and put GEX are mixed
- Net GEX shifts sign
- Dealer hedging behavior changes character
This is not a trade zone. It is a decision zone, where the market resolves whether it wants to behave like a positive or negative GEX environment. Chop, fake moves, and whipsaws are common here.
Squeeze Zones (Yellow Areas) These appear only when:
- There is another significant net GEX strike beyond the main wall
They signal:
- potential continuation zones (if momentum/flow confirms)
- Key decision points during strong momentum
- Places where dealer hedging may flip from damping to chasing
They are conditional, not always active.
🔹Translating the Framework into a Real Example (AAPL)
Now look at the AAPL chart.

AAPL GEX for 12/15/2028 expiration using TanukiTrade Options Overlay GRID System and the GEX Profile indicator
- Below 250 → pure negative net GEX Downside acceleration zone
- 250–252.5 → transition zone Mixed call/put structure, unstable behavior
- 252–280 → clean positive net GEX Volatility suppression, grinding price action
- Above 280 → positive squeeze zone Extension possible only if flow and momentum confirm
One critical detail: 👉 Always pay special attention near the HVL area.
The High Volatility Level marks a structural regime boundary. When price approaches or crosses HVL, dealer hedging behavior can shift — and with it, the character of volatility.
This does not imply direction. It means that volatility conditions can change rapidly, and reactions around this zone often carry higher informational value than reactions elsewhere.
What matters is not the exact number — it’s the structural hierarchy:
- Put-dominated → transition → call-dominated
- Acceleration → instability → compression
This is why we say:
GEX zones define where reactions are likely — not what the reaction will be.
🔹How GEX Fits Into a Broader Trading Framework
Reading GEX levels and profiles should always be a complementary layer not a standalone decision engine.
If you already use tools like pivot levels, Fibonacci retracements, classical support/resistance, or market structure, GEX is meant to be viewed alongside them not instead of them.
A positive GEX profile in AAPL does not tell you where price will go next. What it tells you is that the volatility regime is likely calmer, with dealer hedging more inclined to dampen moves rather than accelerate them (except when everyone is long call — dealer short gamma).
In contrast, a negative GEX environment often implies the opposite: retail demand for puts, dealers short gamma, and hedging that can amplify downside moves, often coinciding with faster, more volatile price action.
GEX does not replace your analysis. It contextualizes it by helping you understand how violently or calmly the market is likely to respond once price starts moving.
At this point, you should be able to:
- Visually separate call- and put-dominated areas
- Identify transition zones
- Understand why some areas feel “clean” and others chaotic
That sets us up for the next step.
4️⃣Step 4: Recognizing a “Messy” GEX Profile
Not every GEX profile is clean.
And this is one of the most important — yet rarely discussed — parts of reading GEX correctly.
Many traders assume that once GEX levels are plotted, they must contain a clear structure and a tradable edge. In reality, some profiles are structurally ambiguous, internally conflicting, or simply difficult to interpret.
Recognizing these situations early can save you from forcing trades where no structural clarity exists.
🔹 What Makes a GEX Profile “Messy”?
A clean profile usually shows a clear hierarchy:
- call resistance zones above price
- put support zones below price
- logical separation between positive and negative gamma regions
A messy profile, however, breaks this structure.
Typical signs include:
- call and put walls overlapping or alternating around price
- lack of clear dominance between positive and negative GEX clusters
- structural levels that contradict each other

IREN GEX for 01/21/2028 expiration using TanukiTrade Options Overlay GRID System and the GEX Profile indicator
In the IREN example the profile becomes difficult to interpret because:
👉 a 57.5 put wall appears above a 55 call wall, creating conflicting structural signals.
Instead of a clear directional hierarchy, the market shows fragmented positioning.
🔹 What a Messy Profile Actually Tells You
A messy GEX structure is not a failure of the indicator. It is information.
It usually suggests:
- positioning is dispersed across strikes
- dealer hedging pressure lacks a dominant direction
- market participants disagree structurally
In other words, the market itself may not have a clear structural bias.
And when structure is unclear, reactions become less reliable.
🔹 The Correct Response
When traders encounter messy profiles, they often try to “decode” them more aggressively adding more levels, more interpretations, more assumptions.
The better approach is often simpler:
- Accept that not every instrument offers clean structure.
- Reduce reliance on GEX when hierarchy is unclear.
- Or step back and reduce exposure to that instrument until structure improves.
Sometimes the most advanced read is recognizing that there is no clean read.
🔹 GEX Is a Context Tool — Not an Obligation
You are not required to trade every profile.
If the structure is unclear:
- skip it,
- switch timeframe,
- or rely more heavily on other analytical frameworks.
GEX works best when structure is simple, dominant, and readable.
And part of reading GEX correctly is knowing when not to use it.
🔶 The TanukiTrade GEX Reading Workflow
Reading GEX correctly is not about finding signals. It is about following a structured interpretation sequence:
1️⃣ Define the timeframe → choose standalone or cumulative GEX appropriately 2️⃣ Identify the volatility regime → HVL and Net GEX 3️⃣ Read structural hierarchy → dominant walls and clusters 4️⃣ Evaluate structural clarity → clean vs messy profile
Only after this process does price action analysis begin.
GEX does not simplify trading decisions. It structures interpretation.
Instead of asking: Where will price go?
You begin asking: How might the market behave once price starts moving and how it reacts at key zones?
That shift from prediction to structural awareness is the core benefit of the framework.
🔶 The Three Questions We Use Instead of Signals
When we read GEX, we’re not asking “buy or sell.”
We’re asking:
- What regime are we in? (HVL + Net GEX)
- Where does sensitivity concentrate? (walls + clusters)
- Is the structure even clean enough to respect? (messy vs readable)
If those three questions are answered, price action can become more structured to interpret, because you’re separating regime, structure, and confirmation.
🔶 What TanukiTrade Tools Are Designed to Do
TanukiTrade is not built to hand you directional calls.
Our tools are designed to make one thing easier: seeing the options-driven structure behind price.
We focus on context:
- volatility regime (compression vs expansion),
- hedging sensitivity zones,
- structural levels where reactions become more meaningful,
- and clarity signals — including when the profile is too messy to trust.
Directional decisions, execution, and risk management remain the responsibility of the trader.
Our job is to help you read the environment with less noise — so you stop confusing structure with certainty.
👉 GEX is not the trade. It’s the map.
🔶 One Rule to End With
If you take one rule from this series, make it this:
GEX does not tell you what will happen. It tells you where behavior can change.
Everything else comes from how price actually responds.
NEXT PART:
Previous parts:
Disclaimer This article is for educational and informational purposes only and is not investment advice, a recommendation, or a solicitation to buy or sell any security, derivative, or financial instrument. The content is not personalized to any individual’s circumstances, objectives, or risk tolerance.
Any charts, levels, examples, and product references are illustrative snapshots intended to explain a framework; they are not forecasts and should not be interpreted as trade instructions or signals. Options- and exposure-based metrics may rely on assumptions, estimation methods, and data that can be incomplete, delayed, or subject to revision.
Trading involves substantial risk, including the risk of loss. Past observations or examples do not guarantee future results. Always do your own research and consult a qualified professional where appropriate.
메타데이터
- post_id
- ef5cac01924a
- slug
- how-to-read-gex-step-by-step-ef5cac01924a
- url
- https://blog.tanukitrade.com/how-to-read-gex-step-by-step-ef5cac01924a
- canonical_url
- https://blog.tanukitrade.com/how-to-read-gex-step-by-step-ef5cac01924a
- author_url
- https://medium.com/@gerynagy
- status
- ok
- fetched_at
- 2026-06-13 12:55:53