How I Built a Tool That Writes Its Own Infrastructure — and Refuses to Deploy When It Shouldn’t
Most DevOps tasks ask you to configure infrastructure. This one asked me to build the tool that does it for you.
How I Built a Tool That Writes Its Own Infrastructure — and Refuses to Deploy When It Shouldn’t
Most DevOps tasks ask you to configure infrastructure. This one asked me to build the tool that does it for you.
SwiftDeploy is a declarative deployment CLI where manifest.yaml is the only file you ever touch. Everything else — nginx config, Docker Compose, container lifecycle — is generated from it. The grader deletes your generated files and reruns ./swiftdeploy init to verify they come back correctly. If your tool breaks, your stack breaks.
Across two stages, I built the engine, added Prometheus metrics, wired in an Open Policy Agent sidecar that gates every deploy and promotion, and built a live terminal dashboard that watches it all in real time.
This is the full story — the architecture, the bugs, the chaos, and what I’d do differently.
🔗 GitHub: github.com/MustaphaAgboola/swiftdeploy-project
The Problem With Writing Config Files By Hand
Most DevOps tutorials teach you to write a docker-compose.yml, an nginx.conf, maybe a Dockerfile — and call it done. But what happens when you need to change a port? Or a timeout? Or a deployment mode? You hunt through multiple files, edit them individually, and hope you didn't miss anything.
This is the story of building it across two stages, the bugs that nearly broke me, and what I learned about real production systems along the way.
Stage 4A: The Tool That Writes Itself
The core idea is simple: manifest.yaml is the single source of truth. The CLI reads it and renders Jinja2 templates into nginx.conf and docker-compose.yml. The grader deletes those generated files and re-runs ./swiftdeploy init to verify they regenerate correctly. If your templates are wrong, your stack is wrong.
Here’s what the manifest looks like:
yaml
services:
  image: swift-deploy-1-node:latest
  port: 3000
  mode: stable
  version: "1.0.0"
nginx:
image: nginx:latest
port: 8080
proxy_timeout: 30network:
name: swiftdeploy-net
driver_type: bridgeEvery value in nginx.conf and docker-compose.yml traces back to a field here. Change the port in the manifest, regenerate, redeploy — done.
The API service runs in two modes controlled by a single env var: MODE=stable or MODE=canary. Same image, different behaviour. Canary mode adds an X-Mode: canary header to every response and unlocks a /chaos endpoint for simulating degraded behaviour.
The CLI has five subcommands: init, validate, deploy, promote, and teardown. The most interesting is promote — it patches manifest.yaml in-place, re-renders only the compose file, and restarts the app container without touching nginx. That's a rolling restart with zero nginx downtime.
The Bug That Taught Me the Most: Middleware Order
FastAPI executes middleware in reverse registration order — the last middleware registered runs first. I had three middleware layers: metrics instrumentation, chaos injection, and mode header injection.
The problem: chaos middleware was generating 500 responses by returning early without calling call_next. That meant the response never passed through the metrics middleware. My error counters showed zero 500s even when chaos was actively breaking requests.
The fix was understanding the execution stack. For metrics to see every response — including chaos-induced failures — it needed to be the outermost layer. That meant registering it last in the code, so it runs first at runtime.
Registration order:    mode_header → chaos → metrics
Execution order:       metrics → chaos → mode_header
One line change. But understanding why it worked required understanding how ASGI middleware actually executes — something I wouldn’t have learned from a tutorial.
Stage 4B: The Eyes and the Brain
Stage 4A built the engine. Stage 4B added observability and policy enforcement.
The /metrics endpoint exposes five Prometheus metrics:
http_requests_total{method, path, status_code}
http_request_duration_seconds{method, path}
app_uptime_seconds
app_mode          # 0=stable, 1=canary
chaos_active      # 0=none, 1=slow, 2=error
These aren’t just numbers — they’re the inputs to the policy engine.
The Guardrails: Why OPA Changes Everything
The most important architectural decision in Stage 4B is one the task spec makes explicit: the CLI must not make any allow/deny decision itself. All decision logic lives exclusively in OPA.
Without OPA, you’d write something like this in Python:
python
if disk_free_gb < 10:
    print("Not enough disk")
    sys.exit(1)
That works. But now the threshold is hardcoded in your CLI. Changing it means editing Python, retesting, redeploying the tool. Every policy change is a code change.
With OPA, the threshold lives in a data file:
json
{
  "thresholds": {
    "min_disk_free_gb": 10.0,
    "max_cpu_load": 2.0,
    "max_error_rate_pct": 1.0,
    "max_p99_latency_ms": 500.0
  }
}
And the policy lives in a Rego file:
rego
package infrastructuredeny contains msg if {
input.disk_free_gb < data.thresholds.min_disk_free_gb
msg := sprintf("Disk free %.1fGB is below minimum %.1fGB",
[input.disk_free_gb, data.thresholds.min_disk_free_gb])
}The CLI collects data and asks OPA. OPA answers. The CLI acts on the answer. Changing the threshold is a one-line JSON edit — no Python touched, no CLI redeployed.
Isolation matters for another reason: the OPA container is only reachable on the internal Docker network. It’s never exposed through nginx. The CLI talks to it directly on port 8181. An external attacker hitting port 8080 has no path to the policy engine.
The Chaos: What Actually Happened
Once the stack was running in canary mode, I injected a 100% error rate:
bash
curl -X POST http://localhost:8080/chaos \
  -H "Content-Type: application/json" \
  -d '{"mode": "error", "rate": 1.0}'
Then tried to promote back to stable:
swiftdeploy promote → stablePre-promote canary safety check
› Scraping /metrics …
› Error rate: 27.27% | P99 latency: 5.0ms
[FAIL] Policy violation: Error rate 27.3% is above maximum 1.0%Blocked. OPA saw the error rate, evaluated it against the canary policy, and returned a denial. The CLI printed the reason and exited non-zero. The manifest was never patched.
The status dashboard made this visible in real time — refreshing every 5 seconds, showing policy compliance flipping from [PASS] to [FAIL] as chaos activated. Every scrape wrote a JSON line to history.jsonl. After stopping the dashboard, ./swiftdeploy audit parsed that file and generated a markdown report showing exactly when violations occurred and for how long.
Lessons Learned
If I were starting this from scratch, I’d learn the core concepts first before touching any code. I spent time debugging problems I would have avoided if I’d understood canary deployments and ASGI middleware execution before writing a single line.
The two things that most changed how I think about DevOps:
Canary deployment isn’t just about running two versions. It’s about having a controlled blast radius. You promote to canary, observe metrics, and only proceed if the numbers are healthy. SwiftDeploy makes this concrete — promote canary is gated by real error rate and latency data, not gut feel.
Chaos engineering isn’t about breaking things randomly. It’s about knowing your system’s failure modes before your users find them. Injecting a 50% error rate in a controlled environment and watching OPA block the promotion is far better than discovering that failure in production.
The biggest architectural insight: separating policy from code. When your deploy logic and your business rules live in the same file, changing one risks breaking the other. OPA enforces a clean boundary — the CLI knows how to deploy, OPA knows whether it should. Neither knows what the other knows.
The Architecture in One Diagram
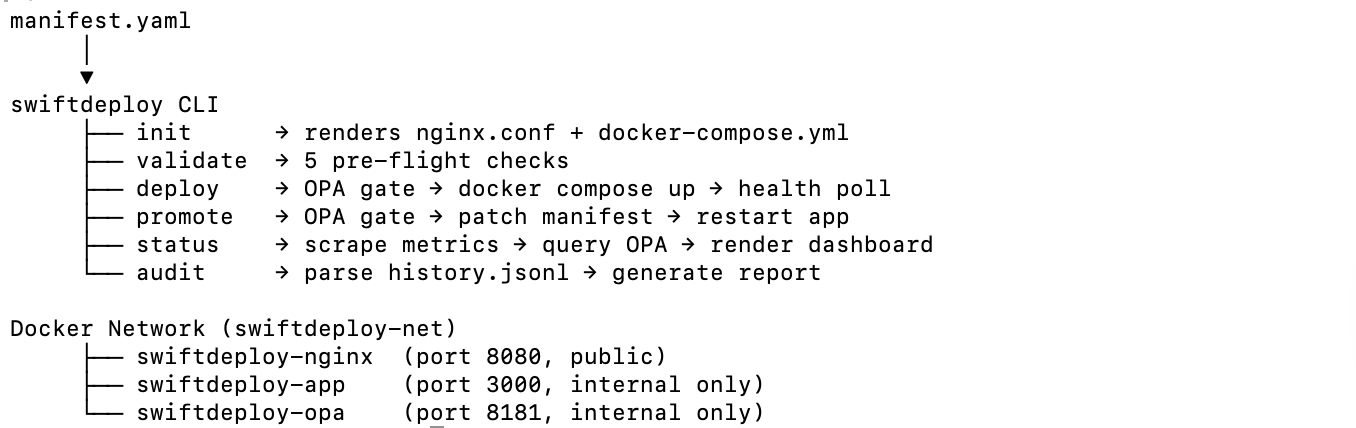
Architecture Diagram
메타데이터
- post_id
- efb74e60bcfb
- slug
- how-i-built-a-tool-that-writes-its-own-infrastructure-and-refuses-to-deploy-when-it-shouldnt-efb74e60bcfb
- url
- https://medium.com/@mustaphaagboola1_88104/how-i-built-a-tool-that-writes-its-own-infrastructure-and-refuses-to-deploy-when-it-shouldnt-efb74e60bcfb
- canonical_url
- https://medium.com/@mustaphaagboola1_88104/how-i-built-a-tool-that-writes-its-own-infrastructure-and-refuses-to-deploy-when-it-shouldnt-efb74e60bcfb
- author_url
- https://medium.com/@mustaphaagboola1_88104
- status
- ok
- fetched_at
- 2026-06-20 20:29:01


