Correlation vs Causation. The mistake every beginner makes reading data.
Correlation means two things move together. Causation means one is making the other happen. One line of Python finds correlation in…
Correlation vs Causation. The mistake every beginner makes reading data.
Correlation means two things move together. Causation means one is making the other happen. One line of Python finds correlation in seconds. Understanding whether it actually means anything takes much longer. Most tutorials skip that second part entirely.
This is the one concept that changed how I read data. Not because it is complicated but because nobody explained it clearly the first time.
What correlation actually is
When two variables move in the same direction that is correlation. One goes up, the other follows. One drops, the other drops with it. Python gives you a number between minus one and one. Close to one means they move together strongly. Close to zero means no real relationship.
That number is useful. But it only tells you how they move. It says nothing about why.
The ice cream example
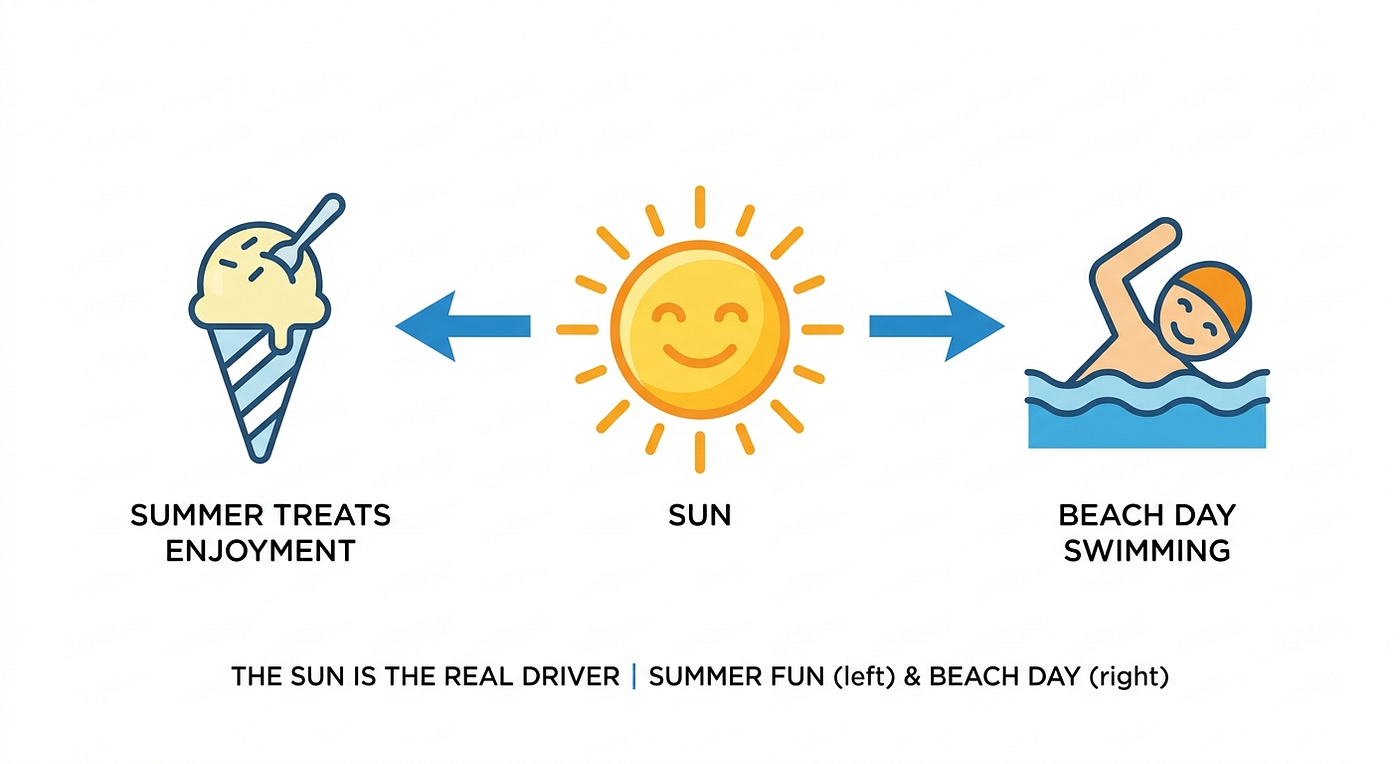
In summer, ice cream sales go up. Drowning cases also go up at the same time. Plot both on a chart and they move together almost perfectly.
But ice cream does not cause drowning. Hot weather does both. More heat means more people buying ice cream and more people swimming. Both trends are being pulled by a third thing that never appeared in the chart.
That hidden third thing is called a confounding variable. It sits behind two things that look connected and explains the real relationship.
Someone who only looked at the chart and acted on it would be solving the wrong problem entirely.
The AI example
Over the last few years two things happened at the same time. AI tools grew fast and the number of developer and tech jobs also grew. Put those two lines on a chart and they move together cleanly.
The easy conclusion is that AI created more jobs. But look at what else was happening during the same period. Companies were scaling aggressively. Cloud infrastructure was expanding. Software demand across every industry was already rising before AI became mainstream. Venture capital was flowing into tech at levels not seen before.
AI and job growth both rose because the conditions underneath them were already moving. They are correlated. But calling one the cause of the other without looking at what else was in the room is a mistake.
This matters because decisions get made on conclusions like this. Governments write policy. Companies shift hiring strategies. Investors move money. If the reading is wrong the decisions that follow are wrong too.

What I found in my own project
In my customer churn project, support calls had one of the strongest correlations with churn. More calls, more churn. Clear pattern in the heatmap.
My first read was straightforward. Customers who call support end up leaving. Maybe the experience is frustrating them into cancelling.
Then I asked the question the other way. What if unhappy customers were already planning to leave and calling support was just something they did on the way out. A symptom, not a cause.
That small shift changes everything. One reading says fix the support team. The other says find out why customers become unhappy before they ever pick up the phone. Same data. Two completely different directions. Only one leads somewhere useful.
Before you write any finding ask three things
Could a third variable be driving both. Could the direction be reversed, what looks like the cause might actually be the effect. Does this make logical sense beyond just the numbers.
If you cannot answer those three clearly you have a starting point for more questions. Not a conclusion.

The actual work
Finding correlation is one line of code. Understanding what it means takes sitting with the data, asking uncomfortable questions and being willing to say the pattern does not tell the full story yet.
That is the work most people skip. And it is the difference between analysis that misleads and analysis that actually helps someone make a better decision.
Part of the Raw Data to Insights series. Projects on GitHub & linkedin : https://www.linkedin.com/in/diinikahiye/
메타데이터
- post_id
- efe8cc6e1fd4
- slug
- correlation-vs-causation-the-mistake-every-beginner-makes-reading-data-efe8cc6e1fd4
- url
- https://medium.com/@diiniyare74/correlation-vs-causation-the-mistake-every-beginner-makes-reading-data-efe8cc6e1fd4
- canonical_url
- https://medium.com/@diiniyare74/correlation-vs-causation-the-mistake-every-beginner-makes-reading-data-efe8cc6e1fd4
- author_url
- https://medium.com/@diiniyare74
- status
- ok
- fetched_at
- 2026-07-17 06:47:26




