ClickStack: The Observability Stack That Makes Datadog Look Absurd at Scale
Lessons from rolling out ClickStack across 15 services — the architecture that makes it cheap, the deployment patterns that actually scale…
ClickStack: The Observability Stack That Makes Datadog Look Absurd at Scale
Lessons from rolling out ClickStack across 15 services — the architecture that makes it cheap, the deployment patterns that actually scale, and the honest tradeoffs nobody warns you about.
The Observability Bill That Started It
Most engineering teams hit the same wall, usually around the time someone on Finance prints out the Datadog quote and asks why it costs more than the team building the product.
The conversation goes the same way every time. “Why is it so expensive?” Because we’re ingesting a lot of telemetry. “Can we ingest less?” We could, but then we lose visibility. “Can we sample harder?” We already sample. “Is there an alternative?” Yes. “How much engineering work?” Pause.
That pause is where most teams give up and pay whatever the bill says. We didn’t — we evaluated the open-source alternatives before committing — and the answer turned out to be ClickStack: an open-source observability stack from ClickHouse that bundles HyperDX (the UI), ClickHouse (the storage and query engine), and a tuned OpenTelemetry Collector into a single deployable system. Launched in May 2025 after ClickHouse acquired HyperDX, it’s now in production at organizations ingesting billions of high-cardinality events per day.
I rolled this out across 15 internal services over the past few months. This post is the deep-dive I wish someone had handed me on day one: the architecture, the deployment lessons, and the comparison against Datadog (and the open-source alternatives) that I actually trust.
ClickHouse / HyperDX
What ClickStack Actually Is
ClickStack is three components glued together with strong defaults:
- OpenTelemetry Collector — a pre-configured OTel Collector that knows how to ingest logs, metrics, and traces over OTLP and write them to ClickHouse using batched, optimized inserts.
- ClickHouse — the high-performance columnar analytical database that stores everything. The same database powering analytics workloads at Uber, Cloudflare, eBay, and basically every company that’s hit “billions of events per day.”
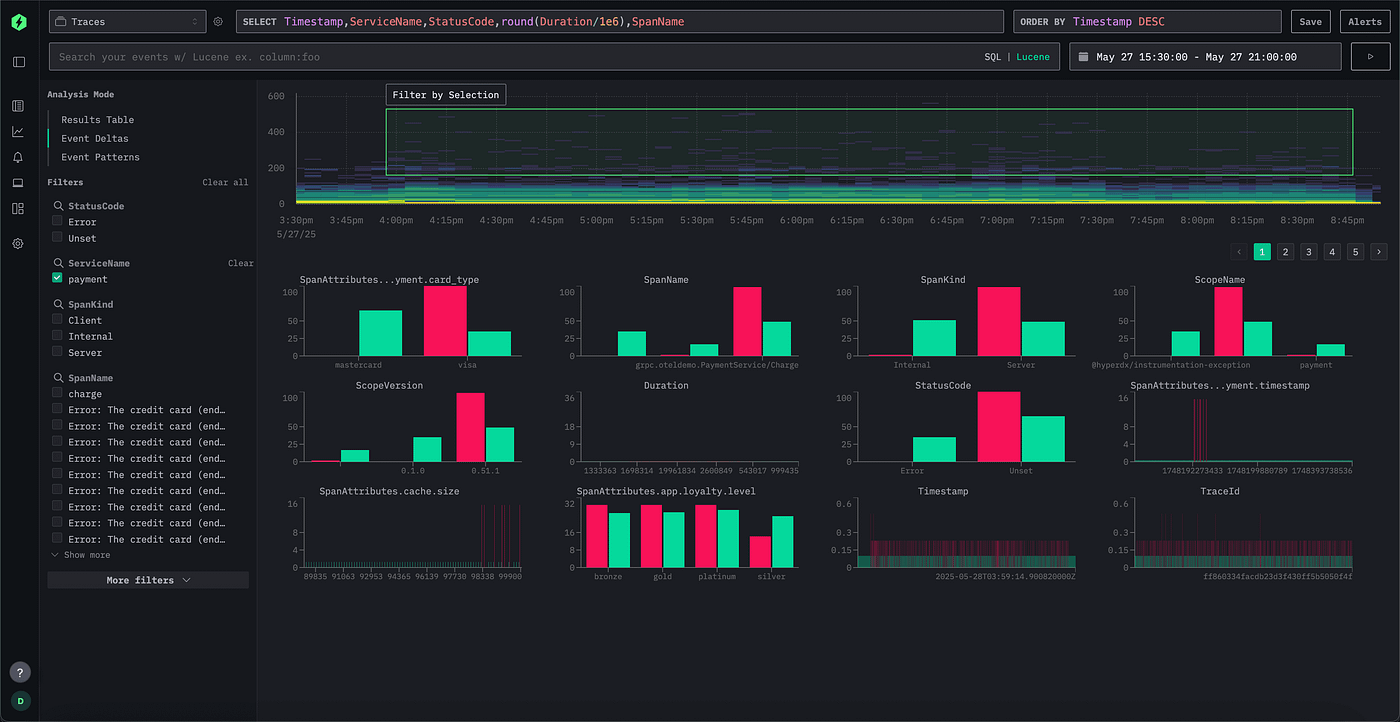
- HyperDX UI — a developer-focused observability interface that runs SQL and Lucene-style queries against ClickHouse, with built-in dashboards, alerting, trace exploration, and session replay.
The pitch is straightforward: OpenTelemetry-native ingestion, ClickHouse-level query performance, an engineer-friendly UI, all open source, deployable anywhere, with cost structures an order of magnitude cheaper than proprietary SaaS at scale.
But what makes it interesting isn’t any single component. It’s the architectural decision sitting underneath the whole thing: treating observability as an analytical workload, not a logging workload.

ClickStack architecture overview
The Architecture Bet: “Wide Events” on a Columnar Engine
Traditional observability platforms grew up around three separate signal types — logs (text), metrics (numbers), and traces (call graphs) — each with its own storage backend, query language, and retention model. You’d run Elasticsearch for logs, Prometheus for metrics, Jaeger for traces, and stitch them together in your head during incidents.
ClickStack rejects that split. Everything is a wide event — a context-rich row in a ClickHouse table with whatever fields the application sends. A log line is a wide event. A trace span is a wide event with extra fields. A metric data point is a wide event with a numeric value. The schema is flexible because ClickHouse natively supports JSON columns, dynamic typing, and schema-on-read.
Three architectural properties of ClickHouse make this work in ways that surprise people:
1. Columnar storage with absurd compression
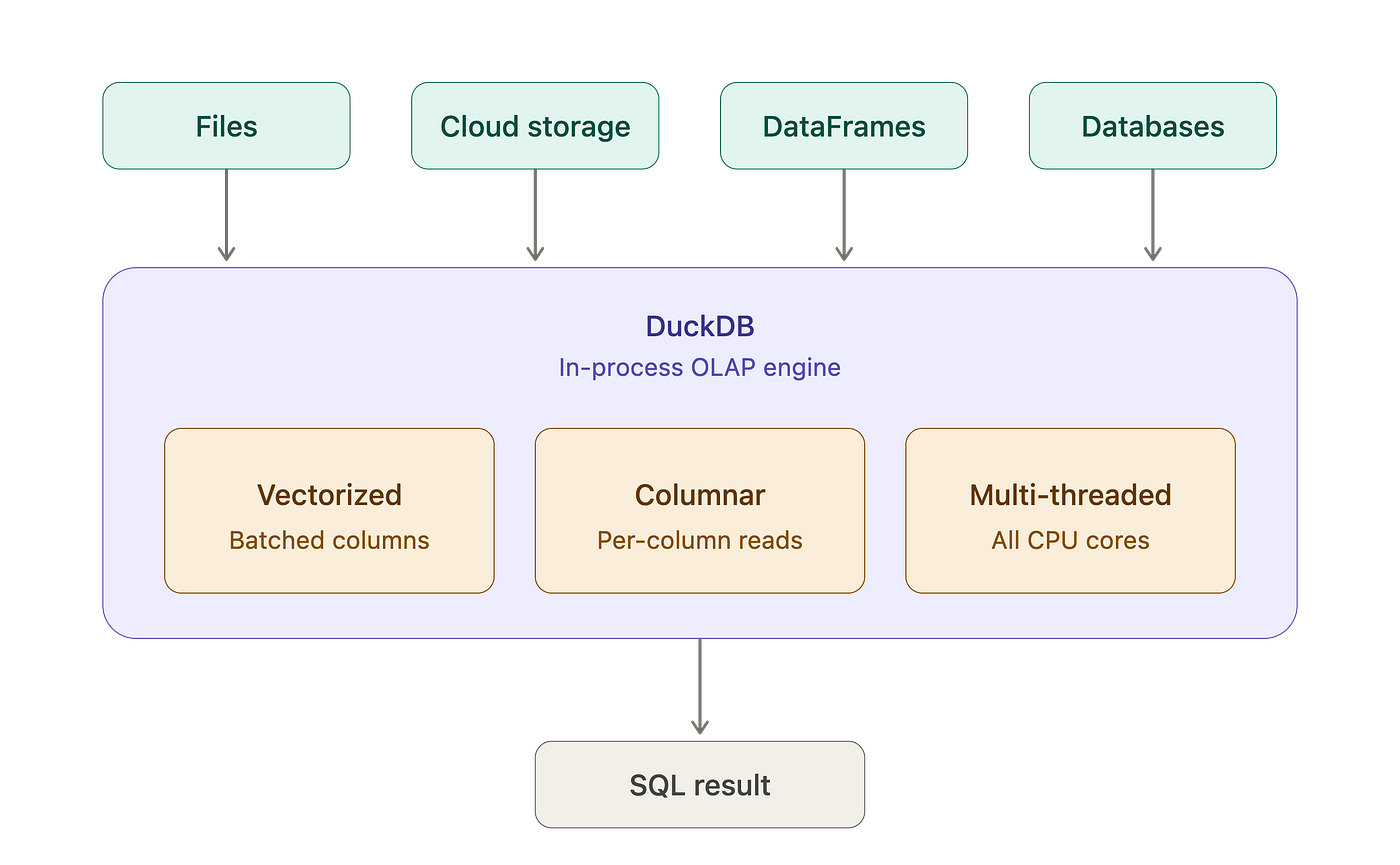
ClickHouse stores data column-by-column, like a warehouse. For observability data — which is overwhelmingly repetitive (same hostnames, same service names, same log levels, same trace IDs) — compression ratios of 10–20x are routine. We’re storing 2 weeks of high-cardinality production telemetry in roughly the same disk footprint that a comparable Elasticsearch deployment would have needed for one week of the same data, and at meaningfully lower cost than what SaaS providers charge for equivalent retention.
2. Parallel, vectorized query execution
ClickHouse uses every CPU core on every node, executing queries in vectorized batches. A WHERE service='checkout' AND status_code >= 500 GROUP BY user_id Query across 30 days of trace data — the kind of query that takes 8 seconds in Elasticsearch — returns in under a second on a moderately-sized cluster.
3. Native JSON without schema migrations
Observability schemas evolve constantly. New services add new fields, instrumentation libraries change attribute names, and business contexts get attached to spans. ClickHouse’s native JSON type means new fields appear automatically as columns the moment they’re ingested — no migration, no schema change, no downtime.
The compound effect: an observability platform that stores more data, queries it faster, and adapts to schema changes without operational pain — at a fraction of the cost.

What I Learned Deploying It for 15 Services
The marketing brochure says “deploy ClickStack and you’re done.” The reality is more nuanced. Here’s what actually worked and what we got wrong.
Configuration over service registry
The instinct from teams coming from service-mesh-heavy environments is to set up a service registry, dynamic configuration, and per-service overrides. We skipped all of that. The whole stack is configured via a single repository of YAML files — one per service — that defines the OTel Collector pipelines, sampling policies, and retention rules.
Why this matters: when you have 15 services and you’re rolling out observability across them, the bottleneck is not “how do I dynamically reconfigure.” It’s “what does this service actually emit, and is it correct.” A flat, version-controlled config tree makes the answer obvious. We could review observability changes in PRs the same way we review code changes.
Tail sampling, not head sampling
The default for most teams is head sampling — decide at the start of a trace whether to keep it, before you know if anything interesting happened. This is fast but you lose the traces that actually mattered (errors, slow requests, edge cases) at the same rate as the boring ones.
Tail sampling — decide at the end of the trace, after you can see the full call graph — is dramatically better. You keep 100% of errors, 100% of slow requests over a threshold, and a small percentage of the rest. ClickStack’s bundled Collector supports tail sampling out of the box; you configure it once and forget it. Storage costs dropped roughly 70% compared to our initial head-sampled deployment, with zero loss of useful traces.
TTL-based retention, set per data class
Not all telemetry is equal. We set:
- Logs: 14 days (cheap to keep, sometimes investigated late)
- Metrics: 90 days (small footprint, useful for capacity planning)
- Traces (errors): 30 days
- Traces (sampled normal): 7 days
- Session replays: 7 days
ClickHouse TTLs handle this automatically. Old data drops off without intervention, and storage cost stays predictable.
Instrumentation patterns per language
Different stacks need different instrumentation strategies, and the OpenTelemetry SDKs vary in maturity:
- Python (FastAPI): auto-instrumentation works well; the
opentelemetry-instrumentation-fastapipackage covers HTTP, requests to other services, and database calls without code changes. Manual spans where business logic mattered. - Node (Express): similar story, auto-instrumentation handles 80% of the work.
- Go: manual instrumentation is the norm. The Go OTel SDK is good but not auto-instrumenting. Plan for it in PRs.
- Java (Spring): the Java agent is excellent — drop in the JAR, set environment variables, you get traces automatically across Spring Boot, JDBC, HTTP clients, and Kafka.
Document this once for your team. The biggest delay in any observability rollout is the long tail of “how do I instrument this service” questions that have already been answered five times.

HyperDX — SQL and Lucene queries side by side
The “single OTel Collector or one per service” question
You’ll face this early. The answer: a small fleet of OTel Collectors deployed as a DaemonSet (Kubernetes) or sidecar (VMs), feeding into a centralized “gateway” Collector that handles tail sampling and routing to ClickHouse. This gives you locality (apps send to localhost), backpressure isolation, and a single point to apply sampling policies.
Trying to point every service directly at a single shared Collector becomes a bottleneck and a single point of failure faster than you’d expect.
ClickStack vs Datadog vs SigNoz vs Grafana
Where ClickStack actually fits in the landscape:

The honest summary:
- Datadog wins if you have the budget, don’t want to operate anything, and need the broadest ecosystem of integrations on day one.
- Grafana stack wins if you’ve already standardized on it, have the ops team to maintain three storage backends, and don’t need session replay or unified wide events.
- SigNoz wins for small teams who want ClickHouse-backed observability and a friendly out-of-box experience, but its schema and UI lag behind ClickHouse engine improvements.
- ClickStack wins when you’re hitting the bill wall on Datadog, have (or can hire) people comfortable with ClickHouse, and want the cleanest open-source path to unified observability.
The cost difference is well documented: independent operators report 10–50x cost reduction vs Datadog at 1–5 TB/day ingestion. When we ran the comparison ourselves before committing, the Datadog quote came in at roughly an order of magnitude higher than what we ended up paying for self-managed ClickStack infrastructure at equivalent scale. That gap is why this conversation keeps happening across the industry.

Where ClickStack Doesn’t Shine (Be Honest)
It’s not a free lunch. The honest tradeoffs:
1. You’re operating ClickHouse now
ClickHouse is a fantastic database. It’s also a real database with operational responsibilities — replica configuration, part merges, TTL tuning, ZooKeeper or Keeper for coordination, backups, version upgrades. If your team doesn’t have anyone who’s comfortable reading ClickHouse system tables and tuning a MergeTree, you'll either learn fast or pay a managed ClickHouse provider.
Managed ClickHouse Cloud (from ClickHouse Inc.) removes most of this pain, but at a cost. It’s still cheaper than Datadog, but the gap narrows.
2. The ecosystem is younger than Datadog’s
Datadog has thousands of pre-built integrations. ClickStack relies on OpenTelemetry’s ecosystem, which is excellent and growing fast but doesn’t cover every niche vendor. If you rely on a SaaS that only exports metrics via a Datadog-specific agent, you’ll need to build a bridge.
3. Alerting is less mature
HyperDX has alerting built in, and it works, but it’s not as battle-tested as Datadog’s. Complex multi-signal alert conditions, escalation policies tied to PagerDuty/Opsgenie integrations, and on-call rotations are areas where Datadog still has the polish advantage. ClickStack is closing the gap but isn’t there yet.
4. The learning curve is real
If your team has spent years building muscle memory in Datadog’s DSL or Grafana’s LogQL, switching to ClickHouse SQL + HyperDX’s Lucene syntax requires retraining. Plan for a 4–6 week ramp where productivity dips before it climbs.
5. Session replay is good, but new
The HyperDX session replay feature is genuinely impressive, but it’s newer than most production-grade alternatives. If session replay is a tier-1 feature for your team (e.g., you’re a frontend-heavy product team), evaluate it carefully against more mature options first.
When to Reach for ClickStack
Use it when:
- Your observability bill is a regular topic in budget reviews
- You’re already running ClickHouse for something else (the operational marginal cost is near zero)
- You want unified logs/metrics/traces/sessions without stitching three backends together
- You need to query high-cardinality data fast and SaaS is choking on it
- You’re building AI agent workflows for observability (the MCP server is a real win here)
Don’t use it when:
- You have a small team, no ClickHouse experience, and limited budget for managed services
- Your scale is small enough that Datadog’s free or low-tier pricing covers you
- You depend heavily on Datadog-specific integrations you can’t replace
- Your priority is “set it and forget it” with zero operational burden
A Closing Thought
The observability industry has spent a decade convincing engineering teams that the only way to get production-grade visibility is to write large checks to one of three vendors. That was true when storing 10 TB of structured logs cost a fortune. It isn’t anymore.
ClickHouse changed the economics. ClickStack just made those economics accessible to teams that don’t want to build their own observability platform from scratch. If you can operate one more stateful service, the math works out. If your team is already running ClickHouse for analytics, the marginal cost of adding observability to it is essentially zero.
bash
# Quick start: full stack via Docker Compose
git clone https://github.com/ClickHouse/ClickStack
cd ClickStack
docker compose up
You can have an end-to-end OTLP pipeline running locally in 5 minutes. Point a test service at it, send some traces, open HyperDX at localhost:8080, and you’ll know within an afternoon whether this belongs in your stack.
The hard part isn’t the technology. The hard part is convincing the team that the SaaS line item you’re about to take on — or the one you’re already paying — isn’t worth what it costs at scale. For most teams at production scale, it absolutely isn’t.
If you’ve migrated from a SaaS observability platform to ClickStack — or considered it and decided otherwise — I’d love to hear what tipped the call and what surprised you in the deployment.
메타데이터
- post_id
- f0c22d9fed12
- slug
- clickstack-the-observability-stack-that-makes-datadog-look-absurd-at-scale-f0c22d9fed12
- url
- https://medium.com/@amaan2000mohd/clickstack-the-observability-stack-that-makes-datadog-look-absurd-at-scale-f0c22d9fed12
- canonical_url
- https://medium.com/@amaan2000mohd/clickstack-the-observability-stack-that-makes-datadog-look-absurd-at-scale-f0c22d9fed12
- author_url
- https://medium.com/@amaan2000mohd
- status
- ok
- fetched_at
- 2026-06-20 20:29:01