9070 XT and RTX 5080: Undervolting
This is Part III of a series of reviews: Part I for the RTX 5080, Part I for the 9070 XT, combined Part II with Microbenchmarks.
9070 XT and RTX 5080: Undervolting
This is Part III of a series of reviews: Part I for the **RTX 5080, Part I for the [9070 XT](https://medium.com/@opinali/the-9070-xt-and-fsr-4-0-906235d1ddec)**, combined Part II with Microbenchmarks.
I will say it already, I don't like overclocking. I like my CPUs and GPUs running cool and quiet, with lower power draw as a bonus. I do care about performance but I’ll work with a fixed “budget” of component prices, power and noise level, and try to squeeze the best performance out of it.
In the past I looked at OC & UV for the 7900 XTX but I settled with use of undervolting only. Now I'm checking AMD's successor, the 9070 XT; as well as NVIDIA’s RTX 5080, in both cases now focusing on undervolting.
Note: Different from some of my previous posts, this is not intended as an RDNA 4 versus Blackwell benchmark. The effects of undervolting depend on factors that include architecture efficiency, sample quality, cooler, and settings like power limit and fan curve. The GPUs I’m testing are different in most of those factors, I did not try to control for any of that — all tests use stock settings for everything except voltage. Still the combined article is more interesting with the contrast between the two scenarios.
Undervolting tests
Most of my testing relies on the FurMark 2 stress test, specifically the new FurMark Knot test. FWIW, I tested at 20.5°C room temperature (❄️ for science) but with a closed case (like all sane PC users).
Please don’t use the traditional “donut” FurMark test. Some reviewers stick with outdated tests because the old test is still popular, or they have historical data and experience using and analyzing it with different hardwares and conditions. Stress tests and benchmarks evolve for a reason. The new FurMark Knot is a much better stress / stability test, especially for modern GPUs.
For both GPUs, idle die temperature was 36°C. That doesn’t mean I will see those temperatures shortly after inactivity starts. Both GPUs tested here have a default configuration allowing Zero RPM after some time of low temp/load, but that threshold is close to 50°C so it can take some time for a passive-cooled GPU to cool another 14°C.
Test setup:
- RTX 5080 FE, Game Ready Driver 576.15
- XFX Mercury Radeon RX 9070XT OC, Adrenalin 25.4.1
- Ryzen 9 9900X, DDR5 6000CL30
- Windows 11 24H2, VBS On
Undervolting the 9070 XT
Thanks to the Radeon App, here’s the shortest GPU Undervolting Tutorial of all time: Go to the Performance>Tuning tab, click Custom, enable GPU Tuning, drag the Voltage Offset to the left, click Apply Changes.
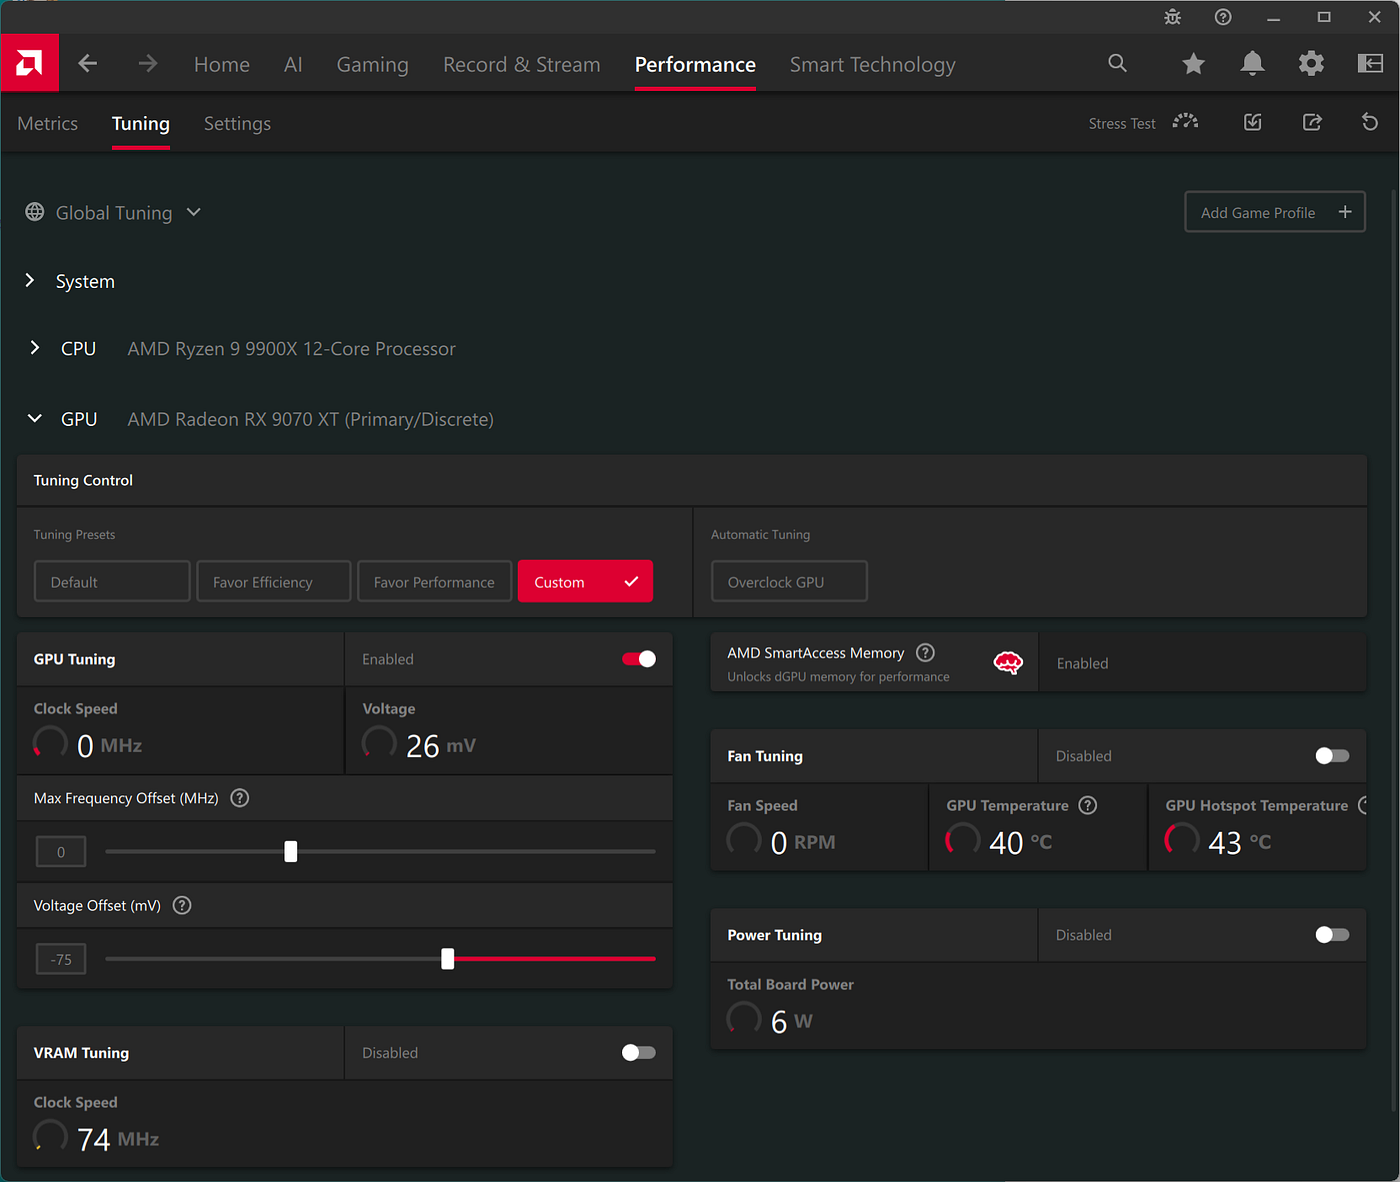
You must find the lowest voltage offset that works, which depends on GPU die quality. I started with -100mV, that was almost stable passing many tests and benchmarks but crashing only on a couple tests. So very likely I could have backed to -90mV and pass all tests. Instead, I went for -75mV which proved rock-solid passing every test. Keeping a safety margin is good: you don't want to daily on the absolute edge of stability.
Now let’s validate it with the FurMark Knot 2160p test.
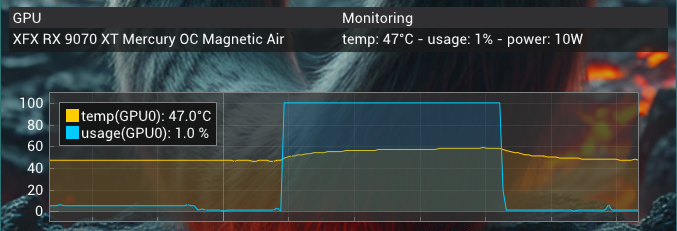
FurMark Knot, 9070 XT at Stock:
- Temps: 58°C, Hotspot 78°C, VRAM 84°C
- Fans: ~1,650rpm
- Power: 340W at 915mV
- GPU Clock: 2,665MHz
Temperatures here are very consistent with various reviews of 9070 XT GPUs including my XFX Mercury (like TechSpot). The core die temp of 58°C is really good, showing the utility of that XFX’s massive 3.5-slot cooler.
On the other hand, the disadvantage of a large heatsink is that passive cooling (with fans off or very slow) takes a long time. You can see at the right of the monitoring graph how slowly the temperature goes down after the test ends. If you care about that, a more aggressive fan curve can help.
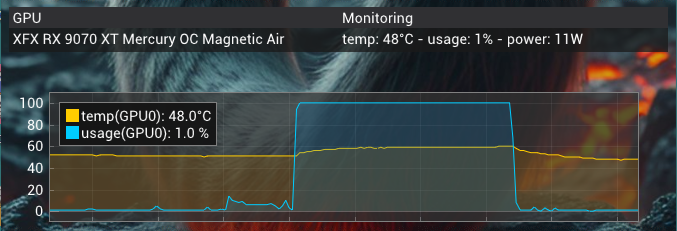
FurMark Knot, 9070 XT Undervolted:
- Temps: 58°C, Hotspot 78°C, VRAM 86°C
- Fans: ~1,650rpm
- Power: 340W at 890mV
- GPU Clock: 2,815MHz
We can see that maximum frequency is higher by 150MHz; in other words, my test at stock was power-limited so undervolting allows the GPU to hit higher clock speeds at the same TGP of 340W. The identical temperatures and fan speed are a consequence of identical power draw.
Despite my -75mV setting, voltage is only -25mV in this test. But that’s at full load with maximum frequency; the voltage offset is applied to a voltage / frequency curve and it doesn’t result in identical voltage adjustment at every point of that curve. This makes a comprehensive UV test very hard, one must test the GPU at various fixed clocks to find the sweet-spot range.
The Radeon App’s tuning UI is very easy to use but it only supports this single offset for undervolting. I don’t known if it is possible to edit the full voltage curve — I tried Afterburner but if I open the voltage curve editor it locks up. Perhaps it just doesn’t support RDNA 4 GPUs yet (as of 4.6.6-beta5).
What about performance? I ran my regular benchmarks with both configurations, showing a simplified subset of the results (e.g. only the “main” API, like DX12 or OpenCL, for tests that support multiple APIs).
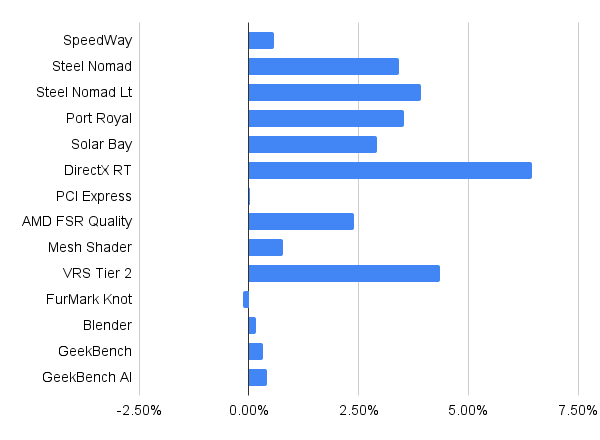
In my 9070 XT, undervolting becomes performance. Similar to FurMark many of these benchmarks are limited by power draw so undervolting allows them to clock a little higher. The main tests at the top that simulate full game engines, from Speed Way to DirectX RT, have the best results around +3% vs stock. With the curious outlier of +6% for path-traced DXR. All GPGPU/AI tests, from Blender to GeekBench, show hardly any gains since those tests are never power-limited.
Undervolting the RTX 5080
Undervolting NVIDIA GPUs needs a third-party utility like MSI Afterburner. Contrary to the Radeon App's single offset, in Afterburner you can and need to edit the full curve (or table) of voltages X clocks. Thankfully the UI is very easy, you can “shift up” the whole curve by a fixed amount and flatten it after the maximum achievable clock. Confusingly though, this system applies a clock offset directly and a voltage offset only indirectly.
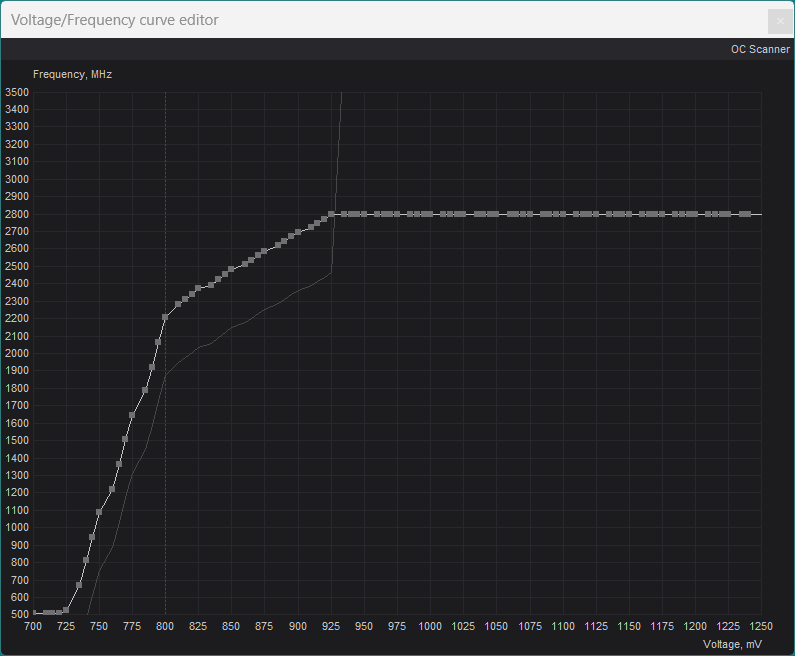
My configuration follows the instructions from ImWateringPSUs, shifting the 925mV point to 2,800MHz and flattening from that point. This reduces the voltage at 2,800MHz from 1,025mV to 925mV = -100mV, but remember again, this is only one point in a curve. With the curve above lower clocks map to decreasing voltage offsets, especially below 2,200MHz.
There's no hotspot temperature, NVIDIA wisely removed that sensor in Blackwell GPUs so we don’t have to worry about higher temps.😀
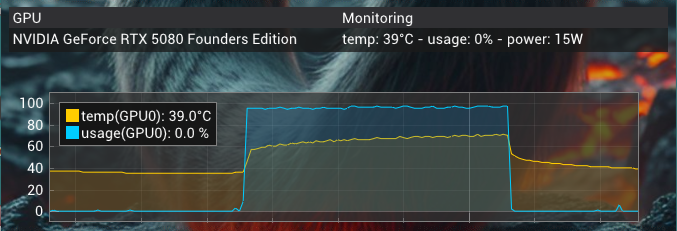
FurMark Knot, RTX 5080 at Stock:
- Temps: 68°C, VRAM 66°C
- Fans: ~1,500rpm
- Power: 325W at 1,030mV
- GPU Clock: 2,745MHz
The RTX 5080 FE is technically a MSRP SKU, but it has a high-end cooler — the same used in the RTX 5090 FE that has vastly more power draw, more VRAM and more performance. So how does it perform? In the good news, the VRAM is a lot cooler than my 9070 XT despite the much faster GDDR7.
But core die temp is higher. Again these measurements are consistent with reviews (like GamersNexus); my VRAM is a cooler but exact comparisons are not possible because the tests are different. The consensus is that the FE’s cooller might be great but the tiny, cramped PCB necessary for the double flow-through design, is a liability for the GPU die. In TechPowerUp’s review the FE comes last compared to lots of AIB coolers—se also that the best RTX 5080’s there scores the same 58°C as my XFX Mercury 9070 XT. So yeah, the RTX 5080 FE doesn’t shine with the +10°C.
Except it does shine when you look at the right side of the temp graph: once the FurMark test ends, core die temperature collapses. It’s like you throw some NO2 on that thing, it drops some 12°C in 2–3 seconds. That’s a big advantage of this design: the heatsink is much smaller than any other cooler’s so once the GPU in the middle stops producing more heat, the fans can chill the whole thing very fast and also go back to Zero-RPM fast.
I find it surprising that some top reviewers choose to do thermal testing with a random GPU benchmark like 3DMark Port Royal, or even a real-game test like The Last of Us part I, instead of fit-to-purpose FurMark. Those can be more appealing and even more representative for a gaming-focused review, but a specialized test is the best-practice to evaluate the hardware itself — even more when comparing to different HW. For example it’s possible that GPU A looks better in temperature charts than GPU B when testing TLoUp1 just because this particular game runs better on A, because it’s more optimized for that GPU or its driver support that game better. The game can even make the better GPU look worse, because optimization results in higher GPU utilization = higher temps. TechPowerUp's use of UE4 tooling looks interesting because they can fine-tune the GPU workload to produce a precise noise-normalized test over the power range. But if you're using some off-the-shelf program, just use FurMark for this.
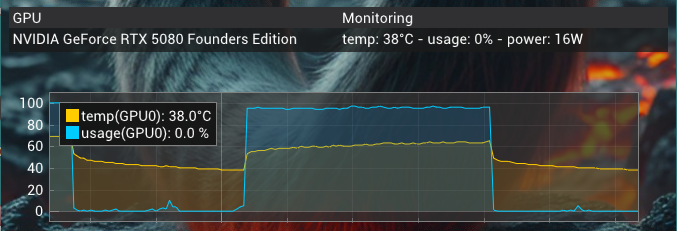
FurMark Knot, RTX 5080 Undervolted:
- Temps: 64°C, VRAM 64°C
- Fans: ~1,400rpm
- Power: 266W at 915mV
- GPU Clock: 2,765MHz
In this RTX 5080 FE, undervolting mostly saves power. The GPU clock got higher by virtually nothing, +20Hz. But power draw is down by 60W, and as consequence the GPU die is cooler by -4°C and the fans slower by -100rpm. You could tweak the fan curves to get cooler temps at the same noise level or a more significant reduction in fan speed & noise at same temperatures.
The effective undervolt looks better than the 9070 XT even at full load / top of the curve: -115mV. It’s hard to tell how much this is an effect of different UV methods and values, or if it’s just that the RTX 5080 undervolts better at high load. But I will agree with most reviewers, I think it’s the latter: the Blackwell architecture seems more energy-efficient than RDNA 4’s denser design, at least at full load / boost clocks where the 9070 XT’s factory settings push harder into the efficiency curve.
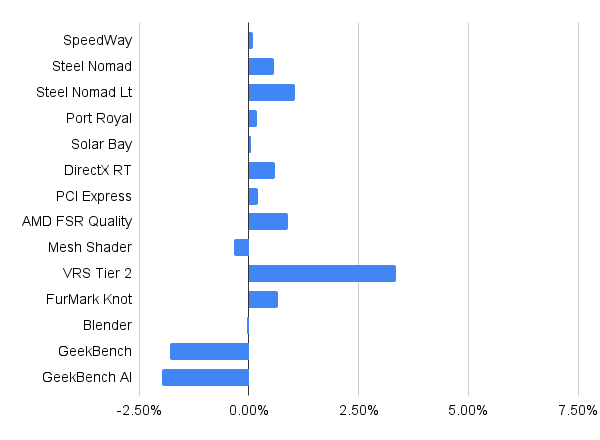
My performance benchmarks tell a similar story. Most tests show sub-1% wins, often within margin of error (that’s below ±0.5% for most of those synthetic benchmarks). The two GeekBenchs lose by -2%, apparently those GPGPU/AI tests like higher voltages. The average is a wash, there’s no performance motivation to prefer either configuration — again unless you combine UV with other tunings in clock and power limits, fan curves etc.
Different from my 9070 XT, this RTX 5080 is not power-limited or at least not as much. Most of those benchmarks are hitting maximum clock before they hit the TDP limit, so when I reduce voltage they can’t clock much higher like we saw also in FurMark.
For example, 3DMark Steel Nomad runs in the 9070 XT using 340W at Stock; UV gets the same power draw but a +3.5% score. With the RTX 5080, Stock does 345W and UV drops that to 300W but without a meaningful speedup.
UV & FG, the Dynamic Duo
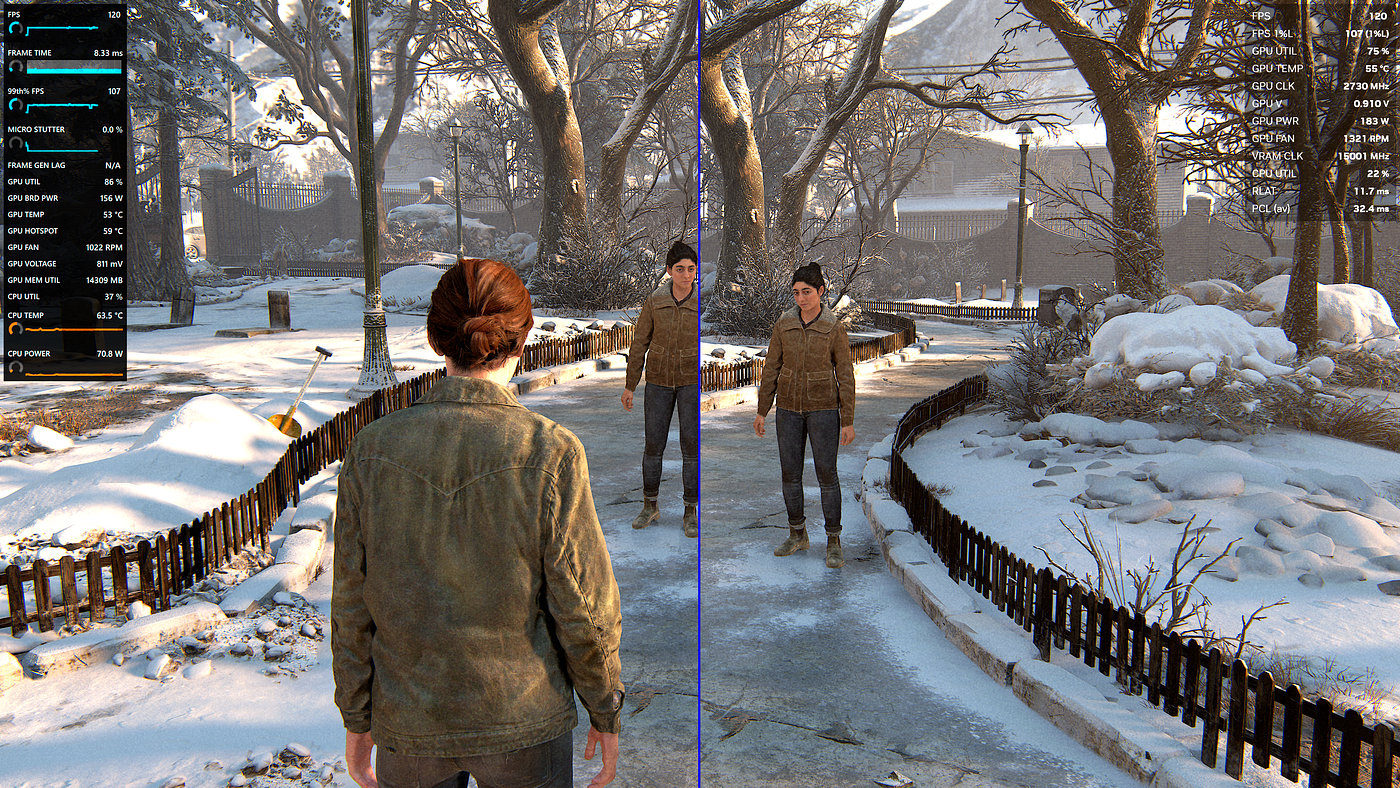
If you go for efficiency, Frame Generation is another valuable tool. Above I can run The Last of Us Part II, 4K max settings, DLSS4 or FSR4 Quality+FG at 120fps on both GPUs. I limited the game to 60fps before FG, that’s more than good-enough input latency with this kind of game especially with Reflex or Anti-Lag 2. The power draw on each GPU:
- RTX 5080: 215W Stock, 185W UV (-30W)
- 9070 XT: 175W Stock, 155W UV (-20W)
In this real-world test the 9070 XT surprised with better efficiency than all benchmarks that run at full load. It delivers the same performance as the RTX 5080 with lower power draw. RDNA 4 is not efficient at 100% load but it rewards you for going “eco-mode”; 85% load here is a huge improvement. Notice the RTX 5080, clearly stronger in particular for this game, has even lower load of 75% but it’s still not as efficient.
Frankly this is the best use-case for both undervoting and FG, IMO.
Conclusions
This article only scratches the topic of tuning both GPUs, they have other buttons to push — core and VRAM clocks, power limit, fan curve; plus I only tested one SKU of one tier of each of Blackwell and RDNA 4. But for my purposes of maximizing efficiency so the GPU does the same work with less power draw and its consequences in heat/noise, I’m quite happy with the low-effort results I have achieved in both cards.
메타데이터
- post_id
- f0e117538ce3
- slug
- 9070-xt-and-rtx-5080-undervolting-f0e117538ce3
- url
- https://medium.com/@opinali/9070-xt-and-rtx-5080-undervolting-f0e117538ce3
- canonical_url
- https://medium.com/@opinali/9070-xt-and-rtx-5080-undervolting-f0e117538ce3
- author_url
- https://medium.com/@opinali
- status
- ok
- fetched_at
- 2026-06-26 03:39:16