The First Sign a Team Is Optimizing the Wrong Thing
Story points went up 40%. Customers were angrier than ever. Here’s what actually happened.
The First Sign a Team Is Optimizing the Wrong Thing
Story points went up 40%. Customers were angrier than ever. Here’s what actually happened.
There was a quarter where our sprint velocity was the highest it had ever been. We were shipping fast. The burndown charts looked beautiful. Leadership was sending congratulatory Slack messages.
Around the same time, our support ticket volume doubled. A bug that had been reported three weeks earlier was still open because no one had time to look at it — we were all moving fast. A critical migration that needed to happen was parked in the backlog because there were no story points attached to “research and stabilize the data layer.”
The team was optimizing perfectly. For the wrong thing.
Here’s how you spot it before it gets to that point, and — more importantly — what the first sign actually is before the metrics diverge.

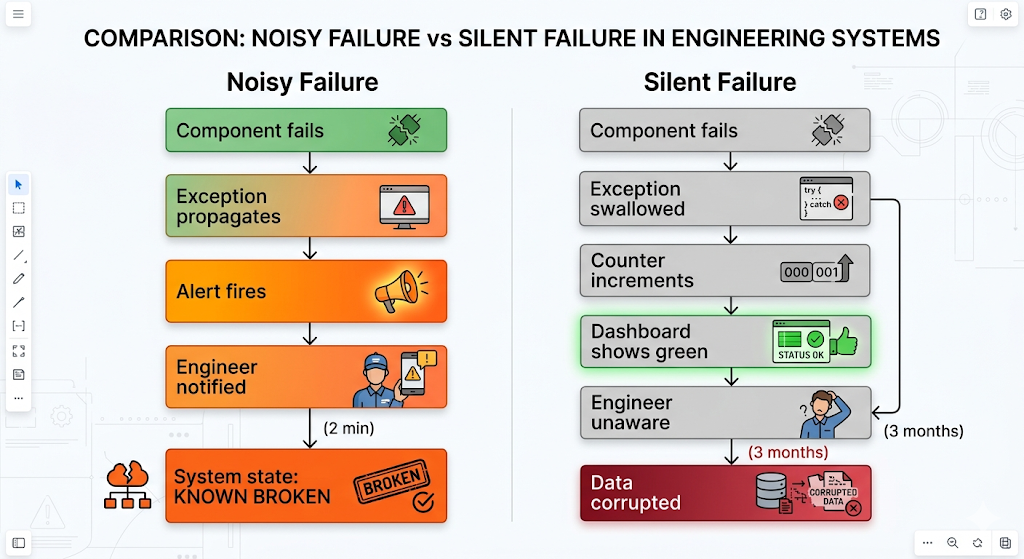
AI-generated image (prompt by Bhavyansh)
The First Sign Is Always the Same
It’s not a dashboard signal. It’s a conversation.
Specifically, it’s when someone on the team starts saying things like: “Does this need to be a ticket? I just need an afternoon to fix this the right way.” And the answer — explicit or implicit — is: “If it’s not a story, it doesn’t count.”
That’s the tell. When the measurement system starts shaping what work is considered real, the team has crossed over. The metric is no longer describing work; it’s defining it. And at that point, you’re not optimizing for outcomes — you’re optimizing for the score on the scoreboard while the actual game deteriorates.
The researchers at DevOps Research and Assessment (DORA) have spent years on this. Their finding is consistent: high-performing engineering teams don’t trade delivery speed for stability. They maintain both, because they’re measuring both. Teams that only track velocity tend to watch quality erode invisibly while the velocity number stays strong — right up until it doesn’t.
Why Velocity Becomes the Default
I don’t think teams reach for velocity as a primary metric because they’re naive. They reach for it because it’s legible. It’s a number. You can put it on a slide. You can draw a trendline. In a meeting with non-technical stakeholders, saying “we completed 47 story points this sprint” sounds like a complete report of team health.
The problem is that story points were never designed for that. They were designed for capacity planning inside a team — giving the team a rough sense of how much they can take on in a sprint. Treating them as a productivity metric is like using a tire pressure gauge to check engine health. It’s not that the tool is wrong; it’s that it’s measuring the wrong thing for the question you’re asking.
And yet, because velocity is legible, it gets surfaced to leadership. Leadership references it in planning. Individuals start feeling pressure to hit the number. Gradually, the team starts doing something subtle but destructive: inflating estimates. Not dishonestly — more like a natural adaptation. If a task feels like a 3 but there’s uncertainty, maybe call it a 5. Protect the margin. Make the number look good.
Once that starts, velocity as a signal is dead. You’re tracking the team’s political adaptation to measurement pressure, not their actual throughput.
What the Chart Looks Like Right Before the Collapse
I’ve seen this pattern enough times to recognize it before the incident reports arrive.

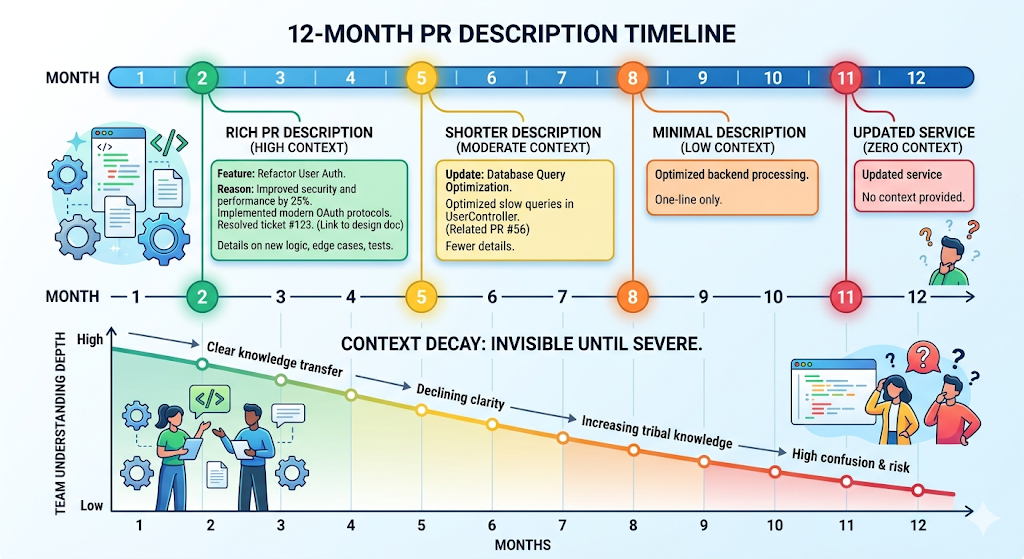
AI-generated image (prompt by Bhavyansh)
The sequence tends to go like this:
Velocity goes up. This initially feels good. Then, quietly, the change failure rate starts climbing — more bugs per release. The team is moving fast and breaking things. But since change failure rate isn’t on the dashboard, no one notices yet.
Next, technical debt conversations start disappearing. Refactoring PRs get deprioritized because they don’t map cleanly to features. Testing coverage drifts. The codebase starts accumulating the kind of friction that doesn’t show up as a bug — just as everything feeling a bit slower, a bit more fragile.
Then something breaks in production and takes three times longer to fix than it should, because the area of the codebase involved hasn’t been touched in months and the institutional memory is gone.
Here’s a rough version of what the monitoring might look like when you’re in the bad zone:
# What teams track (and what they miss)
tracked_metrics = {
    "velocity": "47 story points",       # looks great
    "deployment_frequency": "3x/week",   # also looks great
}

untracked_metrics = {
    "change_failure_rate": "18%",        # quietly high
    "mean_time_to_restore": "4.2 hours", # quietly terrible
    "tech_debt_ratio": "growing",        # not even measured
}
# Both dashboards tell a story.
# Only one of them is accurate.
This isn’t a contrived example. DORA’s research consistently shows that elite engineering teams have deployment frequencies similar to high-velocity teams, but radically different change failure rates and recovery times. The difference is that they track both sides of the equation.
The Meeting That Changed How I Think About This
I sat in on a retrospective once where the team was frustrated. They’d had a rough sprint — a major bug had slipped through, a release was delayed, morale was low.
The engineering manager opened with: “Our velocity was down this sprint. Let’s figure out why.”
And someone — quietly, almost reluctantly — said: “We actually did a lot this sprint. We fixed the auth bug that’s been causing silent failures for two weeks. We rewrote the test suite for the billing module. We cleared a bunch of things that weren’t ticketed. The velocity was down because we did work that didn’t count.”
The manager meant well. But the framing — “velocity was down, let’s fix it” — treated the wrong thing as the problem. The team had actually had a productive sprint in the ways that mattered. They’d just not scored it.
That conversation has stuck with me because it illustrated something I think about a lot: the measurement system you choose doesn’t just measure your team. It teaches your team what to value.
A Different Take on DORA Metrics
DORA metrics are the standard alternative to raw velocity, and they’re genuinely better. Deployment frequency, lead time for changes, change failure rate, mean time to restore — this is a much healthier set of signals than story points alone.
But here’s my concern: I’ve watched teams adopt DORA metrics and then optimize those metrics the same way they optimized velocity. They start gaming deployment frequency by shipping trivially small changes. They measure mean time to restore by how fast they close the incident ticket, not by how fast the system actually recovered.
The tools aren’t the problem. The underlying dynamic is: when any metric becomes a performance target rather than a diagnostic signal, it stops being accurate. The fix isn’t a better metric — it’s a culture that treats metrics as questions, not answers. Numbers tell you where to look. They don’t tell you what you’re actually seeing.

AI-generated image (prompt by Bhavyansh)
The Actual Fix
It’s simpler and harder than it sounds.
Stop comparing teams on velocity. Let the number belong to the team for planning purposes only. Start having explicit conversations about work that doesn’t get scored — bug investigation, refactoring, documentation, the unglamorous maintenance that keeps systems alive.
Ask a different question in sprint reviews: not “did we hit the velocity target?” but “does the codebase feel healthier or more fragile than it did two weeks ago?”
That question is harder to quantify. That’s the point. The things that matter in engineering tend to resist clean quantification. The moment you make a clean number the primary signal, you’ve started measuring the shadow of the thing rather than the thing itself.
Three actionable takeaways:
First, add change failure rate and mean time to restore to your team’s dashboard — not velocity alone.
Second, create a formal category for un-ticketed maintenance work, even if it’s just a recurring “housekeeping” story each sprint. Make the invisible visible.
Third, in your next retrospective, ask: “What important work did we do that didn’t show up in our metrics?” The answers will tell you more than the burndown chart.
The real question: if your team’s velocity number disappeared tomorrow, what would you actually track to know if things were going well?
Let’s Connect!
If you’re new to my content, I’m Bhavyansh Yadav — a software engineer sharing practical lessons from building and breaking production systems.
I write consistently on Medium, and if you want deeper dives, frameworks, and actionable insights delivered to your inbox every Wednesday, join my newsletter:
**Subscribe to my Substack here**
Thanks for reading!
메타데이터
- post_id
- f0e8d8a93247
- slug
- the-first-sign-a-team-is-optimizing-the-wrong-thing-f0e8d8a93247
- url
- https://medium.com/@bhavyansh001/the-first-sign-a-team-is-optimizing-the-wrong-thing-f0e8d8a93247
- canonical_url
- https://medium.com/@bhavyansh001/the-first-sign-a-team-is-optimizing-the-wrong-thing-f0e8d8a93247
- author_url
- https://medium.com/@bhavyansh001
- status
- ok
- fetched_at
- 2026-07-19 13:58:12