Correlating Metrics, Logs, and Events for KEDA Scaling Diagnosis
A practical look at diagnosing scaling latency in KEDA-based Kubernetes workloads
Correlating Metrics, Logs, and Events for KEDA Scaling Diagnosis
For my final year project, I wanted to understand why Kubernetes autoscaling sometimes just… doesn’t work the way you’d expect. Not the configuration part, there are plenty of tutorials for that. I wanted to know: when scaling is slow, how do you figure out why?
I built a test environment with RabbitMQ, KEDA, and consumer workers, then deliberately broke things to study the failure patterns. Here’s what I learned.
Understanding the Kubernetes Scaling Pipeline
How KEDA Actually Scales
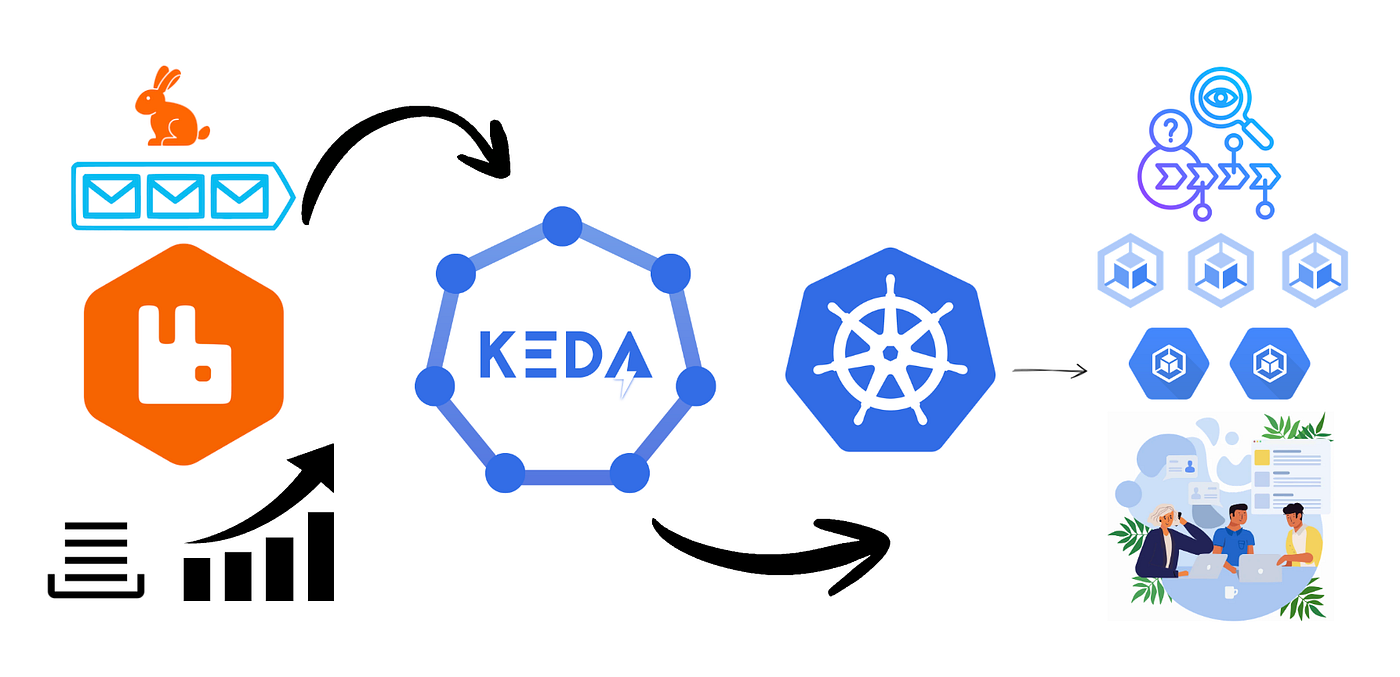
Most people think of KEDA as a single autoscaler, but it actually operates in two distinct phases and this matters when diagnosing delays.
Phase 1 - Activation (0→1): KEDA polls the queue directly via AMQP or the RabbitMQ HTTP management API at a configurable interval (default 30 seconds). It checks the number of messages ready for processing, and if that crosses a threshold, it activates the workload by scaling from zero to one replica. KEDA handles this phase entirely on its own.
Phase 2 - Scaling (1→N): Once at least one replica is running, KEDA steps back. The standard Kubernetes HPA controller takes over and polls KEDA’s metrics server at its own interval (default 15 seconds, set by --horizontal-pod-autoscaler-sync-period). The HPA then makes all further scaling decisions.
This two-phase handoff means the scaling decision pipeline involves two different systems with two different timing cycles. A bottleneck in the activation phase looks very different from one in the scaling phase, even though both produce the same visible symptom: a growing queue.
Three Types of Scaling Delays
Through repeated experiments, I identified three distinct categories of delays. Each one looked similar on the surface but had completely different root causes.
Cold Start Delays
KEDA detects the spike, Kubernetes creates new pods, but those pods don’t actually start processing messages for a while. The delay comes from multiple places: pulling the container image (especially the first time on a node), initializing the application inside the container, and establishing connections to RabbitMQ.
The symptom is deceptive. Pod count looks healthy, new pods are appearing. But message processing rates tell the real story: nothing changes until the pods are fully ready. The gap between “pod exists” and “pod is doing useful work” is where cold start latency hides.
Scheduling Delays
Sometimes KEDA triggers scaling and Kubernetes acknowledges that new pods are needed, but the pods sit in a “Pending” state. The scheduler can’t find nodes with enough available resources to place them.
In cloud environments, this is where the cluster autoscaler kicks in to provision new nodes. But that adds another layer of delay, you’re now waiting for a virtual machine to boot before you can even start pulling your container image. Industry benchmarks put the total delay from spike to available capacity at 30 seconds best case (images cached, fast startup) to over 3 minutes with cold nodes and large images.
Resource requests and limits matter a lot here. If your pods request more CPU or memory than necessary, you exhaust node capacity faster and hit these bottlenecks more often.
Polling Interval Latency
This was the most subtle issue. Since KEDA doesn’t watch the queue in real time, it polls at intervals, there’s an inherent gap between when the queue state changes and when the system notices.
With the native RabbitMQ scaler, the latency source is straightforward: the KEDA polling interval for 0→1 activation (up to 30 seconds), and the HPA sync period for 1→N scaling (up to 15 seconds). A queue spike landing right after a polling cycle goes unnoticed until the next poll.
If you use a Prometheus-based scaler instead, this latency compounds further. The queue state first needs to be exposed by a metrics exporter, then scraped by Prometheus on its own schedule, and only then read by KEDA. Each hop adds delay. I used the native scaler, so my delays were simpler but understanding how your metrics pipeline architecture affects scaling responsiveness is part of the point.
This delay is invisible unless you’re specifically looking for it. Dashboards show everything working correctly, just late.
Why Single-Signal Monitoring Falls Short
No single monitoring signal explains the whole problem. Metrics show the queue rising and pods eventually scaling, but not why there was a gap. Logs show individual pod behavior but miss the broader pattern. The real picture only emerges when you correlate all three signal types.
- Metrics gave me the timeline: when the queue spiked, when pods were created, when processing caught up. Queue depth, pod count, CPU usage, and message consumption rates through Prometheus and Grafana.
- Logs gave me the details like image pull durations, application startup sequences, connection retry attempts. Through Loki, I could see exactly what each pod was doing during those critical first seconds.
- Kubernetes events were the surprise MVP. Events like
FailedScheduling,ImagePullBackOff, andContainerCreatingcaptured things neither metrics nor logs did like why a pod was stuck pending, or that an image pull was being throttled. Before this project, I didn't pay much attention to Kubernetes events. Now I think they're one of the most underrated debugging tools in the ecosystem.
One important distinction: Prometheus, Grafana, and Loki were my observability tools not part of the scaling decision path. KEDA queried RabbitMQ directly for scaling decisions. Keeping this separation clear saved me from a lot of confused debugging.
A Rule-Based Diagnostic Framework
Once I understood the patterns, I built a simple rule-based diagnostic framework that correlates these signals and points toward the most likely root cause. It’s not a self-healing system or an automated remediation engine, it’s a diagnostic assistant.
Rule 1: Queue growing, no new pods appearing → polling interval latency. KEDA hasn’t seen the spike yet (if scaling from zero) or the HPA hasn’t reacted (if at 1+ replicas). Check polling interval and HPA sync period.
Rule 2: Pods created but stuck in Pending → scheduling or resource bottleneck. Check node capacity, resource requests, and cluster autoscaler status.
Rule 3: Pods running but processing rate flat → cold start latency. Check image pull times, application startup logs, and readiness probe configurations.
Nothing sophisticated but it turned hours of manual dashboard-hopping into a structured process that narrows down the problem area in seconds. The value wasn’t in building a production-grade tool, it was in proving that correlating signals systematically gives you a much faster path to root cause than checking each one in isolation.
Key Takeaways
- Autoscaling is reactive by nature. By the time a scaling decision is made, executed, and new pods are processing work, the situation has already evolved. Understanding this lag matters more than tweaking thresholds.
- The two-phase model creates distinct failure modes. Knowing whether you’re stuck in 0→1 activation or 1→N scaling changes where you look entirely.
- Kubernetes events deserve more attention. They’re free, already there, and often contain exactly the information you need.
- Observability tools ≠ scaling tools. Conflating what you use to watch the system with what drives scaling decisions leads to wrong conclusions.
What I’d Explore Next
None of these were part of my project, just directions worth exploring if someone wanted to build on this work. Predictive scaling using historical queue patterns to pre-scale before spikes, which is fundamentally a time-series forecasting problem rather than an observability one. Distributed tracing to follow individual messages end-to-end and see where time is lost at the per-request level. And anomaly detection to catch edge cases the predefined rules don’t cover.
Final Thoughts
I started this project thinking autoscaling was a configuration problem. It’s not, it’s a systems problem. The scheduler, the container runtime, the polling pipeline, and the application itself all interact in ways that aren’t obvious until something goes wrong.
Autoscaling isn’t just about adding more pods. It’s about understanding the entire chain of events that happens before scaling actually becomes effective.
메타데이터
- post_id
- f16801e870ce
- slug
- correlating-metrics-logs-and-events-for-keda-scaling-diagnosis-f16801e870ce
- url
- https://medium.com/@sandalichandrasekara/correlating-metrics-logs-and-events-for-keda-scaling-diagnosis-f16801e870ce
- canonical_url
- https://medium.com/@sandalichandrasekara/correlating-metrics-logs-and-events-for-keda-scaling-diagnosis-f16801e870ce
- author_url
- https://medium.com/@sandalichandrasekara
- status
- ok
- fetched_at
- 2026-06-09 15:37:30