The Secret Sauce of Data Science: How the Box-Cox Transformation Turns “Ugly” Data into Gold
Have you ever tried to force a square peg into a round hole?

or
The Secret Sauce of Data Science: How the Box-Cox Transformation Turns “Ugly” Data into Gold
Have you ever tried to force a square peg into a round hole?
In the world of Data Science and Machine Learning, this happens every day. We feed raw, messy, “ugly” data into sophisticated algorithms expecting genius results. But instead of genius, we get garbage.
The culprit? Data Skewness.
The hero of our story? The Box-Cox Transformation.
Today, we are going to demystify this mathematical power tool. We won’t just show you the formula; we will explain why it works using a real-world example involving your morning coffee. Whether you are a data scientist, a business analyst, or just a curious mind, by the end of this article, you will understand how to turn chaos into clarity.
The Problem: The “Drunken” Distribution
Before we can fix data, we need to understand what’s broken.
Most popular statistical models (like Linear Regression) make a massive assumption: They assume your data follows a Normal Distribution (the Bell Curve).
But in the real world, data rarely looks like a perfect bell curve. It usually looks like a “slide.” Most of the data is bunched up on the left, with a long tail stretching out to the right. We call this a Right Skewed Distribution.
🌍 Real-World Example: The Coffee Shop Revenue
Imagine you own a small, trendy coffee shop, “The Daily Grind.”
You track your daily sales for a year. You notice a pattern:
- Monday — Thursday: Sales are steady, around $500/day.
- Friday: Sales jump to $800.
- Saturday: Sales explode to $2,000.
- Sunday: Slow again, back to $600.
If you were to plot this on a graph, most days (the weekdays) are bunched up on the low end (left), and the massive Saturdays are dragging the average out to the right.
Why is this bad for prediction? If you try to predict future sales using this skewed data, the “Saturday Effect” (the outliers) will hijack your model. Your model will think, “Hey, sales are usually low, but sometimes they are MASSIVE.” It becomes confused and inaccurate.
The data is “non-normal.” To fix it, we need to transform it. We need the Power Transformer.
The Solution: Enter the Box-Cox Transformation
The Box-Cox transformation is a statistical technique developed by statisticians George Box and David Cox. It is essentially a “dial” that we turn to find the mathematical power (exponent) that makes our data look like a Bell Curve.
It takes non-normal (skewed) dependent variables and transforms them into normal variables.
The Box-Cox Formula (Don’t Panic!)
Here is the math. It looks scary, but the logic is beautiful.
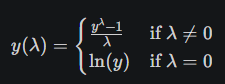
Let’s break this down:
- y: This is your original data (your sales figures).
- ln(y): This is the natural logarithm of your data.
- λ(Lambda): This is the Magic Parameter.
How it works: The Box-Cox method tests a range of values for Lambda (usually from -5 to 5) to see which one results in a distribution that is closest to the Normal Distribution (lowest Standard Deviation).
It uses a process called Maximum Likelihood Estimation — a fancy way of saying, “It keeps guessing until it finds the shape that fits the best.”
The Magic of Lambda: Shaping the Data
This is the “Aha!” moment. Lambda (λ) acts like a volume knob for the shape of your data.

Back to the Coffee Shop: Your coffee shop sales are right-skewed. The Box-Cox algorithm will analyze your sales data and likely find that the optimal Lambda is somewhere close to 0 or 0.5.
If it picks 0.5, it essentially transforms your revenue data by taking the square root of every sales figure.
- Original Monday: $500 → Transformed:(500)**(1/2) ≈ 22.3
- Original Saturday: $2,000 → Transformed: (2000)**(1/2) ≈ 44.7
- Notice how the gap shrank?
- The difference used to be $1,500. Now, the difference is only ~22 points on the transformed scale. The massive Saturday spike is no longer an outlier; it’s just a point on the curve. Your data now looks like a nice, neat Bell Curve.
Why Should You Care? (The Benefits)
Why go through the trouble of doing this math?
- Stabilized Variance (Homoscedasticity): Your data stops “breathing” irregularly. The variance becomes constant across the board.
- Improved Model Accuracy: Linear Regression and ANOVA work significantly better when the input is normal.
- Interpretability: While the transformed numbers (like 22.3) don’t mean “dollars” anymore, the patterns revealed allow you to make better business decisions. You can always reverse the transform later to see the actual dollar predictions.
How to Do It (Python Example)
For the coders out there, implementing this is terrifyingly simple thanks to the scipy library. No complex calculus required.
import pandas as pd
from scipy import stats
import matplotlib.pyplot as plt

# Imagine this is your coffee shop data
sales_data = [500, 480, 520, 2000, 600, 510, 1900, 530]

# 1. Apply Box-Cox
# The function returns the transformed data AND the optimal lambda found
transformed_data, lambda_value = stats.boxcox(sales_data)

print(f"Optimal Lambda: {lambda_value:.4f}")

# 2. Visualize the difference (Conceptual)
# You would plot 'sales_data' (Skewed) vs 'transformed_data' (Normal)
When you run this, Python finds the Lambda for you.
Summary: The Takeaway
The Box-Cox transformation is a bridge between the messy reality of the world and the pristine requirements of statistics.
- Real World: Skewed, chaotic, unequal.
- Statistical World: Normal, symmetric, equal.
By finding the perfect Lambda (λ), Box-Cox mathematically forces your data to behave, allowing your models to uncover insights that were hidden in the tail.
So next time your Machine Learning model is failing, or your forecast is wildly inaccurate, ask yourself: “Is this a square peg in a round hole?”
If it is, it’s time to Box-Cox it.
Share this article if you finally understand why Log-Transforms work!
FAQs
Does data have to be positive for Box-Cox?
Yes, strictly positive. If you have zeros, you can add a small constant (like 1) to all values first.
Is Box-Cox the only transformer?
No, there is also the Yeo-Johnson transformation, which handles negative numbers. But Box-Cox is the classic standard for positive data.
메타데이터
- post_id
- f2caf46bc5bc
- slug
- the-secret-sauce-of-data-science-how-the-box-cox-transformation-turns-ugly-data-into-gold-f2caf46bc5bc
- url
- https://medium.com/@koshurai/the-secret-sauce-of-data-science-how-the-box-cox-transformation-turns-ugly-data-into-gold-f2caf46bc5bc
- canonical_url
- https://medium.com/@koshurai/the-secret-sauce-of-data-science-how-the-box-cox-transformation-turns-ugly-data-into-gold-f2caf46bc5bc
- author_url
- https://medium.com/@koshurai
- status
- ok
- fetched_at
- 2026-07-18 19:41:50