Bridging Operations Research and Generative AI: Evaluating Multi-Agent Systems for Pricing…
Introduction
The Rise of Explanation Agents: Making Pricing Models Communication-ready
Bench-marking lightweight LLMs for coherence, relevance, and completeness in enterprise price optimization.
Photo by Growtika on Unsplash
Introduction
Several organizations in retail, CPG , oil and gas etc. leverage price optimization techniques to improve profitability. A small change in price can lead to millions in profit or lost opportunity. Traditionally, organizations utilize operations research (OR) techniques, such as linear and nonlinear programming, to develop profit-maximization models to prescribe change in prices. These models consider demand elasticity, cost structures, competitor pricing, and portfolio-mix , providing mathematically rigorous recommendations.
Yet, OR methods face a persistent challenge: communication. The math may be solid, but executives and front-line teams often struggle to interpret outputs. A recommendation like “increase Product A’s price by 12.3%” may be optimal on paper. However, without explanation, decision-makers always wonder about the why.
Generative AI offers a complementary strength. Large language models (LLMs) can translate complex outputs into plain English, simulate scenarios, and explain trade-offs. However, they lack the stable numerical-computation, constraint-handling, and mathematical rigor of classical optimization models.
This article presents a multi-agent system that acts as a bridge between the two worlds. Each agent contributes a distinct capability, working together to turn raw data into actionable pricing strategies. The architecture mirrors a team of specialists. Each agent focuses on its strength — data analysis, optimization, explanation, or orchestration — while collaborating towards a shared business goal.
All the three agents namely data analysis , optimization and explanation agents play pivotal role in decision-making- the first two by generating mathematically grounded , elasticity based pricing solutions; the other by translating the mathematical results into easily comprehensible and actionable guidance. While, it is important to evaluate all agents , here we primarily focus on the evaluation of explanation agent. We compare a variety of light-weight opensource LLMs hosted in Ollama model repository, each of which acts as explanation agent in turn.
To ensure quality, our system leverages a structured evaluation framework that scores semantic similarity, logical coherence, domain relevance, and completeness, and selects the best narrative using a single aggregated score. This approach primarily focus on enhancing the communication strategy of optimization outcome , while Microsoft’s optimind aims to teach the optimizer through natural language.
By uniting rigorous OR methods with evaluated generative AI explanations, this framework strives to transform raw numbers into actionable, human-friendly pricing strategies. We describe the image of a multi-agent system below where we describe the tech stack in figure-1,that we have used to build such a system . We then lay down the benefits of using such a tech stack. We give an overview of the data-analyst agent and optimization agent and describe the mathematical output that is expected from each of them. We also show the indicative output from the explanation agent. However, we do not stop at building the system but came up with a methodology to evaluate it primarily from the point of view of the explanation agent. We have an additional feature in the system to try out various LLMs as the explanation agent and compare the results based on the methodology.
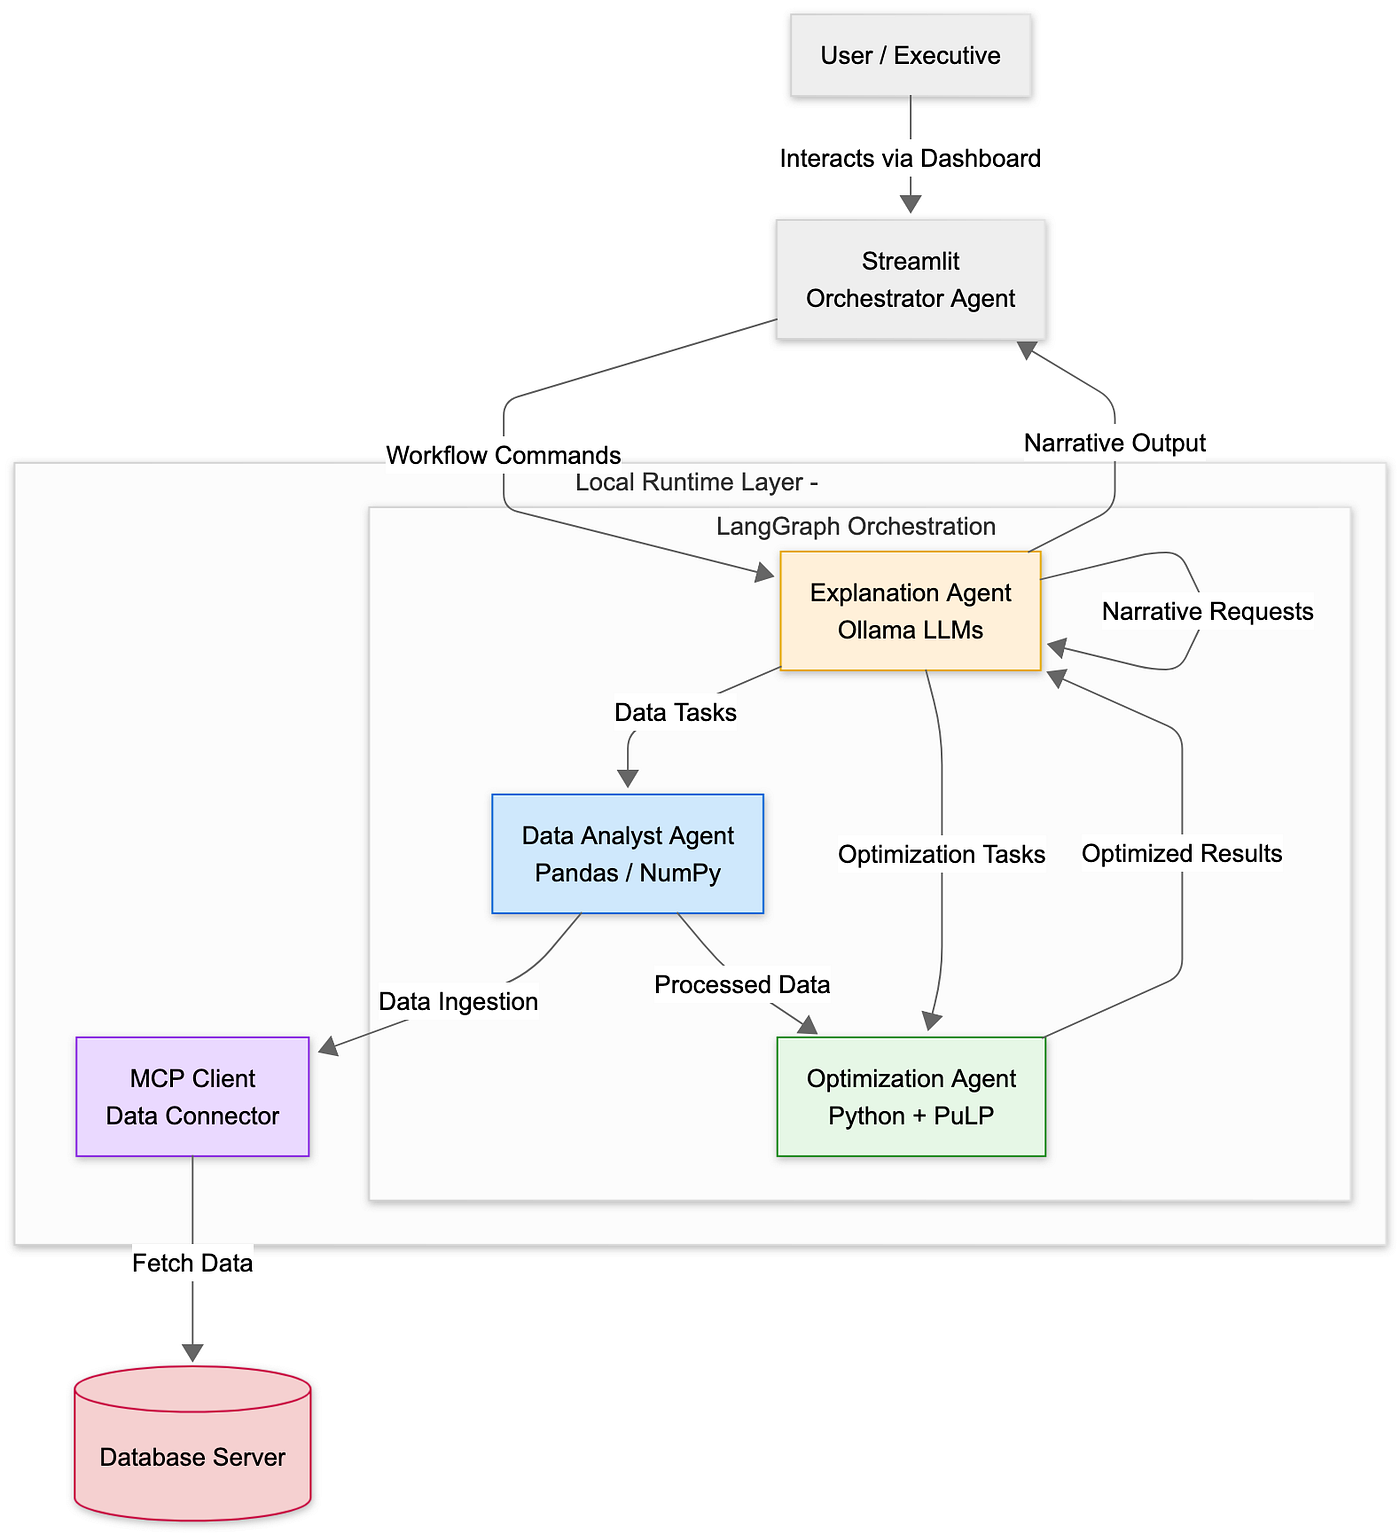
Figure-1: Multi-agent Price-optimization framework
Key Benefits of the above framework:
Local execution ensures reproducibility and avoids cloud GPU costs.
Modular agent-to-tech mapping enables maintainable, upgradable systems.
LangGraph ensures robust multi-agent collaboration and context management.
Integrated evaluation ensures explanations are accurate, coherent, and business-relevant.
Data Analysis agent
The Data Analysis Agent examines cost, price, sales, competitor, and margin data to uncover pricing insights.It connects to the database server via an MCP client, retrieves the required data, performs preprocessing, and then runs a regression of volume on price to estimate price elasticity — a key indicator of demand sensitivity. Higher the elasticity, higher the responsiveness of the prices to demand. A small increase in price might lead to drastic fall in demand.
# Regression equation:
# Volume = β0 + β1 * Price + β2 * Competitor_Price + β3 * Margin + ε

import statsmodels.api as sm

# X = independent variables, y = dependent variable
X = data[['price', 'competitor_price', 'margin']]
y = data['volume']

# Add intercept
X = sm.add_constant(X)

# Fit regression model
model = sm.OLS(y, X).fit()
print(model.summary())

# Compute price elasticity
elasticity = model.params['price'] * (data['price'].mean() / data['volume'].mean())
print(f"Estimated Price Elasticity: {elasticity:.2f}")
Example output from data analysis agent:
Product_A

    Avg Price: $100.81
    Avg Daily Sales: 390.5
    Total Revenue: $13,978,187.42
    Price Elasticity: -2.07

Product_B

    Avg Price: $150.04
    Avg Daily Sales: 797.7
    Total Revenue: $42,504,527.61
    Price Elasticity: -1.95

Product_C

    Avg Price: $200.21
    Avg Daily Sales: 1187.3
    Total Revenue: $84,465,931.57
    Price Elasticity: -2.61
Product_D

    Avg Price: $81.02
    Avg Daily Sales: 1560.0
    Total Revenue: $44,915,277.15
    Price Elasticity: 0.83

Product_E

    Avg Price: $119.50
    Avg Daily Sales: 2011.5
    Total Revenue: $85,669,060.15
    Price Elasticity: -2.32
Estimated Price Elasticity of Product A: -2.07
Interpretation: A 1% increase in price is expected to reduce sales volume by approximately 2.07%, indicating elastic demand in this product category.
Optimization agent
The Optimization Agent uses a profit-maximization model anchored in classical OR. It maximizes profit based on price, cost-structure and predicted demand for a given product. Price is the decision variable here. The predicted demand is influenced by the current price and elasticity. The elasticity is computed by the data analysis agent and is shared with the optimization agent as shown in the architecture diagram. Elasticity plays a key role in helping the optimization agent to come up with the profit maximized price.

This framework balances volume and margin, capturing real-world trade-offs in a mathematically rigorous way.
Example output from optimization agent:
Status: Optimal Expected Profit: $359,043.84
💰 Recommended Prices:

    Product_A: $151.22 (+50.0% change)
    Product_B: $225.06 (+50.0% change)
    Product_C: $140.15 (-30.0% change)
    Product_D: $121.53 (+50.0% change)
    Product_E: $179.25 (+50.0% change)
Explanation Agent
The explanation agent consumes the above output and correlates with other data-points along with external data to produce a narrative that resonates with the business stakeholders. The explanation agents narrative should align with the results from the optimization agent, however it should also make sense to the business so that they can make informed decision. Therefore the success of the optimization agent also depends on how effective the narrative is from the explanation agent.
Example output from explanation agent:
“The model recommends a 12.3% increase for Product_A, reflecting its undervaluation given strong market share. Conversely, Product_C is more price-sensitive, requiring a 4.2% reduction to stimulate demand. This portfolio adjustment maximizes profitability while managing elasticity risk.”
By leveraging multiple LLMs, the system can experiment, score, and select the most coherent, relevant, and complete explanation, ensuring narratives resonate with executives and analysts alike.
Evaluating Explanation agents
To ensure the generation of high-quality, actionable narratives from pricing optimization models, we employ a structured evaluation framework. This framework deconstructs narrative quality into four distinct, measurable dimensions. For each Large Language Model (LLM), multiple narratives are generated, systematically scored across multiple. dimensions, and averaged to produce a single, aggregated reasoning score used for model selection.
Semantic Similarity → We first create a reference response that ideally comes from an experienced pricing analyst/executive.An example of expert response is given below:
def _create_reference_responses(self):
    """Create expert reference responses for evaluation"""

        "explanation": [
            "The results suggest implementing prices gradually to monitor market response",
            "Recommendations account for both business objectives and market realities",
            "Strategy considers competitive landscape and customer sensitivity"
        ]
    }
This metric employs a BLEU-like algorithm to compare the model’s narrative against a corpus of such explanations. It measures the lexical and phrasal overlap, ensuring the output uses terminology and constructs that are consistent with expert reasoning.
def calculate_semantic_similarity(self, candidate: str, references: List[str]) -> float:
    """Calculate semantic similarity using BLEU-like algorithm"""
    def get_ngrams(text, n):
        words = re.findall(r'\w+', text.lower())
        return [tuple(words[i:i+n]) for i in range(len(words)-n+1)]

    candidate_ngrams = get_ngrams(candidate, 1)
    if not candidate_ngrams:
        return 0.0

    max_score = 0.0
    for reference in references:
        ref_ngrams = get_ngrams(reference, 1)
        if not ref_ngrams:
            continue

        candidate_counter = Counter(candidate_ngrams)
        ref_counter = Counter(ref_ngrams)

        matches = sum((candidate_counter & ref_counter).values())
        precision = matches / len(candidate_ngrams)

        bp = 1.0 if len(candidate_ngrams) >= len(ref_ngrams) else np.exp(1 - len(ref_ngrams)/len(candidate_ngrams))
        score = bp * precision
        max_score = max(max_score, score)

    return max_score
Logical Coherence → This metric analyzes the narrative structure, specifically looking for the presence of logical transition words and the progression of ideas. It penalizes disjointed statements and rewards well-structured reasoning that guides the reader from premise to conclusion.
def evaluate_logical_coherence(self, text: str) -> float:
    """Evaluate logical flow and argument sequencing"""
    sentences = re.split(r'[.!?]+', text)
    if len(sentences) <= 1:
        return 0.5

    transition_words = ['however', 'therefore', 'moreover', 'consequently', 'furthermore', 'thus', 'accordingly']
    transitions = sum(1 for word in transition_words if word in text.lower())
    return min(1.0, transitions / len(sentences) * 2)
Domain Relevance → A targeted check for the presence of essential domain-specific keywords (e.g., elasticity, margins, constraints, optimization). This ensures the narrative is not just fluent but is meaningfully engaged with the subject matter.
def evaluate_domain_relevance(self, text: str) -> float:
    """Check alignment with pricing concepts"""
    domain_keywords = [
        'elasticity', 'margins', 'constraints', 'optimization', 'sensitivity',
        'profit', 'demand', 'pricing', 'revenue', 'competitive', 'strategy'
    ]

    text_lower = text.lower()
    matches = sum(1 for keyword in domain_keywords if keyword in text_lower)
    return min(1.0, matches / len(domain_keywords))
Completeness → This metric evaluates the substantive depth of the explanation by considering both its length and structural complexity. It ensures the output is not a superficial summary but a thorough elaboration that addresses key findings.
def evaluate_completeness(self, text: str) -> float:
    """Ensure all key insights are covered"""
    word_count = len(text.split())
    sentence_count = len(re.split(r'[.!?]+', text))

    length_score = min(1.0, word_count / 100)
    structure_score = min(1.0, sentence_count / 3)

    return (length_score + structure_score) / 2
The final step in the framework is to synthesize these individual metrics into a decisive model performance score.
def generate_aggregated_reasoning_score(self, narrative: str, expert_references: List[str]) -> float:
    semantic_score = self.calculate_semantic_similarity(narrative, expert_references)
    coherence_score = self.evaluate_logical_coherence(narrative)
    relevance_score = self.evaluate_domain_relevance(narrative)
    completeness_score = self.evaluate_completeness(narrative)

    # The single, aggregated score used for model comparison
    aggregated_score = (semantic_score + coherence_score + relevance_score + completeness_score) / 4
    return aggregated_score
Model Benchmarking: Quantitative Results
We benchmarked six LLMs of similar size for providing narratives for a specific price optimization result, all deployed via Ollama. Each LLM wearing the explanation agent hat was used 10 times to generate narrative for the same result from optimization agent to evaluate the consistency.

Table-1 :Performance comparisons of 6 LLMs based on 4 metrics as well as consistency
This evaluation demonstrates the value of multi-LLM experimentation and structured scoring, ensuring the system consistently delivers actionable, business-relevant narratives.
The diagram (figure-2)below shows the Models ranked by overall reasoning score in visual format. While all the other columns are represented visually in a straight-forward way , the consistency for each LLM in the above table defined based on the box-plot diagram that is represented in the fourth quadrant. The bar graph in the second quadrant shows the overall reasoning scores for only the explanation agent, while the first quadrant refers to overall reasoning score for all agents, which is the graphical depiction of overall score column described in (table-1) above.

Figure-2: Model Reasoning Capability Evaluation
Recommended Model for Pricing Narratives
Based on our benchmarking results, Wizard-math emerges as the best overall choice for generating business-relevant pricing narratives. It strikes the optimal balance across semantic similarity, logical coherence, domain relevance, and completeness, while maintaining moderate consistency across multiple runs.
For organizations prioritizing stability and reproducibility, Mistral is also a solid alternative. While its overall score is slightly lower than Wizard-math, it produces consistently coherent outputs across different scenarios, making it suitable for high-stakes decision-making where predictability is key.
By default, the Explanation Agent can be configured to:
- Experiment across multiple LLMs (Wizard-math, Mistral, Llama3.1, etc.)
- Score outputs using the aggregated evaluation framework
- Select the highest-scoring model for narrative delivery, ensuring business-relevant and trustworthy explanations every time
However, when we examine the narratives from even the high performing models like Wizard Math and Mistral , it is quite evident that these models are not wired to craft narratives from mathematical results.
Narrative from Wizard Math💡 Handled by: explainer | Model: wizard-math
📋 Query requires results explanation
To: Business Executive From: Pricing Optimization Expert Re: Optimization Results Analysis
What the optimization achieved: The pricing optimization model has determined the optimal prices for each product, aiming to maximize the total profit. The expected total profit from these optimized prices is $359,043.84.
Key pricing recommendations: Based on the optimization results, the recommended prices for each product are as follows:
Product_A: $151.22 Product_B: $225.06 Product_C: $140.15 Product_D: $121.53 Product_E: $179.25
These recommendations are based on the assumption that the competitive landscape and other market conditions remain constant. Any changes in these factors should be considered before implementing these prices.
Business implications: Implementing these optimized prices could lead to an increase in total profit by $359,043.84. This would require a review of the current pricing strategy and potential adjustments to prices for each product. It’s important to consider the potential impact on sales volume and market share, as well as any competitive responses.
Risks and considerations: There are several factors that could impact the success of implementing these optimized prices:
Competitor reactions: If competitors adjust their prices in response to your changes, it could affect the planned profit increase. Demand elasticity: Changes in price may result in different demand levels than anticipated. Seasonal variations: The optimization model does not account for seasonal fluctuations in demand or pricing strategies.
Implementation suggestions: To successfully implement these optimized prices, consider the following steps: a. Analyze market conditions and competitor reactions: Assess the current market landscape and potential competitor responses to the price changes. This will help in fine-tuning the recommended prices and minimizing any negative impact on sales and profitability. b. Test the optimized prices: Introduce the optimized prices gradually, monitoring sales and profit trends closely. This will allow for adjustments if necessary and minimize risk. c. Monitor and evaluate performance: Continuously monitor the effectiveness of the new pricing strategy, making any necessary adjustments to maximize profitability while maintaining or growing market share. d. Stay agile: Be prepared to react quickly to changes in market conditions and competitor actions. This will help maintain the competitive advantage and optimize profitability.
In conclusion, the pricing optimization model has determined the optimal prices
While the narrative may look sound , they lack the contextual grounding that a pricing analyst will look for. For example, models often rephrase optimization results without connecting them to business implications, such as elasticity-driven trade-offs. They describe “what” the model suggests (e.g., “increase price by 50%”) but not “why” — missing the reasoning derived from elasticity or competitive dynamics. Wizard-Math has brought in the concept of elasticity and competitive dynamics, but in the context of “Risk and consideration”. Some of the other models have not been able to bring even that perspective. Hence Wizard-Math, Gemma and Mistral scored higher in terms of domain relevance. But, as discussed earlier intertwining the mathematical result with business recommendation is still missing.To address these gaps there are multiple strategies that we can adopt:
Template guided prompting: Provide the model with narrative structures aligned with business communication
Fine-tuning or Domain Adaptation: Curate a corpus of “ideal” business narratives derived from real-world optimization results. Fine-tune smaller open models (e.g., Mistral, Wizard-Math) on these domain examples to teach them how mathematical findings are typically communicated in pricing contexts.
Conclusion
By combining rigorous OR-based optimization with evaluated generative AI explanations in a multi-agent system, enterprises can bridge the gap between mathematical models and actionable business insights. Each agent — data analyst, optimizer, explainer, and orchestrator — works with specialized tools to produce coherent, interpretable, and high-impact pricing strategies.
This approach holds the promise of not only enhance profitability but also improves decision-making transparency, empowering executives and frontline teams to trust and act on model outputs. The approach helps in shortlisting the models that helps in better communication of mathematical results. However, to pursuade the pricing executives to adopt this, there is need for further refinement of the short-listed model results by adding more context, template based answers from executives that the LLMs can refer to or by fine-tuning the model with “ideal” business narratives.
References:
Chen, Z., Zhang, X., Zope, H., et al. 2025. OptiMind: Teaching LLMs to Think Like Optimization Experts. arXiv. [updated September 2025; accessed November 2025]. https://arxiv.org/pdf/2509.22979.
메타데이터
- post_id
- f36d0d43c476
- slug
- bridging-operations-research-and-generative-ai-evaluating-multi-agent-systems-for-pricing-f36d0d43c476
- url
- https://medium.com/operations-research-bit/bridging-operations-research-and-generative-ai-evaluating-multi-agent-systems-for-pricing-f36d0d43c476
- canonical_url
- https://medium.com/operations-research-bit/bridging-operations-research-and-generative-ai-evaluating-multi-agent-systems-for-pricing-f36d0d43c476
- author_url
- https://medium.com/@subarna.roy25
- status
- ok
- fetched_at
- 2026-06-09 15:37:30