RSI is not what you think it is.
RSI Is Not What You Think It Is
RSI is not what you think it is.
RSI Is Not What You Think It Is
The complete guide to reading RSI correctly — and why most traders get it backwards
Almost every trader has heard the same advice: RSI above 70? Sell. RSI below 30? Buy.
It sounds clean. It sounds logical. And it loses money consistently.
After almost 50 years of copy-paste trading education, the Relative Strength Index remains the most misunderstood indicator in existence. Not because it’s complicated — but because it’s been taught wrong from the start.
Here’s what RSI actually is, what it isn’t, and how to use it correctly.
Where RSI Comes From
RSI didn’t emerge from a hedge fund algorithm or a Wall Street trading desk. It came from one man’s frustration.
In 1978, J. Welles Wilder Jr. — a mechanical engineer turned commodity trader — published RSI in his book New Concepts in Technical Trading Systems. His goal was simple: create a single number that measured price momentum. Not just direction. Momentum.
As computer terminals reached trading floors through the 1980s, RSI became a fixture on every chart platform. Traders quickly adopted 70 and 30 as the “overbought” and “oversold” levels Wilder originally suggested — and decades of copy-paste education did the rest.
Wilder never intended RSI to be a buy/sell button. The market punishes this misuse every single day.
What RSI Actually Calculates
RSI measures the speed and size of recent price changes. It compares average gains to average losses over a set period — usually 14 bars — and outputs a number between 0 and 100.
The formula:
RSI = 100 − [ 100 ÷ (1 + RS) ]
where RS = Average Gain over N periods ÷ Average Loss over N periods
In plain language: when price goes up more than it goes down, RSI climbs toward 100. When price falls more than it rises, RSI drops toward 0.
RSI is a momentum speedometer. It tells you how fast and how hard price has been moving — nothing more.
RSI does not predict the future. It describes the present.
It tells you how much buying or selling pressure has built up over recent candles. What you do with that information is what separates profitable traders from unprofitable ones.
Reading the RSI Scale
The RSI oscillates between 0 and 100. Three zones matter — but what those zones mean is far more nuanced than most traders realize.
- Below 28 → Selling pressure is extreme
- 28 to 78 → Neutral — no strong read
- Above 78 → Buying pressure is extreme
The zones tell you about pressure, not about direction. Pressure can build without price reversing.
This is the distinction that changes everything.
What Most Traders Get Wrong
These are the most common — and most costly — RSI mistakes. If you’ve made them, you’re not alone. They get taught everywhere. But they are wrong.
Myth 1: “Oversold means it’s time to buy”
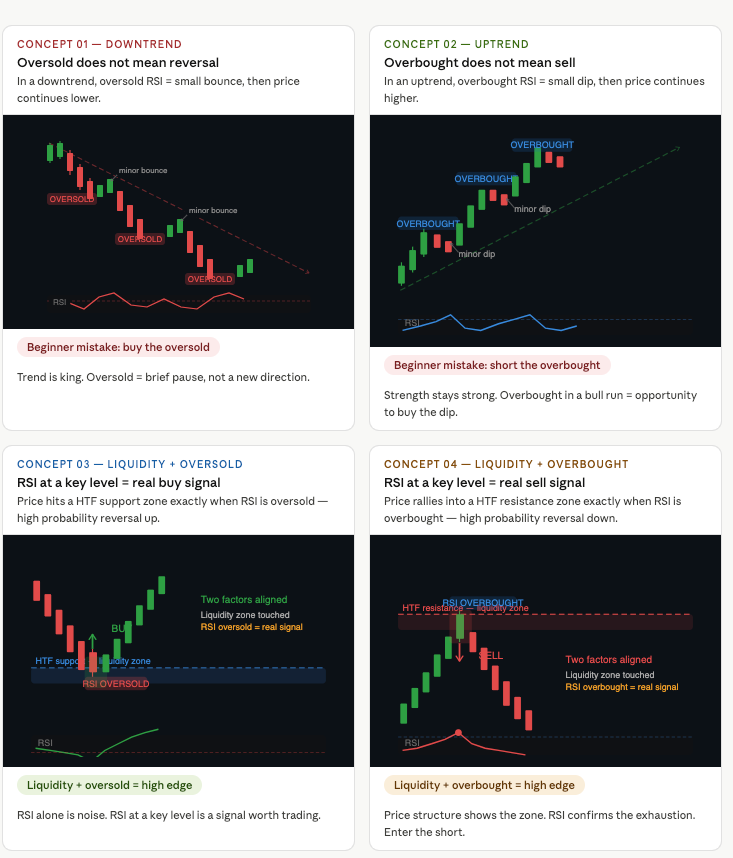
RSI below 30 does not mean price will bounce. In a strong downtrend, RSI can stay oversold for a very long time while price keeps falling. Oversold only means sellers have been aggressive — not that they are finished.
Myth 2: “Overbought means it’s time to sell”
In a strong uptrend, price can stay overbought for dozens of candles. Shorting every RSI spike above 70 in a bull run is a losing strategy. Overbought only means buyers have been aggressive — not that they are done.
Myth 3: “RSI alone is a complete trading system”
RSI has no information about support, resistance, volume, trend direction, or liquidity. Used alone, it creates random entries with no real edge. It is one piece of a puzzle — not the whole picture.
The truth: RSI is a confirmation tool
RSI is best used to confirm what you already see in price structure. It answers one question: “How extreme is this move?” — not “Should I trade here?”
How to Actually Use RSI: 4 Rules
Here are the four principles that separate traders who profit from RSI from those who lose to it.
Rule 1 — Always check the trend first
In an uptrend, an oversold RSI signals a minor pullback — not a reversal. In a downtrend, an overbought RSI signals a minor bounce — not a reversal.
The trend is the context that gives RSI meaning. Without it, the signal is blind.
Rule 2 — Add a liquidity layer
RSI becomes powerful when price reaches a key level at the same time: a higher timeframe high or low, an inside range boundary, or a demand/supply zone.
- RSI at a random spot → noise
- RSI at a liquidity zone → signal
Rule 3 — Oversold usually means small bounce, not reversal
This is the most important and most ignored rule.
Even when RSI is extremely oversold, the default expectation should be a minor pullback. Only upgrade to “full reversal” when context strongly supports it — trend, liquidity, and price structure must all align.
When in doubt, expect small.
Rule 4 — Always protect your trade
Even a high-probability RSI setup can fail. A trailing stop and a hard stop loss are not optional.
RSI tells you when to enter. Risk management tells you how to survive when you’re wrong.
The Same RSI Reading, Two Very Different Outcomes
RSI shows 25 — deeply oversold. What should you do?
It depends entirely on what else is on the chart.
Scenario A — Low probability
- Market context: Clear downtrend
- Key level nearby: No
- RSI reading: 25
Result: Most likely a small 5–10 candle bounce, then continuation lower. Buying here is buying into a falling knife. The oversold reading means sellers have been aggressive — but in a downtrend, they often keep going.
Scenario B — High probability
- Market context: Ranging / structure present
- Key level nearby: Yes — clear higher timeframe support touched
- RSI reading: 25
Result: Three factors aligned — structure, liquidity, and momentum exhaustion. This is the setup worth trading. The RSI is confirming what price structure already told you.
The formula is simple:
RSI extreme + HTF liquidity level = meaningful signal
RSI extreme alone = noise
Final Word
J. Welles Wilder built RSI to answer one question: “How extreme is this price move?”
He never promised it would tell you when to buy or sell.
After almost 50 years, most traders still miss that point. The ones who understand it — who combine RSI with trend awareness, liquidity levels, and proper risk management — are the ones using it as it was always meant to be used:
As one intelligent piece of a bigger picture.
If this changed how you think about RSI, share it with someone who’s still buying every oversold bounce.
메타데이터
- post_id
- f3bf9c81f3af
- slug
- rsi-is-not-what-you-think-it-is-f3bf9c81f3af
- url
- https://medium.com/@algotorma/rsi-is-not-what-you-think-it-is-f3bf9c81f3af
- canonical_url
- https://medium.com/@algotorma/rsi-is-not-what-you-think-it-is-f3bf9c81f3af
- author_url
- https://medium.com/@algotorma
- status
- ok
- fetched_at
- 2026-06-09 15:37:30