Event-Driven Instrumentation: Modern Application Observability with Instana
Authors: Mathew.G.Sujith & Anirudh A R
Event-Driven Instrumentation: Modern Application Observability with Instana
Authors: Mathew.G.Sujith & Anirudh A R
In today’s complex distributed systems, understanding application behavior in production is critical. However, traditional monitoring approaches often force developers to choose between comprehensive visibility and acceptable performance. Event-Driven Instrumentation eliminates this trade-off by providing deep observability with minimal overhead.
This blog explores Event-Driven Instrumentation as a monitoring paradigm, compares it with traditional IL Rewriting approaches, and demonstrates how Instana implements it for .NET applications to deliver production-grade observability.
Important Note: Instana supports both IL Rewriting and Event-Driven Instrumentation approaches. You can use them together or Event-Driven separately depending on your requirements. When both are enabled, Instana intelligently prevents duplicate instrumentation by detecting IL-instrumented libraries and ignoring their corresponding ActivitySources.
Understanding the Evolution: From IL Rewriting to Event-Driven Instrumentation
Traditional Approach: IL Rewriting
IL (Intermediate Language) Rewriting has been the cornerstone of .NET instrumentation since .NET Framework 4.0. It works by intercepting the JIT (Just-In-Time) compilation process and modifying bytecode before it’s compiled to native code.
How IL Rewriting Works
When a method is about to be JIT-compiled, the profiler intercepts and rewrites the IL code:
Original Method:
public int SomeMethod(int someArgument) {
    Console.WriteLine($"Yo: This was {someArgument}");
    return DateTime.Now.Day * someArgument;
}
After IL Rewriting:
public int SomeMethod(int someArgument) {
    object context;
    object result;
    object[] arguments = new object[]{someArgument, null, null};
    try {
        context = Tracer.OnEnter(this, "SomeMethod", arguments);
        Console.WriteLine($"Yo: This was {someArgument}");
        result = DateTime.Now.Day * someArgument;
    }
    catch(Exception e) {
        arguments[1] = e;
    }
    finally {
        arguments[2] = result;
        Tracer.OnExit(this, "SomeMethod", arguments, context);
        return result;
    }
}
Disadvantages of IL Rewriting
While powerful, IL Rewriting comes with significant challenges:
1. Performance Overhead
- Boxing/Unboxing: Value types must be boxed into objects for the arguments array
- Array Allocation: Every instrumented method allocates an object array
- Try-Catch-Finally: Additional exception handling overhead
- Stack Operations: Extra push/pop operations on the evaluation stack
2. Complexity and Maintenance
- Low-Level Programming: Requires deep understanding of IL opcodes and stack-based operations
- Framework Version Sensitivity: Different .NET versions may have different IL structures
- Debugging Difficulty: Modified IL makes debugging more complex
- Code Verification: Can trigger security verification issues
3. Compatibility Issues
- AOT Compilation: Doesn’t work with Ahead-of-Time compiled code
- Trimming: Conflicts with IL trimming in modern .NET
- Native Interop: Complex interactions with P/Invoke and COM
- Security Restrictions: May be blocked in high-security environments
4. Deployment Complexity
- Profiler Registration: Requires COM registration on Windows
- Environment Variables: Must be set before process starts
- Timing Sensitivity: Must attach at process startup
- Multi-Domain Issues: Complex handling in multi-AppDomain scenarios
5. Update Challenges
- Library Changes: Must update instrumentation when libraries change
- Version Compatibility: Need to maintain compatibility matrices
- Testing Burden: Must test against multiple framework versions
- Regression Risk: IL changes can break existing instrumentation
Modern Approach: Event-Driven Instrumentation
Event-Driven Instrumentation represents a paradigm shift that addresses all the limitations of IL Rewriting.
What is Event-Driven Instrumentation?
Event-Driven Instrumentation is a modern approach to application monitoring that responds dynamically to events in your application’s lifecycle. Instead of modifying code (IL Rewriting) or continuously monitoring everything, it intelligently instruments based on:
- Application events (method calls, HTTP requests, database queries)
- Configuration changes (new monitoring rules from your APM platform)
- Runtime conditions (module loading, class initialization)
- Framework-native APIs (ActivitySource, DiagnosticListener)
Core Principles
1. Event-Driven Architecture
The instrumentation system reacts to events rather than modifying code:
Library Event → Detection → Decision → Data Collection → Trace CreationExample Events:
- HTTP request initiated (System.Net.Http emits ActivitySource event)
- Database query executed (SqlClient emits DiagnosticListener event)
- Message published (RabbitMQ emits ActivitySource event)
- gRPC call made (Grpc.Net.Client emits ActivitySource event)
2. Native Framework Integration
Leverages built-in .NET APIs:
- ActivitySource (.NET 6+): Modern distributed tracing API
- DiagnosticListener (.NET Core 1.0+): Event-based diagnostics
- EventSource: High-performance event logging
- No code modification required
3. Selective and Intelligent
Not everything needs monitoring:
- Targets specific operations based on configuration
- Focuses on business-critical paths
- Ignores framework internals automatically
- Prioritizes high-value data
4. Zero-Touch Integration
No application code changes required:
- No SDK dependencies in application code
- No recompilation needed
- No deployment changes
- Works with existing applications
How Event-Driven Instrumentation Solves IL Rewriting Problems
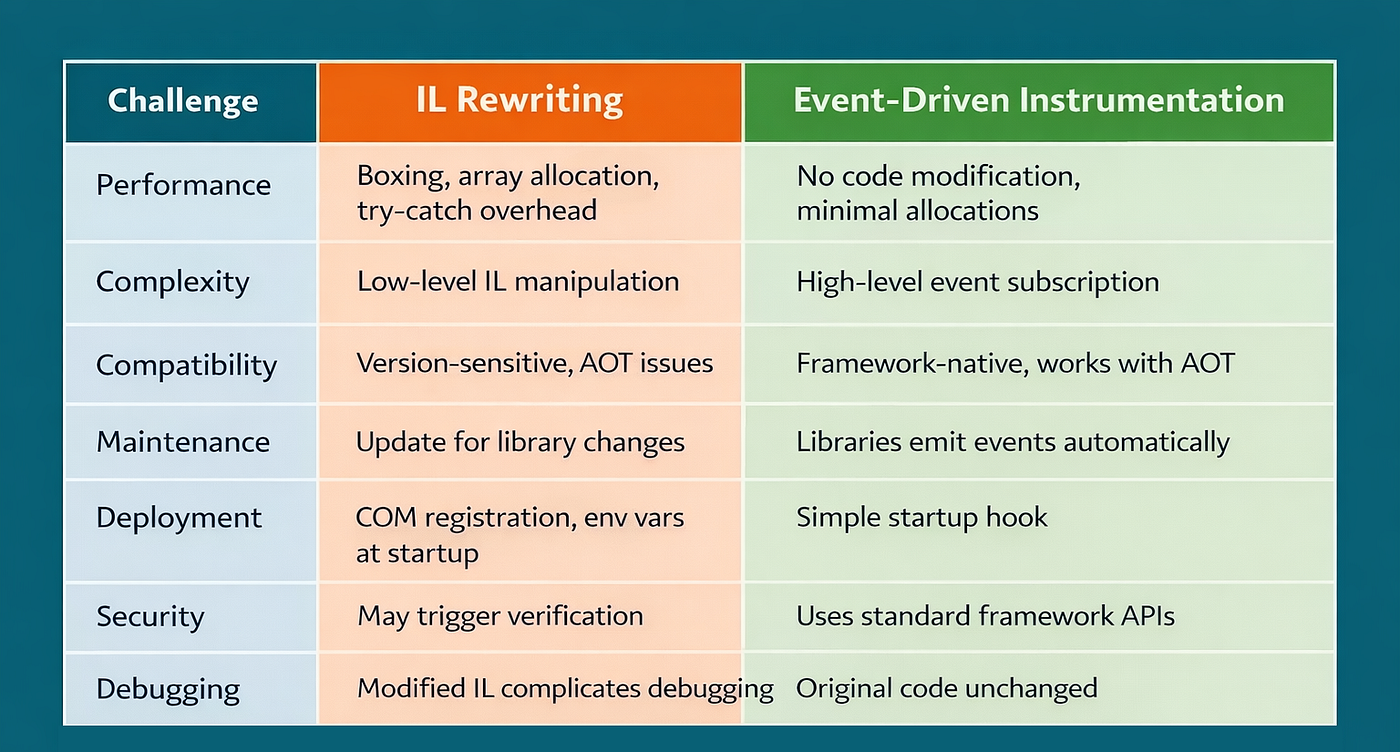
Key Advantages Over IL Rewriting

Technical Implementation in Instana
Architecture Overview

Requirements
To use Event-Driven Instrumentation with Instana, you need:
- .NET Version: .NET 6.0 or later, OR .NET Core 3.1 or later with DiagnosticSource 6.0+ package
- Instana .NET Sensor: Version 1.0.96 or later
Supported Libraries and Frameworks
Please refer https://www.ibm.com/docs/en/instana-observability/current?topic=technologies-monitoring-net-net-core for the list of supported libraries. If Instana is already instrumenting a library using the IL rewriting method, the system ignores the corresponding ActivitySources to prevent duplicate instrumentation.
Environment Variables Configuration
Event-Driven Instrumentation in Instana is configured through environment variables, making it easy to enable and customize without code changes.
Enabling or Disabling Event-Driven Tracing
By default, event-driven instrumentation is disabled. You can explicitly enable it by setting the following environment variable:
# Enable event-driven tracing (disabled by default)
INSTANA_ENABLE_EVENT_TRACING=true
When set to false or removed ,event-driven instrumentation is completely disabled. This is useful for:
- Troubleshooting issues
- Using only IL Rewriting instrumentation
- Testing different instrumentation approaches
Filtering ActivitySource Events
You can control which ActivitySource events to exclude or include by configuring the environment variables as shown in the following examples:
Blacklist Specific Sources
# Exclude specific ActivitySource names (comma-separated)
INSTANA_DOTNET_BLACKLISTED_ACTIVITYSOURCES="MyApp.Internal,ThirdParty.Debug"
Use this to exclude internal or debug ActivitySources that generate noise.
Whitelist Specific Sources
# Include only specific ActivitySource names (comma-separated)
INSTANA_DOTNET_WHITELISTED_ACTIVITYSOURCES="MyApp.Api,MyApp.Services"
If the user wants any activities to generate spans which are already in “Default Blacklist”, you can set this env variable with value as ActivitySourceName.
Default Blacklist
To avoid duplicate instrumentation and unnecessary noise, Instana blacklists the following ActivitySource patterns by default:

These patterns are automatically excluded because:
- They generate low-level internal traces
- They can create noise in trace data
- They may duplicate information from higher-level instrumentation
- They are typically not relevant for application monitoring
Preventing Duplicate Instrumentation
Important: Instana automatically prevents duplicate instrumentation by detecting when libraries are already instrumented with IL rewriting.
When both IL rewriting and event-driven instrumentation are enabled:
- The .NET Tracer intelligently detects IL-instrumented libraries
- It ignores corresponding ActivitySources for those libraries
- This maintains a single trace path
- Prevents duplicate spans and trace pollution
This means you can safely enable both instrumentation methods without worrying about duplicate traces.
Configuration Examples
Example 1: Exclude Internal Services
# Trace everything except internal diagnostics (Separated by comma)
export INSTANA_DOTNET_BLACKLISTED_ACTIVITYSOURCES="MyApp.Internal,Microsoft.AspNetCore.Routing"
Example 2: Trace Specific Operations which are blacklisted by default
# Only trace Threading and socket operations (Separated by comma)
export INSTANA_DOTNET_WHITELISTED_ACTIVITYSOURCES="System.Threading.*,System.Net.Sockets"
Example 3: Enable/Disable Event-Driven Instrumentation
# Enable event-driven instrumentation
export INSTANA_ENABLE_EVENT_TRACING=true

# Completely disable event-driven instrumentation. Disabled by Default
export INSTANA_ENABLE_EVENT_TRACING=false

# OR Remove the env variable
Example 4: Production Configuration
# Typical production setup
export INSTANA_ENABLE_EVENT_TRACING=true
export INSTANA_DOTNET_BLACKLISTED_ACTIVITYSOURCES="Microsoft.AspNetCore.Routing"
Initialization Flow

Event Processing Lifecycle
When an instrumented library performs an operation:
1. Event Emission
// Library code (e.g., HttpClient)
using var activity = activitySource.StartActivity("HTTP GET");
activity?.SetTag("http.url", url);
// ... perform operation
activity?.Stop();
2. ShouldListenTo Callback
Check Blacklist → Check IL Instrumentation → Check Whitelist → Decision3. Sample Callback
Check Parent Context → Apply Sampling Rules → Return Decision4. ActivityStarted Callback
Create Span → Enrich with Tags → Set Context → Store State5. ActivityStopped Callback
Finalize Span → Add Duration → Apply Filters → Send to BackendFiltering Noise
Problem: Too many traces from internal routing operations
Event-Driven Solution:
# Exclude internal routing ActivitySources
export INSTANA_DOTNET_BLACKLISTED_ACTIVITYSOURCES="Microsoft.AspNetCore.Routing,MyApp.Internal"Result: Clean traces focusing on business operations
Best Practices
For Operations Teams
- Start with Defaults: Use Instana’s automatic instrumentation
- Use Filtering: Exclude health checks and static assets early
- Monitor Overhead: Track instrumentation impact with metrics
- Gradual Expansion: Add custom instrumentation incrementally
- Environment-Specific: Use different configs for dev/staging/prod
For Development Teams
- Use ActivitySource: Emit events
- Handle Errors: Ensure exceptions are captured
- Test Locally: Validate instrumentation before deployment
- Document Configuration: Maintain environment variable documentation
For Architecture
- Service Boundaries: Ensure trace context propagation
- Async Patterns: Design for distributed tracing
- Error Handling: Capture exceptions in traces
- Security: Avoid capturing sensitive data
- Performance Budget: Define acceptable overhead
CI/CD & Automated Testing
Validating Event-Driven Instrumentation at Scale
Building support for event‑driven instrumentation is only half the problem; ensuring it works reliably across a constantly evolving ecosystem of libraries is equally critical.
To address this, an automated pipeline is used to continuously discover, validate, and maintain instrumentation coverage for .NET packages.
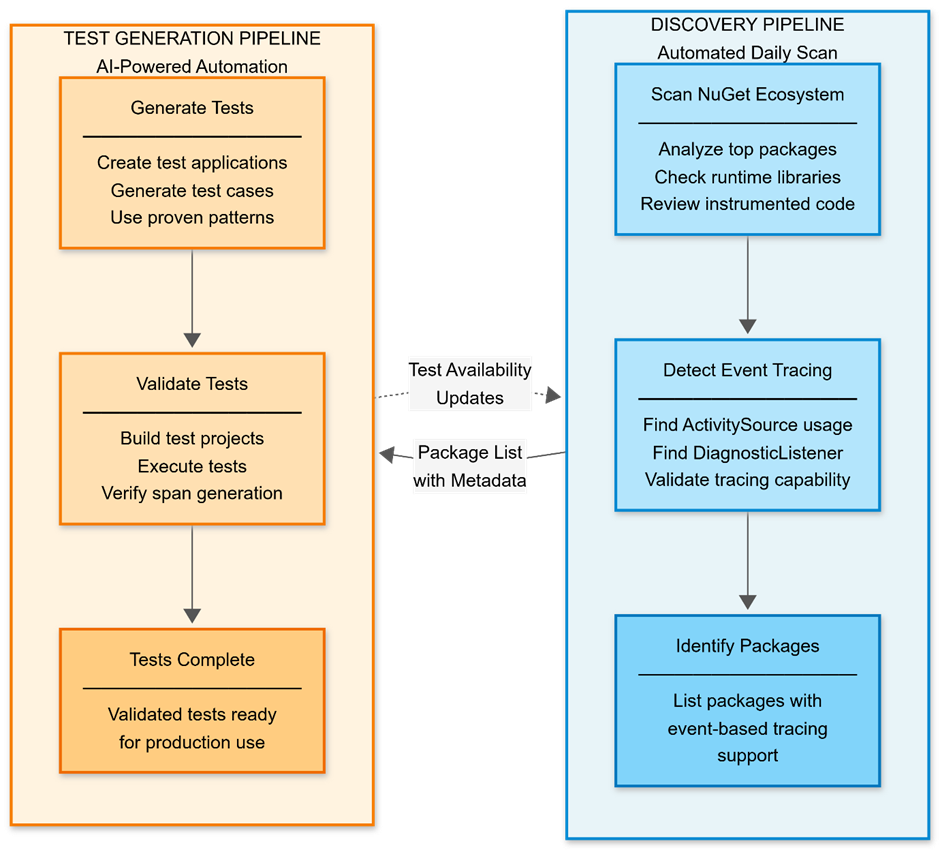
Automated Discovery of Instrumentation Candidates
The first step is identifying libraries that support event-based tracing using native .NET APIs such as ActivitySource.
Assemblies are automatically collected from multiple sources:
- Widely used NuGet packages
- Runtime assemblies
- Pre-instrumented libraries
Each assembly is analyzed to determine whether it emits telemetry via ActivitySource. Libraries that do not meet criteria or are explicitly excluded are filtered out.
This process produces a curated dataset of libraries that support event-driven instrumentation. This dataset serves as the foundation for automated test generation.
AI-Driven Test Generation
Once compatible libraries are identified, integration tests are automatically generated to validate instrumentation behavior.
Using an AI-assisted workflow (powered by Bobshell in CI pipelines), the system:
- Generates integration test projects for each discovered package
- Installs and executes the target library in an isolated environment
- Captures telemetry emitted during execution
The validation strategy is intentionally simple and resilient:
- Verify that spans are emitted when the library is exercised
- Ensure that instrumentation is active and telemetry is being captured
For libraries requiring external dependencies (e.g., databases or messaging systems), the generated tests also include setup instructions to ensure reproducibility.
Controlled Rollout and Continuous Validation
Instrumentation is enabled only for packages that have been tested and verified through this pipeline. This ensures that support is not assumed, but backed by actual execution and validation.
Once a test is in place:
- The package is tracked for version updates
- New versions are automatically picked up by the pipeline
- Tests are re-executed against the latest version
This guarantees that instrumentation remains reliable and up-to-date with the latest versions of each supported library.
Why This Matters
This automated approach enables:
- Scalable validation across a large number of libraries
- Safe and controlled rollout of instrumentation support
- Early detection of regressions caused by dependency updates
- Continuous confidence in instrumentation reliability
By combining event-driven instrumentation with automated validation, it becomes possible to maintain low-overhead, high-confidence observability across modern applications.
Troubleshooting
Common Issues
1. No traces appearing
Check:
# Verify startup hook is set
echo $DOTNET_STARTUP_HOOKS
# Check if event tracing is enabled
echo $INSTANA_ENABLE_EVENT_TRACING2. Missing some operations
Check blacklist:
# Review blacklisted ActivitySources
echo $INSTANA_DOTNET_BLACKLISTED_ACTIVITYSOURCES
# Review whitelisted ActivitySources
echo $INSTANA_DOTNET_WHITELISTED_ACTIVITYSOURCES3. Too many traces
Add filtering:
# Blacklist internal ActivitySources
export INSTANA_DOTNET_BLACKLISTED_ACTIVITYSOURCES="Microsoft.AspNetCore.Routing,MyApp.Internal"
The Future of Event-Driven Instrumentation
Emerging Trends
OpenTelemetry Integration
- Standard ActivitySource API
- Vendor-neutral instrumentation
- Broader ecosystem support
AI-Driven Configuration
- Machine learning to optimize filtering
- Automatic anomaly detection
- Predictive instrumentation
eBPF Integration
- Kernel-level event capture
- Even lower overhead
- Broader system visibility
Continuous Profiling
- Always-on production profiling
- Minimal overhead
- Deeper performance insights
Business Event Correlation
- Link technical traces to business outcomes
- Revenue impact analysis
- Customer experience metrics
Conclusion
Event-Driven Instrumentation represents a significant evolution in application observability. By leveraging native framework APIs instead of modifying code, it achieves:
✅ Superior performance ✅ Zero code changes required ✅ Native framework support (ActivitySource, DiagnosticListener) ✅ Simplified deployment (single environment variable) ✅ Automatic updates (libraries emit events) ✅ Better debugging (original code unchanged) ✅ Comprehensive visibility across the stack
Additional Resources
- Instana .NET Tracer Documentation
- .NET ActivitySource Documentation
- Instana Event Driven Documentation
Event-driven instrumentation is transforming how we monitor and understand applications. With tools like Instana, comprehensive observability is now accessible to every team, with better performance and simpler deployment than ever before.
메타데이터
- post_id
- f4c7394528c6
- slug
- event-driven-instrumentation-modern-application-observability-with-instana-f4c7394528c6
- url
- https://medium.com/ibm-cloud/event-driven-instrumentation-modern-application-observability-with-instana-f4c7394528c6
- canonical_url
- https://medium.com/ibm-cloud/event-driven-instrumentation-modern-application-observability-with-instana-f4c7394528c6
- author_url
- https://medium.com/@mathew.sujith
- status
- ok
- fetched_at
- 2026-06-10 15:53:41