The Week That Was & Will Be — Technical Market Recap and Forward Look
Recap the market for the week of August 19–23, 2024, focusing on Powell’s speech, detailed index performance, continuation of the market…
The Week That Was & Will Be — Technical Market Recap and Forward Look
Recap the market for the week of August 19–23, 2024, focusing on Powell’s speech, detailed index performance, continuation of the market bullish trend, and potential trade ideas: IESC and LNTH.
Economic Data Sources: Investor.com | Edward Jones | CNN

Bottom Line Up Front:
Last week, the stock market concluded on a high note, with the Nasdaq composite, S&P 500, and small-cap stocks posting impressive gains. Federal Reserve Chair Jerome Powell’s highly anticipated speech at the Jackson Hole Economic Policy Symposium last Friday was the catalyst, as his dovish remarks signaled that interest rate cuts are on the horizon.
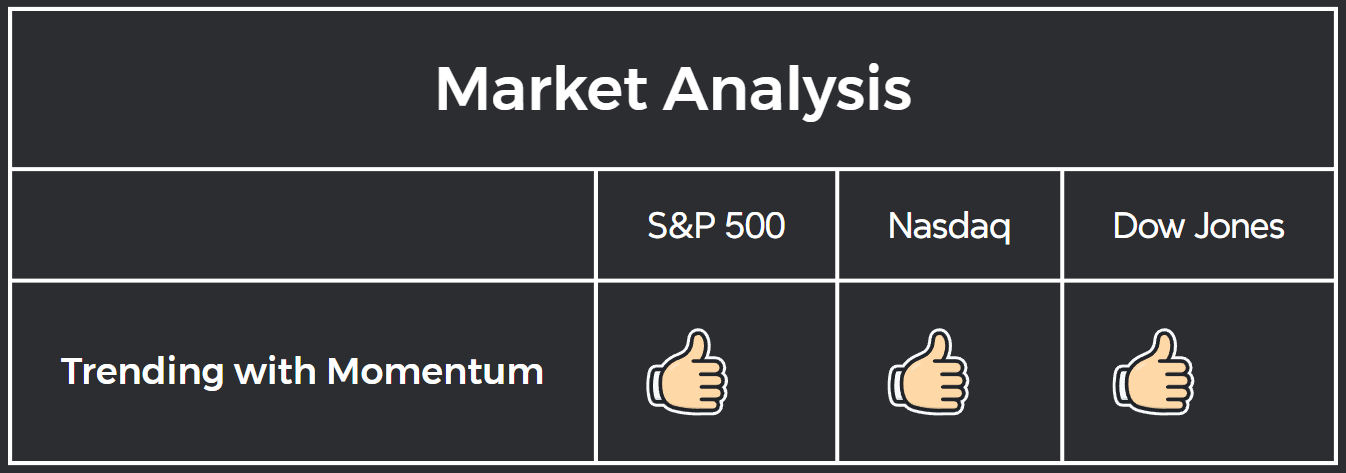
Bull momentum trends for all three markets are confirmed.
Key takeaways:
- All major indices closed above their 50-day/10-week moving averages last week, signaling continue bullish momentum.
- The Nasdaq composite jumped 1.5% last Friday and 1.4% for the week, pushing its year-to-date gain to 19.1%.
- The S&P 500 rose 1.2% last Friday and gained 1.5% for the week, with its year-to-date gain now at 18.1%.
- Small-cap stocks, represented by the Russell 2000, surged 3.2% last Friday.
- Powell’s speech confirmed that rate cuts are imminent, boosting investor sentiment.
- This week’s focus: Digesting Powell’s comments, PCE inflation data release on Friday, and Nvidia’s earnings report.
- Trade ideas: IESC, LNTH
- Watchlist: HACK, CAVA
Background: Fed Chair Powell’s Dovish Remarks Fuel Stock Market Rally
Federal Reserve Chair Jerome Powell’s speech at the Jackson Hole Economic Policy Symposium was the key event that propelled the stock market higher last Friday. In his remarks, Powell clearly indicated that interest rate cuts are on the cards, with the timing and magnitude dependent on incoming economic data.
- Clear signal for rate cuts: Powell stated, “The time has come for policy to adjust. The direction of travel is clear, and the timing and pace of rate cuts will depend on incoming data, the evolving outlook and the balance of risks.”
- Market reaction: Following the speech, the CME FedWatch Tool suggested a 63.5% probability of a 25 basis point cut and a 36.5% chance of a 50 basis point reduction at the next FOMC meeting.
- Economic data in focus: This week’s PCE inflation data, durable goods orders, and consumer confidence reports will play crucial roles in guiding the Fed’s decisions. — The unemployment rate remained below 4% from February 2021 to April 2024. To put this in perspective, the average unemployment rate over the last 40 years has been 5.8%. — Given the low unemployment, the employment side of the Fed’s dual mandate has not required much attention recently. — On the other hand, core CPI (consumer price index) inflation at 3.2%. This is still higher than the 40-year average core inflation rate of 2.9%. As a result, inflation will remain in focus. — Since inflation having declined for four straight month and sitting at it lowest reading since April 2021, some investor are optimistic with rate cut will happen in September.
- Corporate earnings: Nvidia’s quarterly results, due this week, could significantly impact the technology sector and broader market sentiment.
Market Analysis
S&P 500 Performance: Technical Analysis and Key Statistics
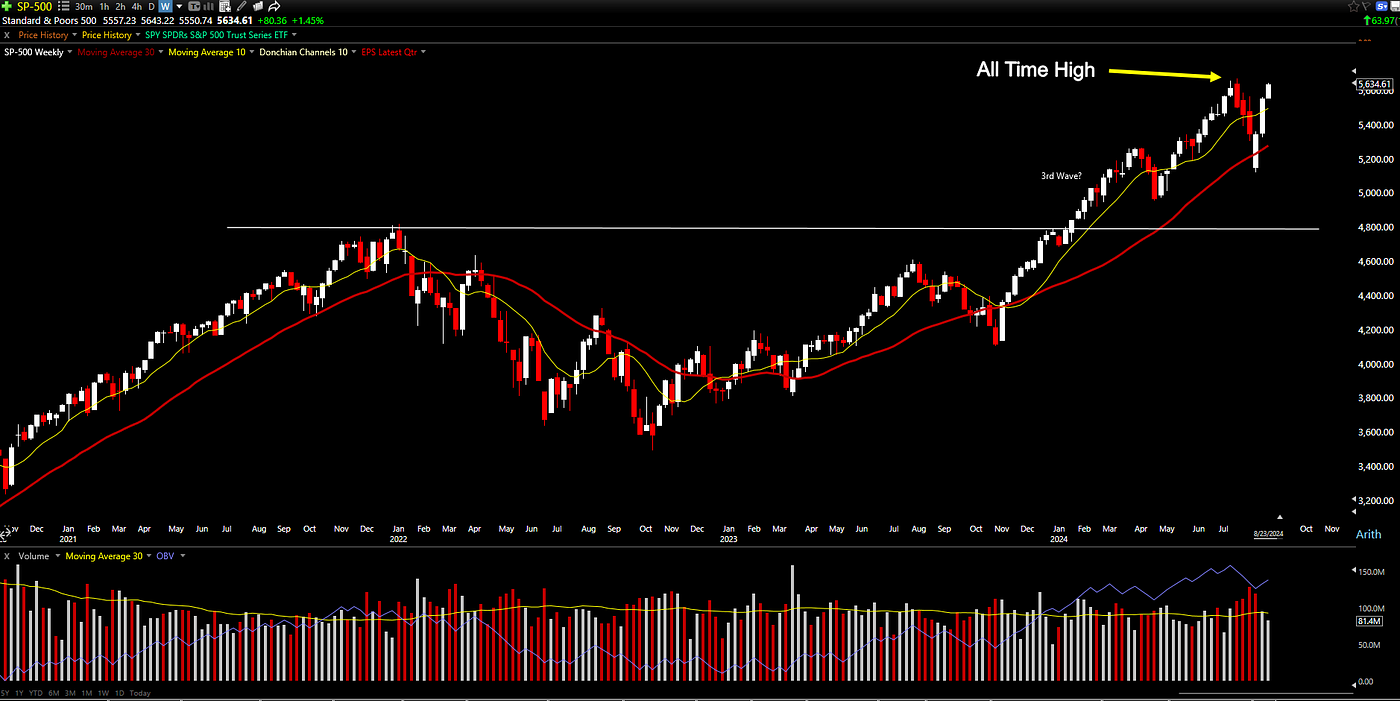
SPX retesting the all time high
The S&P 500 demonstrated impressive strength last week, closing 1.2% higher on Friday and gaining 1.5% for the week.
Technically, the S&P 500 made significant strides:
- It closed comfortably above its short-term and long-term moving averages.
- Year-to-Date Gain: 18.1% as of last Friday.
- The index is now inching closer to all-time high levels.
- 59% of stock in S&P 500 is above 200-day moving average.
Comparing to Other Major Indices: Nasdaq, and Russell 2000
Nasdaq Composite
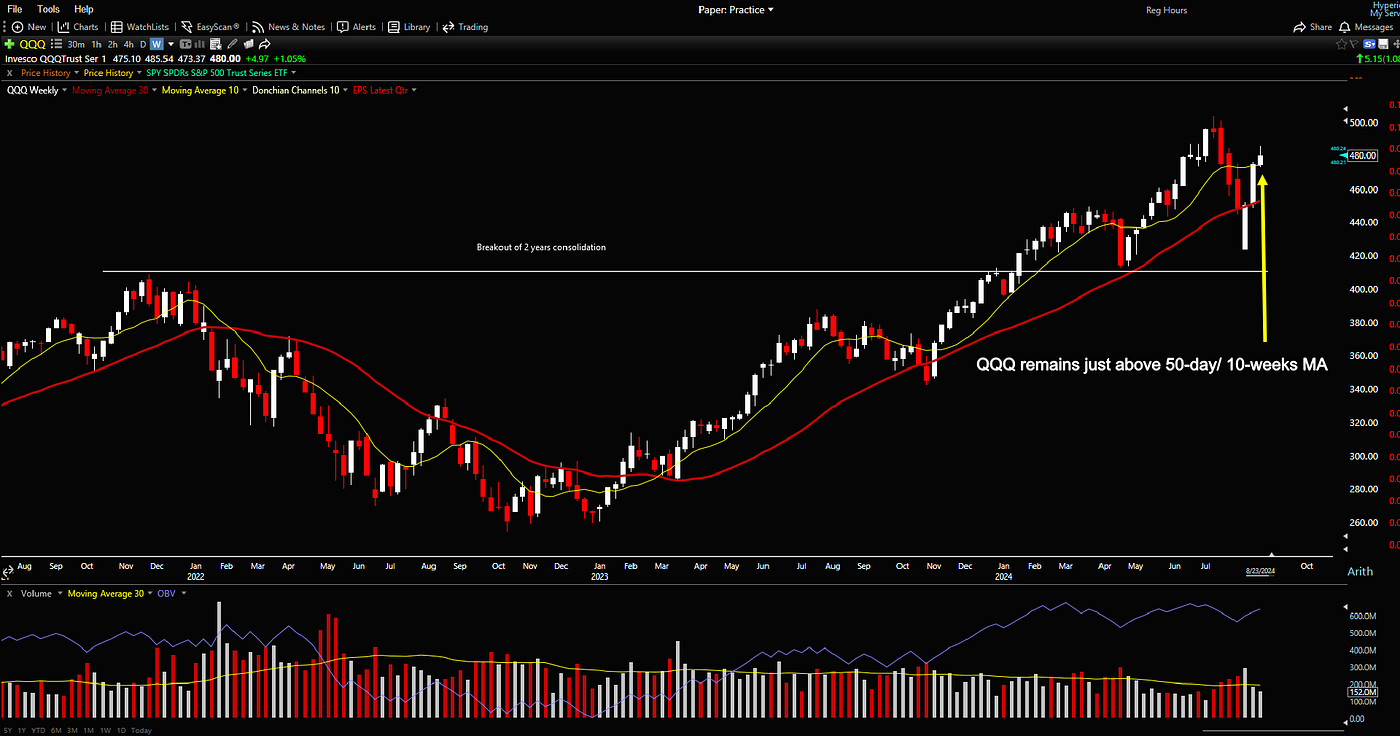
QQQ remains above 50-day/ 10-week MA
- Last Friday’s Performance: Up 1.5%
- Last Week’s Performance: Up 1.4%
- Year-to-Date Gain: 19.1% as of last Friday
- Technical Position: Closed above its 50-day moving average, although remains below recent highs
Russell 2000 (Small-caps)
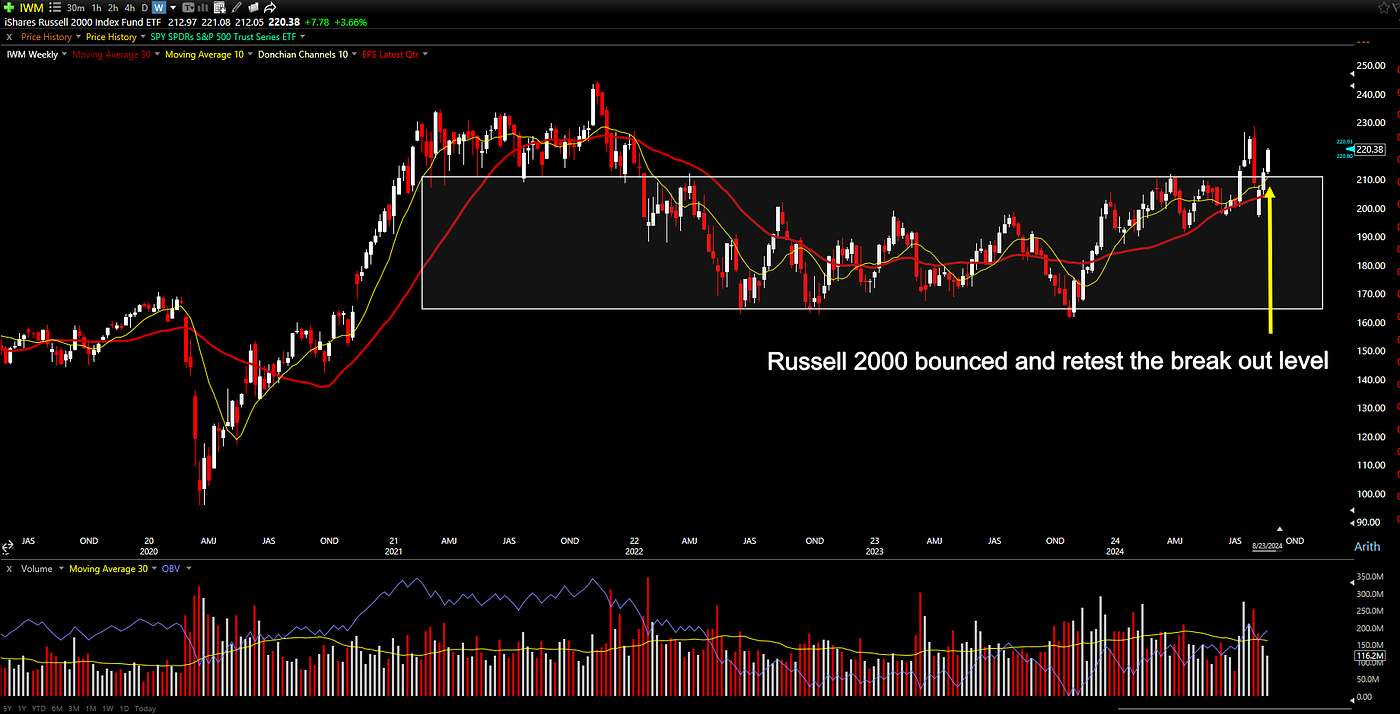
IWM retest the breakout zone. Second entry?
- Last Friday’s Performance: Up 3.2%
- Year-to-Date Gain: 6.86%
- This outperformance suggested growing confidence in economic recovery and increased risk appetite.
Sector Analysis: Growth and Risk-On Sentiment Prevailed
Top Performing Sectors Last Week
- Technology — Benefited from the prospect of lower interest rates
- Consumer Discretionary — Reflected optimism about economic recovery and consumer spending
- Real Estate — Potential beneficiary of lower interest rates
Underperforming Sectors
While all 11 S&P 500 sectors ended last Friday in positive territory, defensive sectors like utilities and consumer staples lagged as investors rotated into more cyclical and growth-oriented sectors.
Looking Ahead: Key Economic Data and Events to Watch This Week
This week features several noteworthy economic indicators and events:
1. Personal Consumption Expenditures Price Index (PCE) (Friday)
- Importance: Fed’s preferred inflation gauge
- Potential Impact: Could influence the pace and timing of rate cuts
2. Durable Goods Orders (Today)
- Importance: Indicator of manufacturing sector health
- Potential Impact: Provides insights into business investment and economic growth
3. The Conference Board’s Consumer Confidence Report (Tomorrow)
- Importance: Gauge of consumer sentiment and spending intentions
- Potential Impact: Could affect expectations for consumer-driven sectors
4. Nvidia Earnings Report (Wednesday)
- Importance: Bellwether for the tech industry
- Potential Impact: Could significantly influence the technology sector and broader market
Stocks in Focus
The market is continuing with its trend. This signal for us also continue to look for new acquisition.
IES Holdings (IESC) — Buy Recommendation
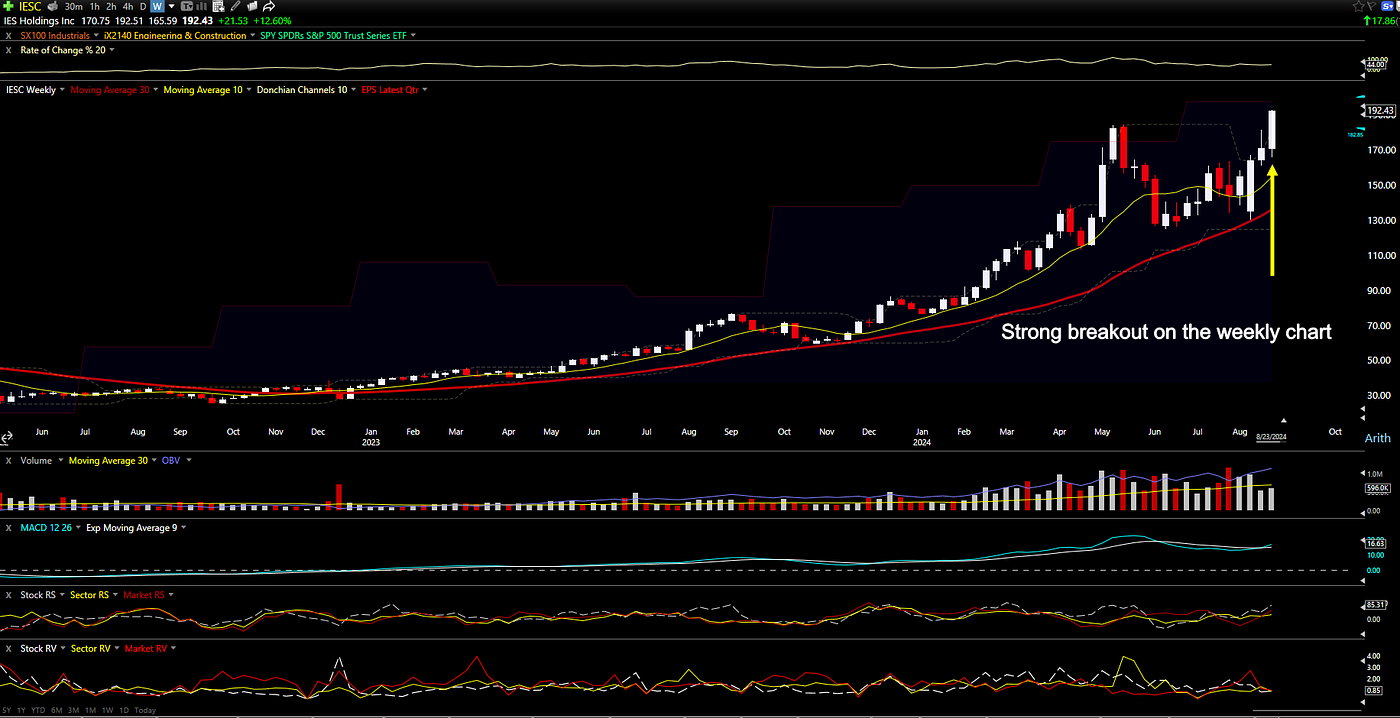
IESC broke out on weekly chart
- IESC gave a buy signal with the breakout last week.
- Technical analysis: — ROC (20) percentage is 44%, which confirms the stock’s momentum. — Solid candlestick on the breakout — Relative strength is above the sector and market
- Points of concern: — The breakout signal does not accompany high volume. — However, I don’t think we need to worry about that. — If we zoom into the daily chart, you’ll see the breakout happened at the end of the week with volume (chart below). — This means that since the breakout signal occurred on the last trading day of the week, the weekly chart was unable to capture the full picture.
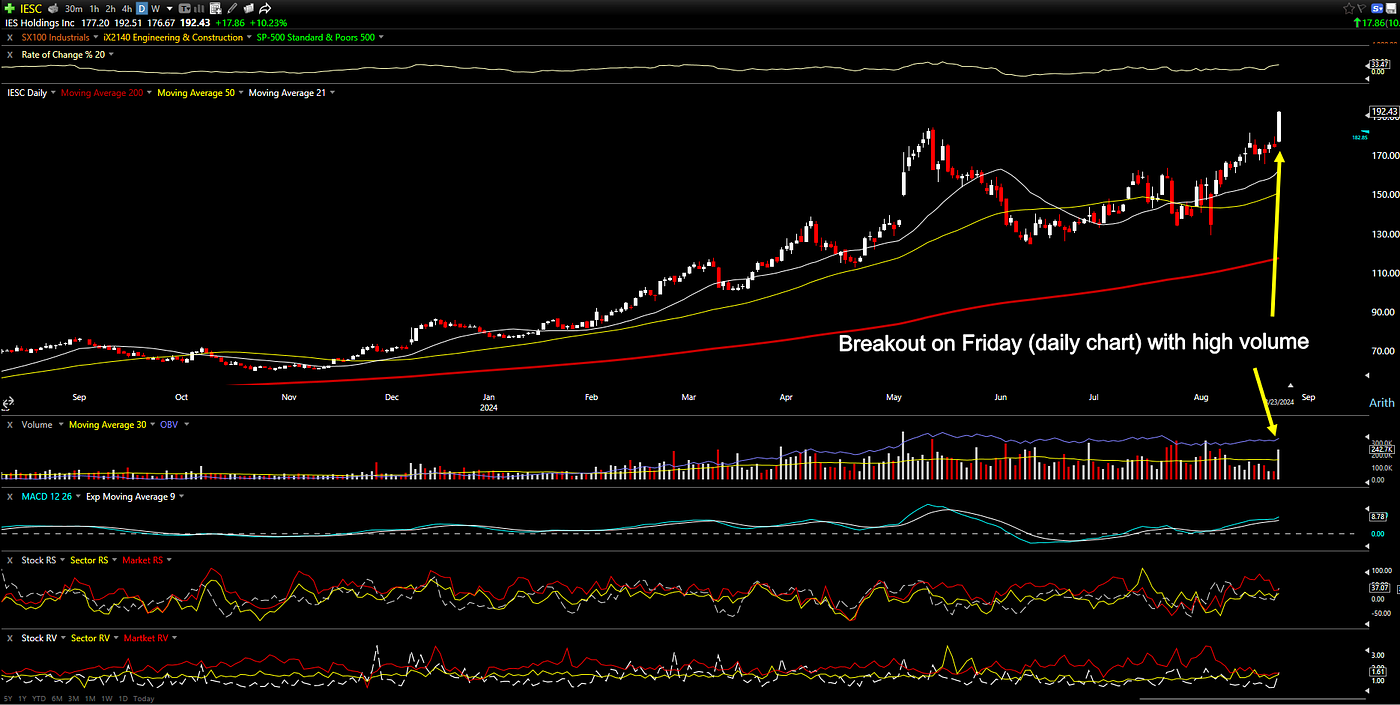
IESC broke out late last week
- Fundamental analysis: — For the last three years, IES Holdings has outperformed its industry, with its earnings growth of 135.6% over the past year exceeding the Construction industry average of 32.5%. — The company has high-quality earnings and growing profit margins, with current net profit margins of 6.3% compared to 3.1% last year.
- Trade outline: — Entry: $192.43 (or current price)
- Initial stop (depending on how aggressive you are, here are some suggestions): — The low of the breakout week: $164.88 — Below the support level at: $154.28 — 30% from the current price: $134.70
- For the trade layout, I will use my normal trading trailing stop rule to determine the position size, which is 30% from the current price: — Risk 2% of the portfolio (based on a $100,000 account): $2,000 — Stop loss: $134.70 — Risk per share: $192.43 — $134.70 = $57.73 — Number of shares allowed for this trade: $2,000 / $57.73 = 34 shares — Total cost for the trade: $192.43 * 34 = $6,576.62
Lantheus Holdings (LNTH) — Buy Recommendation
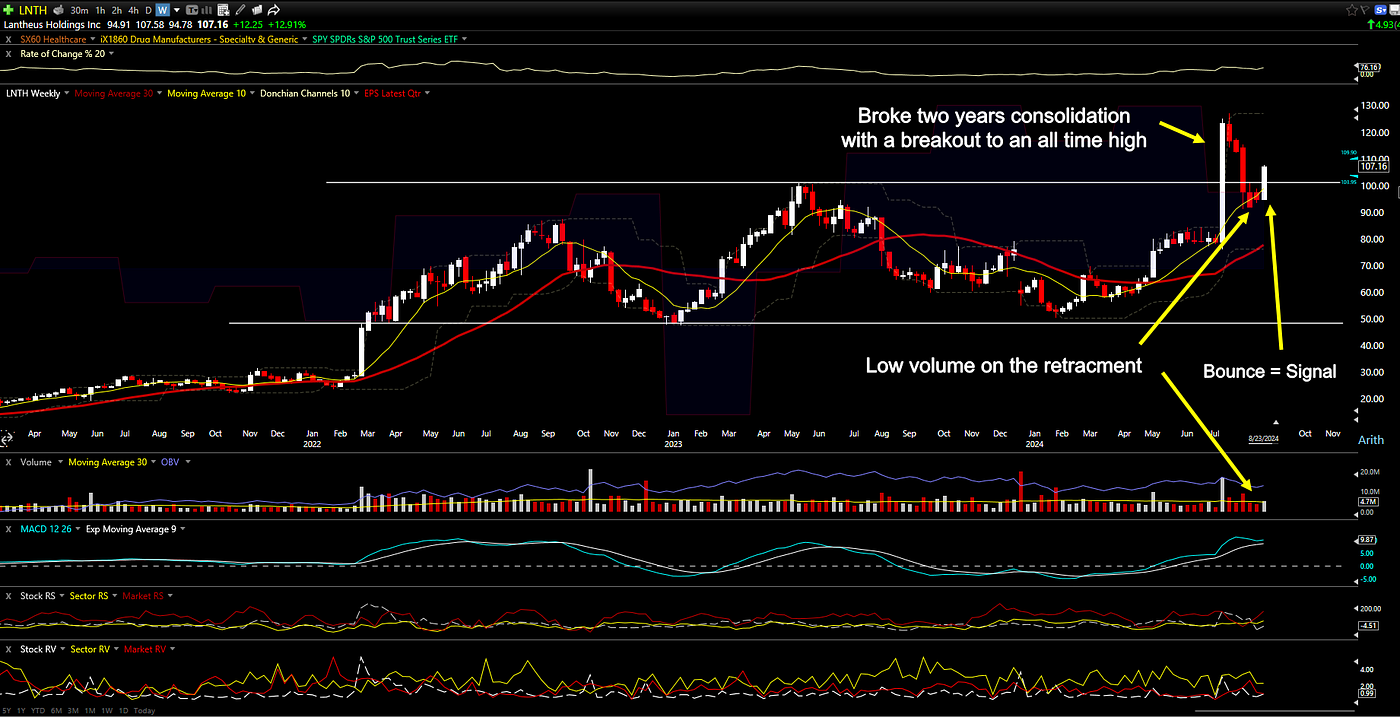
LNTH bounced from the breakout zone
- Technical analysis: — LNTH broke out of a two-year consolidation to an all-time high about six weeks ago. — It started to retrace back to the breakout zone. — Finally, LNTH bounced last week, which is a signal to buy.
- Volume: — During the retracement, we want to see low volume. The reason is we want to see that the majority of buying during the breakout is real and people are holding onto the stock. — This is exactly what we are seeing with LNTH.
- Fundamental analysis: — Lantheus Holdings’ 3-year EPS growth rate is forecast to be 13.9% per annum. — During the past 3 years, Lantheus Holdings’ average Revenue per Share growth rate was 43.30% per year. — Overall, this is a solid company
- Trade outline: — Entry: $107.16 (or current price)
- Initial stop (depending on how aggressive you are, here are some suggestions): — The low of the breakout week: $91.75 — Below the support level at: $91.75 (same as above) — 30% from the current price: $75.00
- For the trade layout, I will use my normal trading trailing stop rule to determine the position size, which is 30% from the current price: — Risk 2% of the portfolio (based on a $100,000 account): $2,000 — Stop loss: $75.00 — Risk per share: $107.16 — $75.00 = $32.16 — Number of shares allowed for this trade: $2,000 / $32.16 = 62 shares — Total cost for the trade: $107.16 * 62 = $6,643.92
Amplify Cybersecurity ETF (HACK) — Add to Watchlist
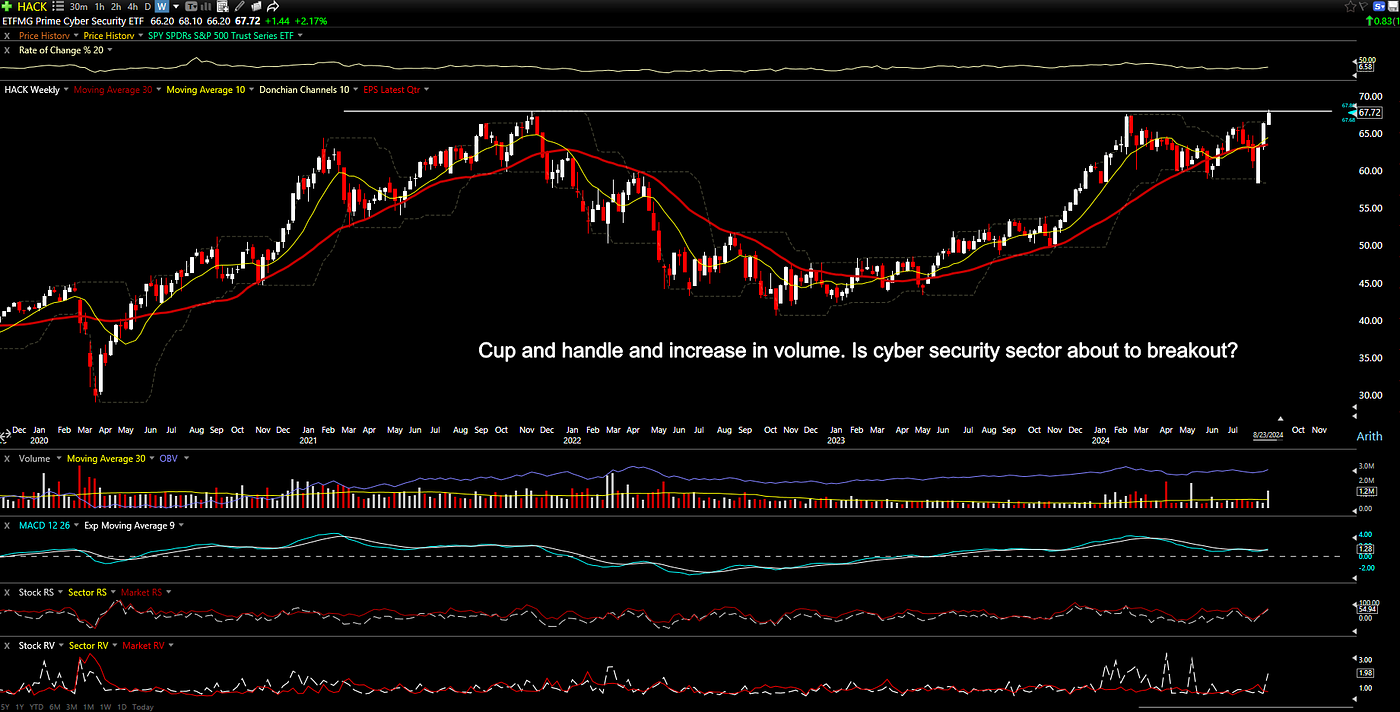
Cyber Security ETF (HACK) forming a cup and handle
- The cybersecurity industry looks very promising.
- I recommend including this ETF in your watchlist.
- The industry is forming a cup and handle pattern with increased volume/interest.
- If this ETF breaks out, you can start looking for opportunities in cybersecurity.
- To give you some idea, here are the top holdings for this ETF: — Broadcom Inc. (AVGO): 9.97% weight — Palo Alto Networks, Inc. (PANW): 6.62% weight — Cisco Systems, Inc. (CSCO): 6.58% weight — Northrop Grumman Corporation (NOC): 5.92% weight — Fortinet, Inc. (FTNT): 5.62% weight
CAVA Group (CAVA) — Add to Watchlist
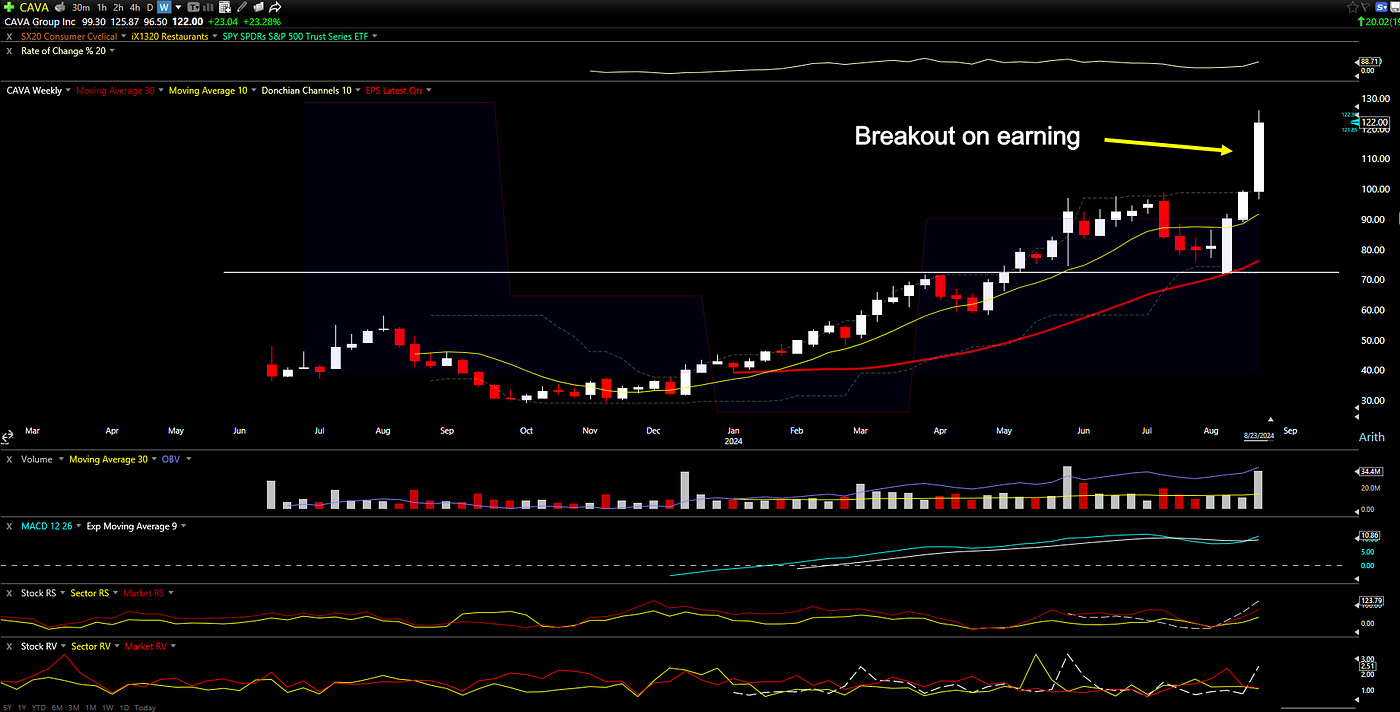
CAVA had breakout 23% after earning
- We discussed CAVA last week and decided to wait until earnings were over. Well, the stock jumped 23.28% due to earnings.
- At this point, it is overextended and we should not chase it. I recommend putting this stock on your watchlist.
- Let’s see if the stock will give us a second chance by retracing back to the breakout area and bouncing.
Conclusion
Last week’s impressive rally, fueled by Powell’s dovish remarks, underscored renewed optimism about economic recovery and monetary policy. The broad-based nature of the gains, with all major indices and sectors posting positive returns, suggested we are continue with risk-on sentiment.
Thank you for joining me this week. Best wishes for everything that you do. Have a wonderful upcoming week.
Disclaimer
The information provided here is for educational and entertainment purposes only and should not be construed as financial advice. I am not a licensed financial advisor, and the content presented does not constitute professional financial guidance. Any financial decisions you make should be based on your own research, judgment, and consultation with qualified professionals. The material shared here may not be suitable for all individuals or situations. Always consider your personal circumstances and seek personalized advice from a certified financial expert before making any investment or financial choices.
메타데이터
- post_id
- f4c81253a42c
- slug
- the-week-that-was-will-be-technical-market-recap-and-forward-look-f4c81253a42c
- url
- https://medium.com/@datng8/the-week-that-was-will-be-technical-market-recap-and-forward-look-f4c81253a42c
- canonical_url
- https://medium.com/@datng8/the-week-that-was-will-be-technical-market-recap-and-forward-look-f4c81253a42c
- author_url
- https://medium.com/@datng8
- status
- ok
- fetched_at
- 2026-07-23 01:15:00




