Quantifying Engineering Excellence: A Practitioner’s Approach to DORA Metrics
Introduction In the current software development climate, the ability to release high-quality features at velocity is the primary…
Quantifying Engineering Excellence: A Practitioner’s Approach to DORA Metrics
Introduction In the current software development climate, the ability to release high-quality features at velocity is the primary differentiator between market leaders and those struggling to stay relevant. Yet, for many engineering organizations, the software delivery lifecycle remains shrouded in ambiguity. Development leads often struggle to prove the impact of their workflows, and SREs frequently navigate production instability without a clear map of systemic deficiencies.
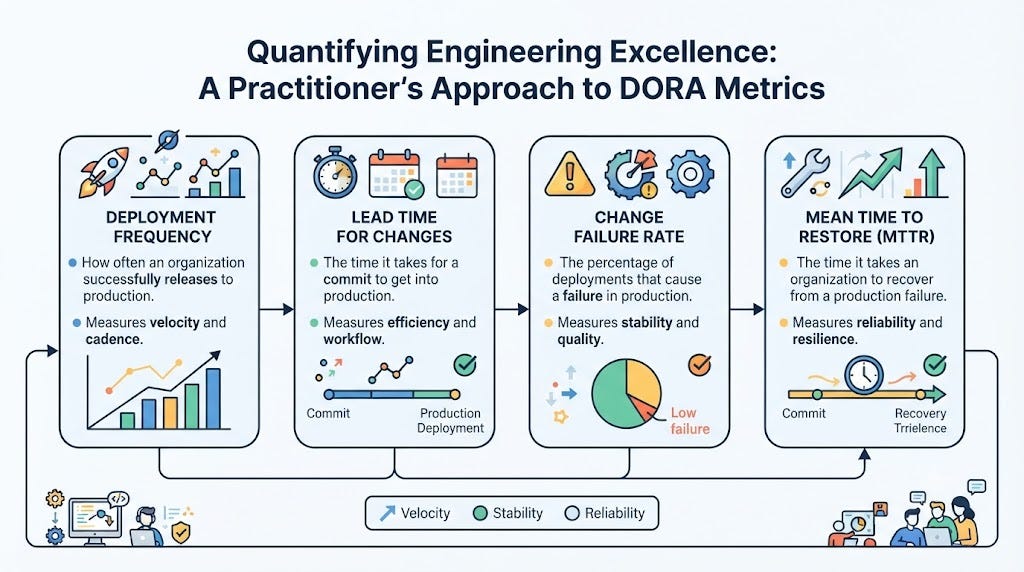
This is where the DORA (DevOps Research and Assessment) framework provides essential clarity. By focusing on four specific indicators — Deployment Frequency, Lead Time for Changes, Change Failure Rate, and Mean Time to Recovery (MTTR) — organizations can shift from anecdotal evidence to data-backed decision-making. In this article, we examine how to operationalize these metrics to foster a culture of sustained high performance.
What are DORA Metrics?
The DORA framework is a set of research-backed benchmarks designed to assess the efficiency and robustness of software delivery teams. Rather than fixating on vanity metrics — such as lines of code written or the number of commits — this framework targets outcomes that reflect actual value delivery and operational health.
- Deployment Frequency: The cadence at which your team successfully promotes code to a production environment.
- Lead Time for Changes: The duration spanning from the moment code is committed to when it is successfully running in production.
- Change Failure Rate: The proportion of production releases that lead to service degradation or require immediate remediation.
- Mean Time to Recovery (MTTR): The average duration required to restore functionality following a service outage.
Why It Matters
Implementing these metrics is not merely about tracking numbers; it is about building an engineering culture centered on feedback loops and resilience.
Business Impact
High-performing organizations use these metrics to reduce time-to-market. Faster lead times mean that customer feedback is incorporated sooner, while lower MTTR ensures that revenue-generating services remain available.
Engineering Impact
DORA metrics provide the “data layer” for engineering arguments. When a team can demonstrate that manual testing phases are inflating lead times, they can make a compelling, objective case for investing in automation.
Operational Impact
The framework inherently forces a balance. Because it tracks both speed (velocity) and stability (quality), it discourages the dangerous practice of “speeding at all costs,” which often leads to technical debt and brittle architectures.
Real-World Use Cases
- Cloud-Native Adoption: Teams migrating to Kubernetes often find that their initial deployment frequency drops due to increased complexity. DORA metrics allow these teams to monitor the “platform tax” and optimize their CI/CD until performance recovers.
- Incident Management: An SRE team struggling with high MTTR might use these metrics to realize that their on-call engineers are lacking clear diagnostics, prompting a shift toward better distributed tracing and logging practices.
- Feature Flagging: Startup teams often use these metrics to validate that feature flagging allows them to increase deployment frequency while keeping the change failure rate near zero.
Benefits
- Data-Driven Prioritization: Allocate engineering resources based on where the pipeline is weakest.
- Systemic Reliability: Shift the focus from individual heroism to building self-healing, observable systems.
- Reduced Friction: By optimizing lead time, you remove the administrative burdens that often frustrate high-performing engineers.
- Cultural Alignment: Move away from “blame culture” by using incident data to drive architectural improvements.
Challenges and Common Mistakes
The “Gaming the System” Problem
If DORA metrics are tied to bonuses or individual appraisals, engineers will find ways to manipulate the data — such as splitting changes into tiny, meaningless commits. These metrics should only be used to facilitate improvement conversations.
Measuring in a Vacuum
DORA metrics lose their power if they are not viewed alongside broader context. For example, a high deployment frequency is meaningless if the code being deployed provides no customer value.
Data Silos
If your deployment data is in one tool, your incident data is in another, and your commits are in a third, the “manual overhead” of calculating these metrics will become the primary reason teams stop using them.
Step-by-Step Implementation Guide
- Map the Delivery Stream: Clearly define where the development process starts (e.g., Pull Request opened) and ends (e.g., Code in Production).
- Unify the Data: Integrate your source control, CI/CD, and ticketing systems into a centralized repository.
- Establish a Baseline: Spend your first month simply observing. Do not attempt to optimize until you have a statistically significant view of your performance.
- Target the Bottleneck: Choose one metric to improve. If your lead time is high, focus on reducing code review times.
- Iterate: Implement the improvement, track the results for several weeks, and repeat.
Best Practices
- Focus on Trends: A single bad week is a data point; a multi-month decline is a trend. Look for systemic signals rather than day-to-day volatility.
- Invest in Tooling: Automate data extraction. If the process of generating a DORA report takes more than five minutes of human effort, it is too complex.
- Communicate, Don’t Mandate: Use these metrics to start conversations during sprint retrospectives.
Measuring Engineering Performance with DevOpsIQ
Gaining a unified view of your delivery health often requires sophisticated aggregation of engineering metadata. DevOpsIQ is an engineering intelligence platform designed to handle this complexity by integrating directly with your existing stack — including GitHub, GitLab, Jira, and Prometheus.
DevOpsIQ enables teams to look beyond the raw numbers. Its Pulse Score feature synthesizes your DORA metrics, SLO health, and incident data into a single, comprehensive indicator of service health. This provides a transparent “health check” for individual services, allowing teams to quickly understand if their current performance meets the necessary reliability standards. By utilizing DevOpsIQ, organizations can eliminate the reliance on manual spreadsheets and subjective reporting, instead relying on precise engineering intelligence to guide their next technical investments.
Learn More with BestDevOps
If you are aiming to master the intricacies of modern software delivery, BestDevOps serves as a centralized hub for engineering excellence. We provide the resources necessary to navigate the complexities of cloud-native development and SRE practices.
Our platform supports your professional growth through:
- Practical Tutorials: Technical deep dives into the tools that define modern DevOps, from container orchestration to CI/CD workflows.
- Curated Roadmaps: Step-by-step guides for mastering specialized domains like Platform Engineering or DevSecOps.
- Hands-on Projects: Real-world scenarios designed to bridge the gap between theory and execution.
- Career Resources: Insights into industry standards, salary expectations, and interview preparation.
- Certification Guidance: Help in choosing and preparing for the credentials that actually matter in the industry.
Whether you are looking to architect a new platform or refine an existing pipeline, BestDevOps offers the educational resources required to ensure your team remains at the forefront of software delivery performance.
Frequently Asked Questions
1. Is it possible to be “too fast” according to DORA?
Yes. If your deployment frequency is high but your change failure rate is also high, your process is unstable. You must prioritize stability as you scale velocity.
2. How do I handle manual approvals in my lead time calculation?
Manual approvals are a major bottleneck. If you must have them, track how long they take as a distinct phase in your lead time measurement.
3. What is the most important DORA metric?
There is no single “most important” metric. They are designed to be a balanced scorecard; focusing on one at the expense of the others creates an incomplete picture.
4. How does DORA apply to SRE teams?
SREs are primarily concerned with MTTR and Change Failure Rate, as these directly correlate to reliability and uptime.
5. Does DORA apply to non-cloud applications?
The principles of fast feedback and stability apply to any software development, though the implementation details of the metrics may change based on your deployment architecture.
6. Can DevOpsIQ help if we use multiple CI/CD tools?
Yes. DevOpsIQ is designed to aggregate data from fragmented environments, providing a single source of truth regardless of your underlying toolchain.
7. How do we start if our incident tracking is inconsistent?
You must standardize your incident management process first. If you don’t track incidents reliably, your MTTR and CFR calculations will be inaccurate.
8. Is DORA a certification?
No, DORA is a research-based framework. While you can get certified in various DevOps tools, DORA is a methodology for performance measurement.
9. Why do my metrics fluctuate so much?
Fluctuations are often caused by seasonal work, major releases, or changes in team size. Look at rolling averages to smooth out this noise.
10. How often should we update our engineering leadership on DORA?
Reporting once a quarter is usually sufficient for high-level stakeholders, while monthly reviews are appropriate for engineering leads to manage team health.
Conclusion
DORA metrics provide the objective framework necessary to shift from reactive firefighting to proactive, intentional engineering. By prioritizing the balance between delivery speed and system stability, organizations can foster a culture that values both agility and resilience. Remember that these metrics are tools for improvement, not weapons for judgment. By implementing these practices and utilizing engineering intelligence effectively, you can build a more productive, reliable, and satisfied engineering organization.
메타데이터
- post_id
- f4df02bebba6
- slug
- quantifying-engineering-excellence-a-practitioners-approach-to-dora-metrics-f4df02bebba6
- url
- https://medium.com/@komal_22744/quantifying-engineering-excellence-a-practitioners-approach-to-dora-metrics-f4df02bebba6
- canonical_url
- https://medium.com/@komal_22744/quantifying-engineering-excellence-a-practitioners-approach-to-dora-metrics-f4df02bebba6
- author_url
- https://medium.com/@komal_22744
- status
- ok
- fetched_at
- 2026-08-03 06:12:15


