Enhancing Extreme Event Detection: A Multi-Scale Wavelet Analysis of Precipitation Dynamics
Accurately identifying extreme weather events requires moving beyond simple magnitude-based thresholds. In climate signals, the temporal…
Enhancing Extreme Event Detection: A Multi-Scale Wavelet Analysis of Precipitation Dynamics
Accurately identifying extreme weather events requires moving beyond simple magnitude-based thresholds. In climate signals, the temporal context of an event is often as critical as its intensity.
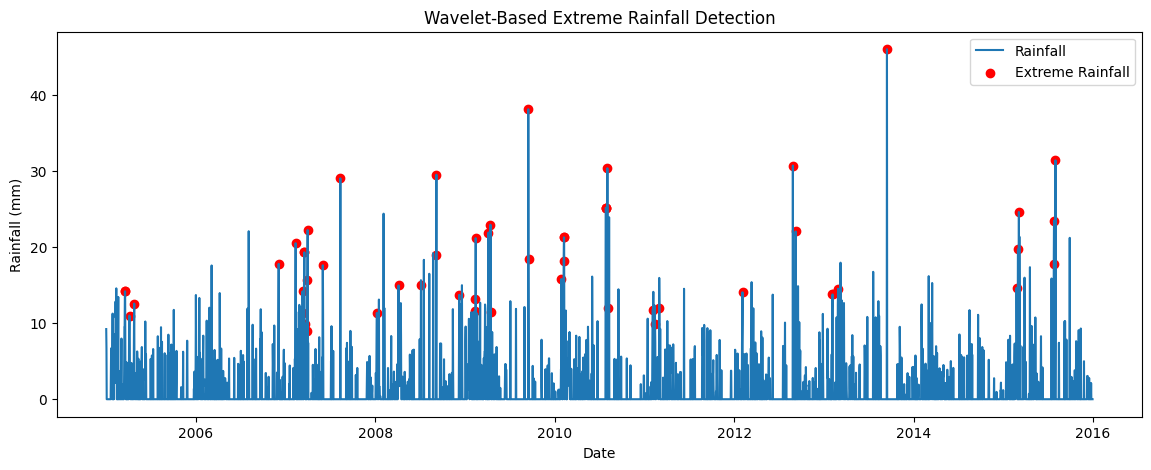
I have developed a diagnostic workflow that integrates Google Earth Engine (GEE) with Continuous Wavelet Transforms (CWT) to isolate high-frequency precipitation shocks within long-term CHIRPS time-series data (2005–2015).
The Methodology: While standard percentiles identify “heavy” rain, Wavelet analysis allows for the decomposition of the signal into both time and frequency domains. By applying a Morlet wavelet, I was able to:
- Differentiate Scales: Separate short-duration, high-intensity “shocks” (flash flood signatures) from broader seasonal periodicities (monsoon cycles).
- Identify Energy Anomalies: Use localized wavelet power to detect “abrupt” weather shifts that traditional stationary models might overlook.
- Adaptive Thresholding: Combine statistical rainfall limits with wavelet energy peaks to filter out seasonal noise and isolate true meteorological extremes.
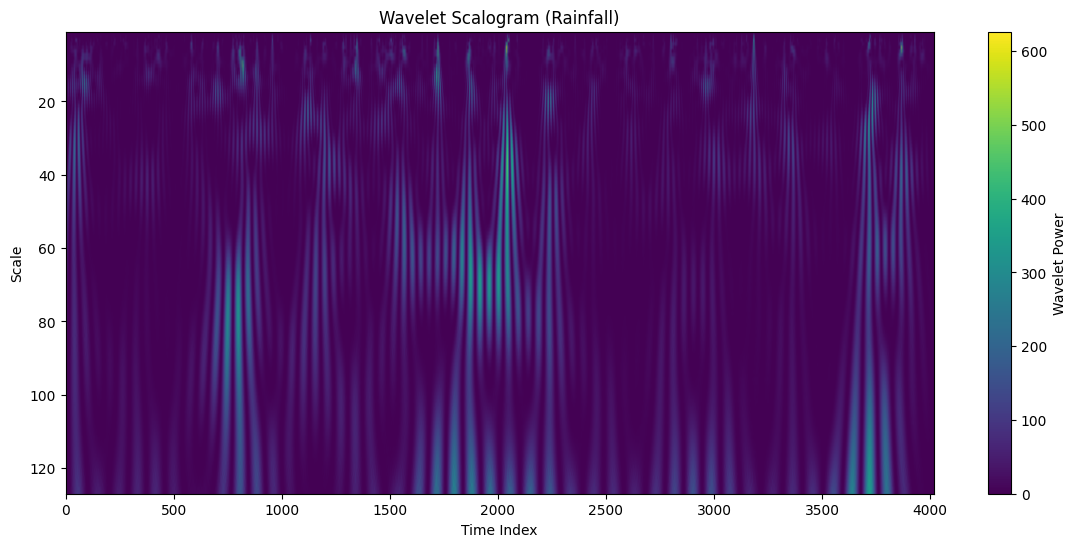
Key Technical Insights: The accompanying Scalogram visualizes the distribution of energy across scales. The vertical “pillars” represent high-frequency energy localized in time, while the broader horizontal bands at higher scales reflect the underlying annual seasonality. This dual-layered approach provides a more robust framework for hydrological risk assessment and climate resilience planning.
Framework:
- Data Acquisition: CHIRPS Daily Precipitation via Google Earth Engine API.
- Signal Processing: Python (PyWavelets) for CWT decomposition.
- Analysis: Multi-criteria filtering using NumPy and Pandas.
Leveraging signal processing in environmental data science allows us to move from simply observing data to understanding the underlying mechanics of climate volatility.
DataScience #ClimateIntelligence #SignalProcessing #Hydrology #RemoteSensing #Python #EarthEngine
# ============================================================
# 0. INSTALL LIBRARIES
# ============================================================
#!pip install earthengine-api geemap pywavelets matplotlib pandas --quiet

# ============================================================
# 1. AUTHENTICATE & INITIALIZE GEE
# ============================================================
#import ee
#try:
    #ee.Initialize(project='ee-afedullah')
#except:
    #ee.Authenticate()
    #ee.Initialize(project='ee-afedullah')

# ============================================================
# 2. EXTRACT CHIRPS RAINFALL TIME SERIES
# ============================================================
import pandas as pd

point = ee.Geometry.Point([72.59, 35.50])

collection = (ee.ImageCollection('UCSB-CHG/CHIRPS/DAILY')
              .filterDate('2005-01-01', '2015-12-31')
              .select('precipitation'))

def extract_ts(img):
    value = img.reduceRegion(
        reducer=ee.Reducer.mean(),
        geometry=point,
        scale=5000
    ).get('precipitation')

    return ee.Feature(None, {
        'date': img.date().format('YYYY-MM-dd'),
        'rain': value
    })

ts = collection.map(extract_ts).getInfo()

dates, rain = [], []
for f in ts['features']:
    dates.append(f['properties']['date'])
    rain.append(f['properties']['rain'])

df = pd.DataFrame({
    'date': pd.to_datetime(dates),
    'rain': rain
}).sort_values('date').reset_index(drop=True)

df['rain'] = df['rain'].fillna(0)

# ============================================================
# 3. TRUE WAVELET TRANSFORM (PyWavelets - MORLET)
# ============================================================
import numpy as np
import pywt
import matplotlib.pyplot as plt

signal = df['rain'].values

scales = np.arange(1, 128)

coefficients, frequencies = pywt.cwt(signal, scales, 'morl')

power = np.abs(coefficients) ** 2

# ============================================================
# 4. EXTREME RAINFALL DETECTION (ONLY WET EXTREMES)
# ============================================================

# Small scales = high-frequency extremes
small_scale_power = power[0:10, :]

# Wavelet energy
energy = small_scale_power.mean(axis=0)

# Adaptive thresholds
energy_threshold = energy.mean() + 2 * energy.std()
rain_threshold = np.percentile(signal, 95)   # extreme rainfall

# Detect ONLY extreme rainfall
extreme_indices = np.where(
    (energy > energy_threshold) &
    (signal > rain_threshold)
)[0]

# ============================================================
# 5. SCALOGRAM
# ============================================================
plt.figure(figsize=(14,6))
plt.imshow(power,
           extent=[0, len(signal), scales.max(), scales.min()],
           aspect='auto')

plt.colorbar(label='Wavelet Power')
plt.title('Wavelet Scalogram (Rainfall)')
plt.xlabel('Time Index')
plt.ylabel('Scale')
plt.show()

# ============================================================
# 6. VISUALIZATION OF EXTREME EVENTS
# ============================================================
plt.figure(figsize=(14,5))

plt.plot(df['date'], signal, label='Rainfall')

plt.scatter(df['date'].iloc[extreme_indices],
            signal[extreme_indices],
            color='red', label='Extreme Rainfall')

plt.legend()
plt.title('Wavelet-Based Extreme Rainfall Detection')
plt.xlabel('Date')
plt.ylabel('Rainfall (mm)')
plt.show()

# ============================================================
# 7. SAVE RESULTS
# ============================================================
df['extreme_rainfall'] = 0
df.loc[extreme_indices, 'extreme_rainfall'] = 1

df.to_csv('extreme_rainfall_wavelet_only.csv', index=False)

print("Extreme rainfall detection complete. File saved.")
메타데이터
- post_id
- f51ef9a3aa5f
- slug
- enhancing-extreme-event-detection-a-multi-scale-wavelet-analysis-of-precipitation-dynamics-f51ef9a3aa5f
- url
- https://medium.com/@afedullah/enhancing-extreme-event-detection-a-multi-scale-wavelet-analysis-of-precipitation-dynamics-f51ef9a3aa5f
- canonical_url
- https://medium.com/@afedullah/enhancing-extreme-event-detection-a-multi-scale-wavelet-analysis-of-precipitation-dynamics-f51ef9a3aa5f
- author_url
- https://medium.com/@afedullah
- status
- ok
- fetched_at
- 2026-07-14 16:11:24