Understanding the Math Behind Multivariate Logistic Regression
Multivariate logistic regression isn’t just about crunching numbers — it’s about making data-driven decisions.
Understanding the Math Behind Multivariate Logistic Regression
Multivariate logistic regression isn’t just about crunching numbers — it’s about making data-driven decisions.
Photo by Antoine Dautry on Unsplash
Picture this: you’re working on a project where you need to predict whether a customer will buy a product, whether a patient is at risk for a disease, or even whether an email is spam. These are all examples of binary classification problems, where the outcome is a simple yes or no. Enter logistic regression, one of the go-to tools for tackling these tasks. But what happens when you’ve got more than one predictor variable to consider — like age, income, and purchase history all at once? That’s where multivariate logistic regression comes into play.
At its core, multivariate logistic regression is just a fancy name for extending the basic idea of logistic regression to handle multiple variables. It’s like giving the model more clues to work with so it can make better predictions. But to really get the most out of it, you’ve got to understand the math behind the scenes — how the model crunches numbers, handles probabilities, and finds the best fit for the data.
In this article, we’ll break down the math of multivariate logistic regression step by step, in a way that’s easy to follow (no Ph.D. required). By the end, you’ll not only understand how it works but also why it’s such a powerful tool in fields like healthcare, finance, and beyond. Let’s dive in!.🚀
What is Multivariate Logistic Regression?
Photo by bruce mars on Unsplash
Let’s start with the basics: logistic regression is a type of statistical model that helps predict probabilities for binary outcomes — think “yes” or “no,” “success” or “failure.” It’s like a smarter version of flipping a coin, where the odds depend on specific factors rather than being a 50/50 guess.
Now, when we say “multivariate” logistic regression, all we’re doing is adding more predictors into the mix. Instead of looking at just one factor, like age, to predict whether someone will buy a product, we might include income, location, and past purchases. The model takes all these variables and tries to figure out how they each contribute to the final probability.
Here’s the cool part: multivariate logistic regression doesn’t just say, “Yes, this customer will buy,” or “No, they won’t.” Instead, it spits out a probability — like, “There’s a 78% chance this person will make a purchase.” This makes it incredibly useful for real-world applications where decisions need to be based on likelihoods rather than certainties.
For example:
- Healthcare: Predicting the likelihood of a disease based on symptoms, family history, and lifestyle.
- Finance: Assessing the risk of loan default by analyzing credit score, income, and spending patterns.
- Marketing: Identifying which customers are most likely to respond to a campaign based on past behavior and demographics.
In short, multivariate logistic regression is like giving your model a whole toolkit of predictors to work with, allowing it to make smarter, more nuanced decisions.
The Mathematical Foundation
Photo by ThisisEngineering on Unsplash
Alright, now that we know what multivariate logistic regression does, let’s peek under the hood to see how it works. Don’t worry — I’ll keep the math as friendly as possible!
The Logistic Function
At the heart of logistic regression is the logistic (or sigmoid) function. It’s a simple equation that takes any number and squashes it into a range between 0 and 1, making it perfect for modeling probabilities. The formula looks like this:
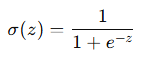
Here, z is just a number that represents a combination of all the predictors and their respective weights. The “e” is that fancy constant from math class (~2.718), which pops up a lot in growth and decay processes.
The beauty of this function is that no matter how big or small zzz gets, the output is always a nice, clean probability between 0 and 1.
The Model Equation
In multivariate logistic regression, we calculate zzz using all the predictors in our dataset. It looks something like this:

- β0: The intercept (kind of like the starting point).
- β1,β2,…,βn: Coefficients that show how much each predictor (like X1, X2) contributes to the outcome.
Once we’ve got z, we plug it into the logistic function to calculate the probability:
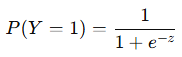
What does this mean in practice? Say we’re trying to predict whether someone will click on an ad. Our z might combine predictors like the user’s age, browsing history, and the time of day. The logistic function then turns z into a probability — like “There’s a 65% chance this person will click.”
Why the Math Matters
The math isn’t just for show — it’s how the model learns what’s important. During training, the algorithm adjusts those β coefficients to find the best fit for the data. If age has a strong influence on the outcome, its β will be larger. If another predictor doesn’t matter much, its β will shrink toward zero.
By understanding these basics, you’re already well on your way to demystifying multivariate logistic regression! Up next, we’ll talk about how the model learns to make these adjustments and finds the best fit for your data.
The Cost Function and Optimization
Photo by Scott Graham on Unsplash
Now that we’ve seen how multivariate logistic regression calculates probabilities, let’s talk about how it learns to make accurate predictions. This is where the magic of optimization comes in!
The Goal: Find the Best Fit
At its core, the goal of logistic regression is to find the best set of coefficients (β) that make the model’s predictions as close to reality as possible. But how do we know if the model is doing a good job? That’s where the cost function comes in.
The Cost Function: Measuring Error
The cost function tells us how “wrong” the model’s predictions are. For logistic regression, this is based on something called the log-likelihood. Instead of just looking at how far off the predictions are (like we do in linear regression), we focus on the probability of the actual outcomes.
Here’s the cost function formula:

Let’s break it down:
- yi: The actual outcome (1 for success, 0 for failure).
- y^i: The predicted probability for y=1.
- The log(y^i) and log(1−y^i) parts make sure we reward the model for being confident and correct while penalizing it for being confident and wrong.
Basically, the cost function measures how well the model’s predictions align with reality, with smaller values being better.
Optimization: Tweaking the Coefficients
Once we know how “wrong” the model is, we need a way to make it better. Enter gradient descent, a popular optimization method that helps the model improve step by step.
Here’s how it works:
- Start with random guesses for the coefficients (β).
- Calculate the cost function to see how bad those guesses are.
- Use gradients (fancy derivatives) to figure out which direction to adjust the coefficients to reduce the error.
- Take a small step in that direction and repeat the process.
Over many iterations, the model hones in on the best set of coefficients that minimize the cost function. Think of it like trying to find the lowest point in a hilly landscape — you take small steps downhill until you reach the bottom.
Why This Matters
The cost function and gradient descent are what make logistic regression tick. They’re the engine that allows the model to learn from data and improve its predictions. Without them, we’d just be guessing blindly.
Next up, we’ll tackle some common issues like multicollinearity and feature scaling — two things that can make or break the optimization process.
Multicollinearity and Feature Scaling
Photo by Towfiqu barbhuiya on Unsplash
Now that we know how multivariate logistic regression learns, let’s talk about a couple of speed bumps that can mess with the process: multicollinearity and feature scaling. Don’t worry, these sound scarier than they actually are, and with a few tweaks, you can handle them like a pro.
Multicollinearity: When Predictors Overlap Too Much
Imagine you’re trying to predict house prices and you include both the house’s square footage and its number of rooms as predictors. These two variables are obviously related — the more rooms a house has, the bigger it’s likely to be. This kind of overlap between predictors is called multicollinearity, and it can confuse your model.
Here’s why it’s a problem:
- When predictors are highly correlated, the model struggles to figure out which one is actually driving the outcome.
- This can lead to wonky coefficients (β) that don’t make much sense or aren’t stable.
How to Handle It:
- Check for Multicollinearity: Use tools like the Variance Inflation Factor (VIF) to spot highly correlated predictors.
- Drop Redundant Variables: If two predictors are telling the same story, consider keeping only one.
- Regularization: Techniques like L1 (Lasso) or L2 (Ridge) regularization can help by shrinking coefficients for less important predictors.
Feature Scaling: Keeping the Playing Field Level
Now let’s talk about feature scaling. Imagine you’re trying to predict something based on two variables: one measured in dollars (e.g., annual income) and one measured in centimeters (e.g., height). The income numbers might range from 10,000 to 100,000, while height might only vary from 150 to 200. These wildly different scales can throw off the optimization process.
Here’s why:
- Logistic regression uses gradient descent, which involves updating coefficients based on the size of their contribution to the cost function.
- If one variable has much larger numbers than another, its coefficient updates will dominate the learning process, even if it’s not the most important predictor.
How to Fix It:
- Standardization: Scale your predictors to have a mean of 0 and a standard deviation of 1.
- Normalization: Rescale the variables to fit within a 0 to 1 range.
Both methods make sure every predictor gets a fair shot during training, so the model doesn’t play favorites just because one variable has bigger numbers.
Why These Tweaks Matter
Think of multicollinearity and scaling like obstacles on a running track. If you don’t address them, they’ll slow your model down — or worse, trip it up completely. But with some quick checks and adjustments, you can smooth the path and ensure your multivariate logistic regression performs at its best.
Next, we’ll dive into how to measure your model’s performance and make sure it’s actually doing a good job.
Evaluating Model Performance
Photo by Jeswin Thomas on Unsplash
Alright, so you’ve built your multivariate logistic regression model. Now comes the big question: is it actually good at making predictions? To figure that out, we need to evaluate its performance. Let’s break this down into a few key steps.
Metrics for Evaluation
When it comes to assessing your model, accuracy alone doesn’t cut it — especially if you’re dealing with imbalanced data (e.g., 95% of customers don’t churn, but 5% do). Here are some better metrics to use:
- Precision: Out of all the positive predictions, how many were actually correct? Great for situations where false positives are costly (e.g., flagging someone as a fraudster).

2. Recall (Sensitivity): Out of all the actual positives, how many did the model catch? Perfect for use cases like disease detection where missing positives is a big deal.

- F1-Score: A balance between precision and recall — great when you need to weigh both equally.
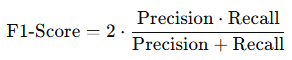
4. AUC-ROC (Area Under the Curve — Receiver Operating Characteristic): This measures how well your model separates positive and negative classes. A score of 1 means your model is perfect; 0.5 means it’s no better than random guessing.
Cross-Validation: Stress-Testing Your Model
To make sure your model isn’t just memorizing the training data (aka overfitting), use cross-validation. This involves splitting your data into several chunks, training the model on some, and testing it on the rest. By rotating through all the chunks, you get a better sense of how well your model will perform on new, unseen data.
Interpreting Coefficients
One of the great things about logistic regression is that it’s pretty interpretable. Each coefficient (β) represents how much a predictor contributes to the odds of the outcome.
Here’s the key:
- The coefficients are in terms of log-odds.
- To make them more intuitive, you can exponentiate them (e^β) to interpret them as odds ratios. For example, if e^β=1.5, it means a one-unit increase in that predictor increases the odds of the outcome by 50%.
Why This Matters
Evaluating your model isn’t just about numbers — it’s about making sure it’s reliable, robust, and ready to solve real-world problems. After all, a great model isn’t just one that works on your training data; it’s one that makes accurate predictions out in the wild.
Next, we’ll take a look at some real-world applications of multivariate logistic regression and how it’s making a difference in different industries.
Real-World Applications
Photo by Balázs Kétyi on Unsplash
Now that we’ve covered how multivariate logistic regression works and how to evaluate it, let’s see it in action. This model isn’t just a theoretical tool — it’s solving real-world problems every day across different industries. Here are some examples to show just how versatile and powerful it can be.
1. Predicting Customer Churn
Every business wants to keep its customers, but how do you figure out which ones are at risk of leaving? Multivariate logistic regression can help by analyzing factors like:
- How often a customer interacts with the service.
- Whether they’ve recently contacted support.
- Changes in their spending habits.
By identifying the most likely churners, businesses can take proactive steps — like offering discounts or personalized support — to keep them on board.
2. Medical Diagnosis and Risk Prediction
Healthcare is another field where logistic regression shines. Let’s say you’re predicting the risk of heart disease. The model can combine multiple factors like:
- Age.
- Blood pressure.
- Cholesterol levels.
- Family history of heart disease.
The output? A probability score that helps doctors prioritize high-risk patients and make more informed decisions.
3. Fraud Detection in Finance
In the world of banking and finance, spotting fraud quickly is crucial. Logistic regression models can analyze transaction data, looking at predictors like:
- Transaction amount.
- Location.
- Time of day.
When the model detects a pattern that looks suspicious, it flags the transaction for further review, helping protect customers and businesses from losses.
4. Marketing and Customer Segmentation
Marketers use multivariate logistic regression to figure out which customers are most likely to respond to a campaign. By analyzing predictors like:
- Past purchases.
- Demographic data.
- Website browsing behavior.
The model can help target the right audience, boosting the effectiveness of marketing efforts and reducing wasted spend.
5. Employee Retention
HR departments can use logistic regression to predict which employees are at risk of leaving based on factors like:
- Job satisfaction scores.
- Time since last promotion.
- Salary changes compared to peers.
This helps companies take preventive actions, like offering better incentives or addressing workplace issues, to retain valuable talent.
Why It’s So Useful
Multivariate logistic regression isn’t just about crunching numbers — it’s about making data-driven decisions. Whether it’s saving lives, preventing fraud, or improving customer satisfaction, this model empowers organizations to focus their efforts where they’re needed most.
In the next section, we’ll look at some common challenges you might run into and share tips for overcoming them.
Challenges and Tips for Success
Photo by Desola Lanre-Ologun on Unsplash
Multivariate logistic regression is an amazing tool, but like any method, it’s not without its challenges. Let’s talk about some common roadblocks you might face and how to tackle them like a pro.
1. Imbalanced Data
One of the biggest headaches is when your data has way more of one outcome than the other. For example, if only 5% of your customers churn, your model might just predict “no churn” all the time and still look like it’s performing well.
How to Fix It:
- Resampling: Use techniques like oversampling the minority class (e.g., SMOTE) or undersampling the majority class to balance things out.
- Class Weights: Many algorithms let you assign higher weights to the minority class so the model pays more attention to it.
2. Overfitting
When your model is too good at memorizing the training data, it can struggle with new, unseen data. This is called overfitting, and it’s like trying to ace every test question instead of learning the overall material.
How to Fix It:
- Regularization: Add L1 (Lasso) or L2 (Ridge) penalties to shrink less important coefficients.
- Cross-Validation: Use techniques like k-fold cross-validation to ensure your model performs well on different subsets of data.
3. Multicollinearity
We’ve talked about this earlier, but it’s worth revisiting. When predictors are highly correlated, the model has a hard time deciding which one is actually important.
How to Fix It:
- Check for multicollinearity using the Variance Inflation Factor (VIF).
- Remove or combine predictors that overlap too much.
4. Interpreting Coefficients
Log-odds aren’t exactly intuitive. If you’re trying to explain the results to non-technical stakeholders, they might get lost in the math.
How to Fix It:
- Convert coefficients to odds ratios for a more intuitive explanation. For example, say something like, “A one-unit increase in age increases the odds of the outcome by 20%.”
- Visualize the relationships using charts or graphs — sometimes a picture really is worth a thousand words.
5. Feature Selection
Throwing every possible variable into your model might sound like a good idea, but it often leads to noise and complexity that can hurt performance.
How to Fix It:
- Use techniques like forward selection, backward elimination, or Lasso regularization to focus on the most important predictors.
- Lean on domain knowledge to decide which features make sense for the problem.
6. Scaling for Large Datasets
When working with big datasets, optimization can take forever, especially if the predictors aren’t scaled properly.
How to Fix It:
- Always standardize or normalize your features.
- Consider using algorithms designed for scalability, like stochastic gradient descent (SGD).
Challenges like these are a normal part of working with any model, not just logistic regression. The key is to approach them step by step, using tools and techniques to refine your model and improve its performance. Once you get the hang of it, these obstacles will feel less like roadblocks and more like opportunities to learn and grow as a data scientist!
In the final section, we’ll wrap things up with a quick recap and some resources for diving deeper into multivariate logistic regression.
Conclusion
And there you have it — a complete walkthrough of multivariate logistic regression! From understanding the basics to tackling challenges, you’re now equipped with the knowledge to confidently build and evaluate this powerful model.
Here’s the quick recap:
- What It Does: Logistic regression predicts probabilities for binary outcomes (yes/no, success/failure).
- How It Works: By combining predictors, applying a logistic function, and optimizing coefficients to minimize error.
- Key Challenges: Multicollinearity, imbalanced data, scaling issues, and overfitting — but all solvable with the right tools.
- Real-World Impact: Whether it’s detecting fraud, predicting customer churn, or aiding medical decisions, logistic regression is all about using data to drive meaningful insights.
If you’re just getting started, don’t worry — this stuff takes practice. The best way to solidify your understanding is to get hands-on. Find a dataset, experiment with building a model, and play around with different techniques for optimization and evaluation.
As you dig deeper, you’ll see why logistic regression is such a favorite among data scientists. It’s simple, powerful, and surprisingly versatile. So go ahead — start exploring, keep learning, and enjoy the journey into the world of data!
Happy modeling! 🚀
메타데이터
- post_id
- f5694b11c043
- slug
- understanding-the-math-behind-multivariate-logistic-regression-f5694b11c043
- url
- https://medium.com/@ujangriswanto08/understanding-the-math-behind-multivariate-logistic-regression-f5694b11c043
- canonical_url
- https://medium.com/@ujangriswanto08/understanding-the-math-behind-multivariate-logistic-regression-f5694b11c043
- author_url
- https://medium.com/@ujangriswanto08
- status
- ok
- fetched_at
- 2026-07-11 14:44:29