What do AI benchmark scores actually mean? A plain-English guide
plain-English guide to what AI benchmark scores like MMLU, GPQA, SWE-bench, ARC-AGI, and Arena Elo actually measure, why the differences…
What do AI benchmark scores actually mean? A plain-English guide
plain-English guide to what AI benchmark scores like MMLU, GPQA, SWE-bench, ARC-AGI, and Arena Elo actually measure, why the differences between top models are often noise, and how to read a benchmark claim without getting fooled.
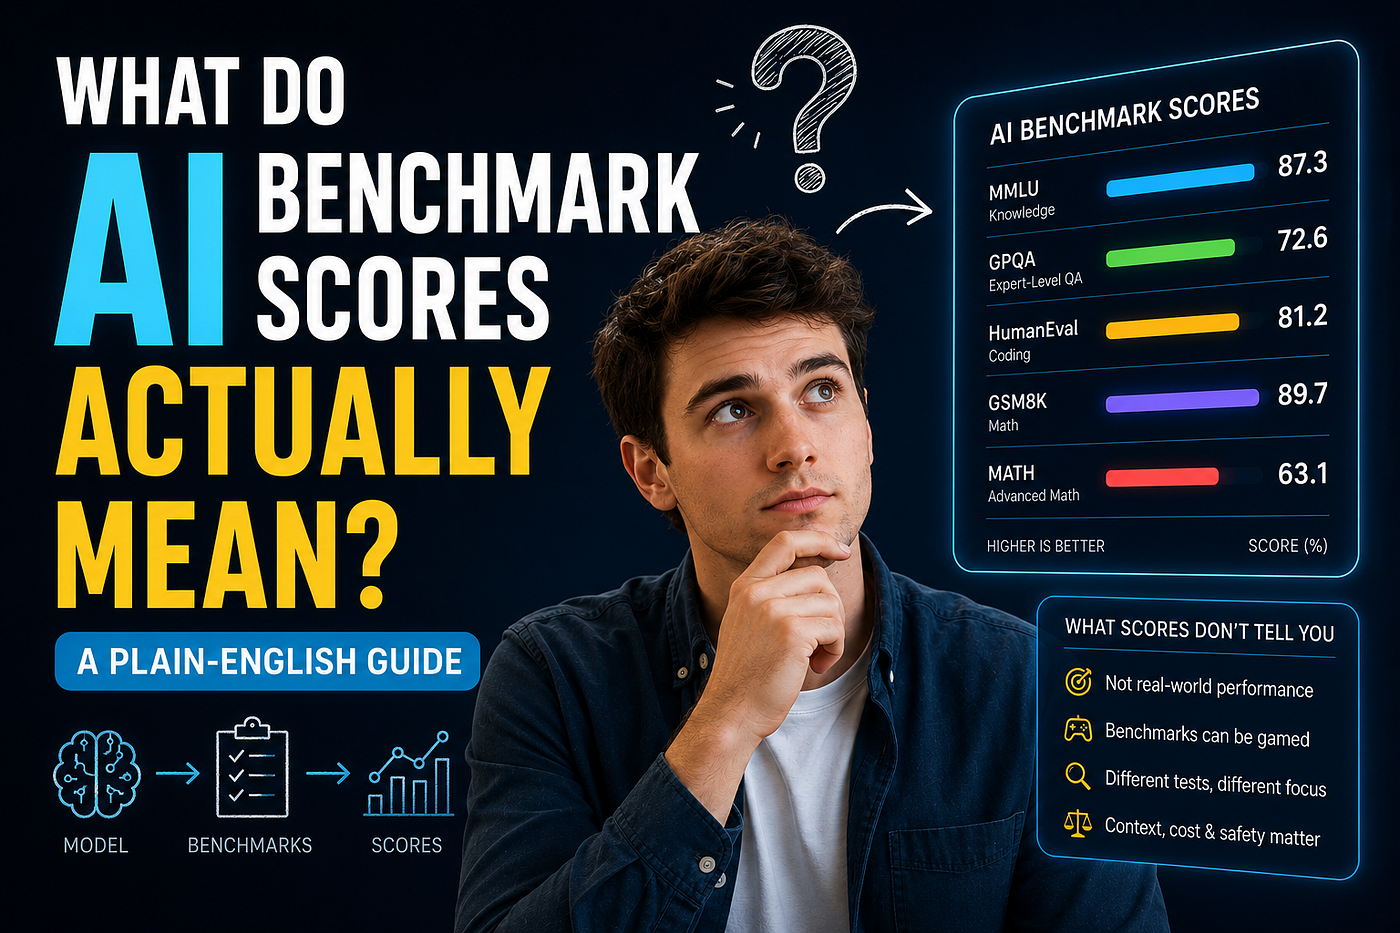
A friend sent me a screenshot last week: a new model launch, a bar chart, five benchmark names she’d never heard of, and a caption claiming “state of the art.” Her question was simple and completely fair: does this number mean the model is smart, or does it mean the company that made it is good at picking favorable comparisons?
Both, usually, and telling them apart is the actual skill here. Benchmark scores aren’t lies, but they’re also not the clean report card the marketing implies. A model can genuinely lead one benchmark and lose badly on the exact skill you care about, and both facts can be true on the same launch day. This guide walks through what these numbers actually measure, why the gap between two impressive-sounding scores is often statistical noise, and how to read a claim like an evaluator instead of a fan.
The short version
A benchmark score tells you how a model performed on one specific, fixed set of tasks, scored one specific way, often using an evaluation setup the model’s own creator chose. That’s it. It’s not a measure of intelligence, and a one or two point lead almost never means what the headline implies. The benchmarks worth trusting in 2026 are the ones actively fighting contamination and gaming, and even those need to be read alongside a cost and reliability picture, not in isolation.
What a benchmark actually is, mechanically
Strip away the branding and a benchmark is just a test with an answer key. Someone writes a set of questions or tasks, decides what counts as correct, runs a model against every item, and reports the percentage it got right. The variation between benchmarks is entirely in what kind of questions they ask and how strict that answer key is.
Some are multiple choice, which is easy to grade automatically but rewards guessing and pattern matching over real reasoning. Some are open-ended tasks graded by another AI model acting as a judge, which scales well but inherits whatever biases that judge model has. Some are graded by real human experts comparing a model’s work against a professional’s, which is the most trustworthy signal and also the slowest and most expensive to run. And some, increasingly the ones that matter most in 2026, are graded by whether the model’s output actually works: does the code pass the test suite, does the agent complete the task, does the booking actually go through.

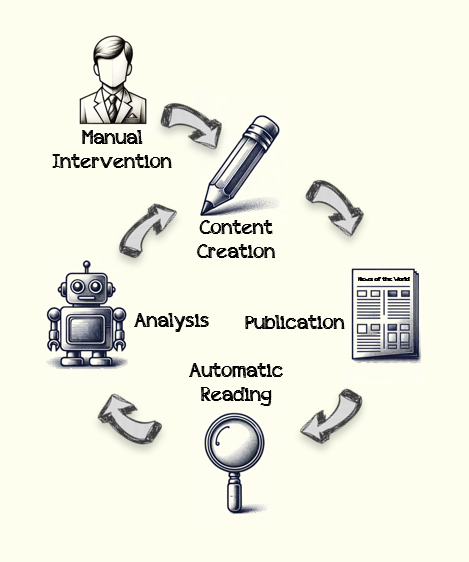
benchmark types
None of these is fake. All of them are proxies for the thing you actually care about, and every proxy leaks in a different place.
Problem one: saturation
A benchmark saturates when the top models get so good at it that everyone’s clustered near the ceiling, and the differences left between them are too small to mean anything. MMLU, once the headline benchmark for general knowledge, is the clearest current example: frontier models now score above 88 percent, and once you’re up there, a two or three point gap between two models is inside the range you’d expect from measurement noise alone, not a real capability difference. When a 2026 press release still leads with an MMLU number, that’s usually a sign there isn’t a more interesting number to lead with.
This matters because saturation doesn’t announce itself. The chart still shows one bar taller than another, and it’s visually persuasive even when the underlying difference is meaningless. The honest read on a saturated benchmark is that it tells you a model cleared a bar, not where it stands relative to another model that also cleared the same bar.
Problem two: contamination
Contamination happens when a model has already seen a benchmark’s questions, or something close enough to them, somewhere in its training data. At that point a high score partly reflects memorization instead of the reasoning ability the benchmark was designed to measure, and there’s no clean way to tell how much of the score is which from the outside.
This isn’t a hypothetical risk. An internal audit by OpenAI of SWE-bench, one of the most cited coding benchmarks, found meaningful training data overlap across frontier models, and separately found that a large share of the hardest unsolved problems in the set actually had flawed test cases, which lets a model “solve” a problem by exploiting a broken grader rather than writing genuinely correct code. The benchmark’s own maintainers now recommend treating raw SWE-bench Verified scores with real skepticism for exactly this reason.
The industry’s response has been to build benchmarks specifically designed to resist this. GPQA Diamond uses graduate-level questions written to be resistant to a quick web search, on the theory that if a non-expert with internet access can’t easily find the answer, it’s harder for that answer to have leaked wholesale into training data. SWE-bench Pro tests against private repositories instead of public GitHub issues, so a model can’t have memorized the fix in advance. Humanity’s Last Exam pushes further still, holding questions at the edge of what’s known in each academic field specifically to stay ahead of what any model could have absorbed by memorization. It’s a genuine arms race, and it’s one of the more useful axes for judging whether a benchmark is worth trusting: was it built to resist contamination, or does it just hope contamination didn’t happen.
Problem three: gaming and selective reporting
Even a contamination-resistant benchmark can be gamed if its structure is predictable enough to optimize against directly. Chatbot Arena, the large-scale platform where real users vote on which of two anonymous model responses they prefer, is a useful cautionary case here. Researchers found that a model fine-tuned specifically on Arena’s public prompt distribution gained a large jump in its rating with no corresponding improvement on external, independent benchmarks. The model got better at winning Arena votes specifically, not better in general, and from the outside those two things look identical on the leaderboard.
Selective reporting is the quieter version of the same problem. A company that runs a model against twenty benchmarks and publishes the four it won isn’t lying about any individual number, but the overall impression, “this model is better,” doesn’t follow from four cherry-picked wins the way the press release wants it to. The tell here is a launch announcement that leads with benchmark names you don’t recognize alongside ones you do; the unfamiliar ones are often there because the familiar ones didn’t tell a flattering story this time.
The major benchmark families, in plain English
Here’s what the names that show up in every 2026 launch announcement actually test, and what their current scores roughly mean.

The pattern across this table is consistent: the benchmarks that are hardest to game are also the slowest and most expensive to run, and the ones cheap enough to run on every model release are exactly the ones under the most pressure from saturation and contamination.
How Arena-style Elo ratings actually work
Elo showed up in AI benchmarking by way of chess, and the mechanics translate directly. Every model starts with a baseline rating. Two anonymous responses to the same prompt get shown to a real person, who picks the one they prefer without knowing which model produced either one. The winner’s rating goes up and the loser’s goes down, and the size of that shift depends on the surprise factor: beating a model with a much higher existing rating moves the needle more than beating one already expected to lose.

The genuine strength of this design is that it measures something static benchmarks structurally can’t: whether people actually like using the model, across open-ended, unpredictable, real prompts instead of a fixed question bank. The genuine weakness is baked into the same design: a preference vote captures tone, formatting, and confidence just as much as correctness, and a model that’s warm, well-formatted, and slightly wrong can beat a model that’s correct but terse. That’s a large part of why a model can top the leaderboard on raw benchmark accuracy while ranking well behind its competitors on human preference, and vice versa. Style-controlled variants of the Elo score exist specifically to correct for response length and formatting bias, and it’s worth checking whether a cited Arena number is style-controlled or raw before treating it as a clean signal.
Step by step: how to actually read a benchmark claim
Here’s the checklist worth running through the next time a launch announcement lands in your feed.
Step 1: Check whether the benchmark is near saturation. If every serious model scores within a few points of each other at the top, the specific ranking inside that cluster isn’t meaningful. MMLU and MMLU-Pro at the frontier are the clearest current examples.
Step 2: Check whether the benchmark is contamination-resistant by design. Benchmarks built around private test sets, fresh questions, or continuously refreshed problem pools (GPQA, SWE-bench Pro, Humanity’s Last Exam, LiveCodeBench) deserve more trust than static public question banks that have been sitting on the internet long enough to plausibly appear in someone’s training data.
Step 3: Look for the confidence interval, not just the point estimate. A benchmark score is a single number pulled from a noisy process, and the same model weights can score several points apart depending on which evaluation harness ran the test. A serious benchmark report includes an interval around the score; a launch blog post rarely does, and its absence is itself informative.
Step 4: Ask whether the score is on the model alone or on a scaffold around the model. Agentic benchmarks in particular are heavily dependent on the tool-calling harness, retry logic, and prompting scaffold wrapped around the underlying model, not just the model’s raw capability. A benchmark result run inside a heavily tuned scaffold measures the whole system, not the model in isolation, and two labs quoting “the same benchmark” may not be comparing like for like.
Step 5: Check what it costs to get that score. A model ranked at the top of a leaderboard is sometimes many times more expensive per token to run than a model a few ranks down, and extended-thinking or high-reasoning-effort modes inflate both the score and the cost and latency together. For almost every real production decision, the cost-performance tradeoff matters more than the raw ranking.
Step 6: Match the benchmark to your actual task. A coding benchmark tells you very little about summarization quality, and a benchmark measuring single-turn question answering tells you very little about a multi-step agent workflow. The benchmark most relevant to your decision is rarely the one the press release led with, because press releases lead with whichever number looked best that week, not the one that predicts your use case.
Common misconceptions worth clearing up
“A higher score always means a better model.” Only within the same benchmark, the same evaluation harness, and outside the noise band. Across different harnesses, the same underlying model can swing ten to twenty points, which is often larger than the gap being celebrated in a headline.
“If a benchmark is widely cited, it must still be reliable.” Citation frequency and current usefulness aren’t the same thing. MMLU is still the most recognizable benchmark name in most non-technical coverage precisely because it’s the oldest and most widely referenced, not because it’s still discriminating between top models.
“Human preference (Arena-style) scores are more objective because real people voted.” They’re more representative of a specific kind of real-world signal, casual conversational preference, not more objective in general. A model can win on preference and lose badly on a task requiring precise, unglamorous correctness, like a legal citation or a financial calculation, because a confident wrong answer often reads as more satisfying than a correct but hedged one.
“Benchmark gaming means the whole system is fraudulent.” Most gaming isn’t outright fraud, it’s optimization pressure doing exactly what it’s designed to do. If a company knows Arena votes respond well to longer, warmer responses, and they train toward that, they haven’t cheated by any explicit rule, they’ve just optimized for the metric instead of the underlying quality the metric was meant to proxy for. That’s a reason to read the number skeptically, not a reason to assume malice.
“An open-source leaderboard number is more trustworthy than a company’s own claim.” It’s independently reproducible, which is a real advantage, but it isn’t automatically immune to the same saturation, contamination, and scaffold-dependence problems, since it’s often running the exact same underlying benchmarks.
Why this got harder in 2026, not easier
It’s worth naming the bigger pattern directly: benchmark development and model capability are now locked in a genuine race, and the race is currently favoring capability. As soon as a benchmark becomes well known enough to matter for a launch announcement, it becomes valuable enough to optimize against, deliberately or not, and its usefulness as a clean measurement starts decaying from that point forward. The benchmarks doing the best job of resisting this, private test sets, continuously refreshed question pools, human-expert grading on real work, are also the ones that are hardest and most expensive to build and run, which is exactly why they’re not the numbers that show up first in a press release.
None of this means benchmark scores are worthless. It means they’re one input, read correctly, alongside a cost figure, a reliability figure, and ideally a test against the specific task you actually need done. The 37 percentage point gap that researchers have measured between lab benchmark performance and real-world deployment performance on enterprise agentic tasks is the clearest evidence that a leaderboard position and a production-ready system are related but distinct questions, and conflating them is the single most common mistake in how these numbers get reported.
The long-context trap
One more marketing claim deserves its own section because it’s become common and it’s genuinely misleading if read too quickly: the “1 million token context window” headline. That number describes how much text a model can technically accept as input, not how well it actually uses all of it.
The classic test for this is called needle-in-a-haystack: bury one specific fact somewhere inside a huge block of text and ask the model to find it. Frontier models now pass this test at close to perfect rates even at very long context lengths, and it’s become a standard chart in launch announcements for exactly that reason, it looks great. The problem is that finding one planted fact is close to the easiest possible long-context task. A separate, harder benchmark called RULER tests a broader range of long-context tasks, tracking multiple facts, reasoning across scattered information, aggregating details rather than just locating one, and the results tell a very different story: most models that ace needle-in-a-haystack degrade substantially on these harder tasks as input length grows. Independent measurement has found retrieval quality can drop by thirty to sixty points between a 200,000-token input and a 1,000,000-token input, for every frontier model except one deep-reasoning variant.
The practical takeaway is that a large advertised context window tells you the input limit, not the input the model can actually reason over reliably. If your use case depends on a model correctly synthesizing information spread across a genuinely long document, ask specifically about performance at the length you’ll actually use, not the maximum length the model technically accepts.
Worked example: reading a real launch announcement line by line
It helps to see the checklist applied instead of just described. Imagine a launch post with this paragraph: “Our new model achieves 91% on MMLU, tops the Chatbot Arena leaderboard, and scores 68% on SWE-bench Verified, setting a new state of the art across reasoning, conversation, and coding.”
Run it through the steps. MMLU at 91 percent is inside the saturated band discussed earlier, so this number confirms the model is competent, not that it’s ahead of its closest competitors, several of which likely score within a couple of points either way. “Tops the Chatbot Arena leaderboard” is worth a follow-up question the announcement doesn’t answer: is this the style-controlled ranking or the raw one, since raw Arena rankings reward longer, warmer-sounding answers independent of correctness. The SWE-bench Verified number is the one to treat most skeptically of the three, given the documented contamination and flawed-test issues in that specific benchmark; a SWE-bench Pro number, if the announcement had one, would be worth more trust and its conspicuous absence here is itself a small signal.
None of this means the model is bad. It means the paragraph is marketing copy built from real numbers, and reading it well means noticing which real numbers were left out as much as which ones were included.
A short glossary for the numbers you’ll actually see
Pass@1 means the model gets one attempt and either succeeds or fails, with no retries counted. A related metric, pass@k, gives the model k attempts and counts it a success if any one of them works, which produces a higher, and easier to inflate, number for the same underlying task.
Harness refers to the surrounding code that prompts the model, parses its output, and decides whether that output counts as correct. Two harnesses running the identical benchmark against identical model weights can produce meaningfully different scores, because small differences in prompting or answer-parsing change what counts as a hit.
Scaffold is the broader system wrapped around a model in an agentic benchmark, tool definitions, retry logic, memory management, that does real work alongside the model itself. A high agentic benchmark score can reflect a well-engineered scaffold as much as a more capable underlying model.
Confidence interval is the range within which the true score likely falls, given that a benchmark score is computed from a finite, noisy sample of tasks rather than every possible task. A leaderboard that reports 91.2 percent with no interval is hiding exactly the information you’d need to know whether a 1-point gap against a competitor is real.
Who’s actually running the test matters
One more thing worth separating out: who built the benchmark, and who ran the model against it, are two different questions with two different trust implications.
A benchmark built by an independent academic group, with a public methodology paper and a fixed, published question set, is about as trustworthy as static evaluation gets, and GPQA and the original SWE-bench both fall into this category. A benchmark built and maintained by a neutral third party but run continuously against new frontier releases, LMArena’s Chatbot Arena leaderboard is the clearest example, adds the advantage of being close to impossible to game through simple memorization, since the prompts users submit aren’t fixed in advance.
The number that deserves the most scrutiny is a benchmark run by the model’s own creator, on their own infrastructure, with a methodology described only in a blog post rather than a reproducible paper. That’s not automatically dishonest, most labs do report real numbers from real runs, but it’s the version of the process with the fewest independent checks on harness choice, prompt design, and which runs got reported versus quietly discarded. The practical rule of thumb: a self-reported number is a claim, an independently reproduced number is evidence, and a number with a published methodology and confidence interval is the closest thing to a fact you’re going to get in this space.
This is also why third-party aggregators that run the same standardized harness against every model, rather than trusting each lab’s self-reported numbers, have become more valuable over the course of 2026 even though they’re less visible than any single launch announcement. They can’t eliminate contamination or scaffold-dependence, but they do remove the harness-inconsistency problem, since every model in their comparison table was tested the same way.
The one habit worth building
If you take one thing from this guide, make it this: before a benchmark number changes your mind about anything, find the second number that should sit next to it. A capability score without a cost figure is half an answer. An accuracy percentage without a confidence interval is a guess dressed as a fact. A leaderboard rank without knowing whether it’s the model alone or a tuned scaffold around it tells you about a system, not necessarily the system you’d actually be building on. None of that requires distrusting the people who publish these numbers, most of them are reported in good faith. It just requires reading them the way you’d read any other measurement taken by someone with a reason to want it to look good.
Further reading
메타데이터
- post_id
- f5a37be4077f
- slug
- what-do-ai-benchmark-scores-actually-mean-a-plain-english-guide-f5a37be4077f
- url
- https://pub.towardsai.net/what-do-ai-benchmark-scores-actually-mean-a-plain-english-guide-f5a37be4077f
- canonical_url
- https://pub.towardsai.net/what-do-ai-benchmark-scores-actually-mean-a-plain-english-guide-f5a37be4077f
- author_url
- https://medium.com/@glennlenormand
- status
- ok
- fetched_at
- 2026-08-11 10:50:29