Chapter 2 — Taming the Mimir Compactor: Fixing Block Explosion and Bringing Queries Back to Life
The Real Bottleneck: When Compaction Becomes the Enemy
Mimir Optimization — Chapter 2 — Taming the Mimir Compactor: Fixing Block Explosion and Bringing Queries Back to Life
The Real Bottleneck: When Compaction Becomes the Enemy
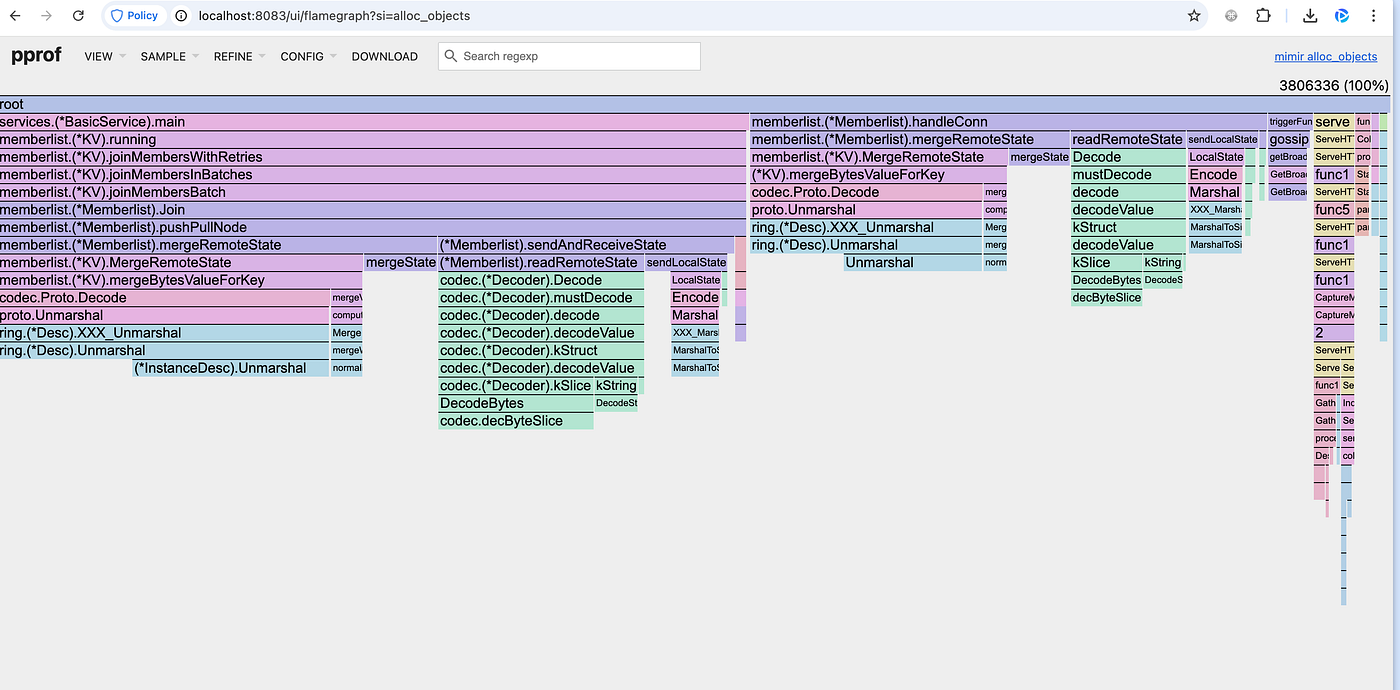
Even after solving ingestion and gossip overhead, our cluster’s query performance still suffered — especially for queries spanning more than 6 hours.
The culprit wasn’t the ingesters anymore, but the compactor.
Our one of the Mimir clusters (≈ 70 million active series) where I started testing compactor changes was generating blocks faster than the compactor could merge them (**Mimir recommends 1 shard per every 8 million active series in a tenant. For example, for a tenant with 100 million active series, use approximately 12 shards. Use an even number for the count). The backlog pilled up to 1.6 million blocks** and vertical compaction — the first, crucial deduplication phase — was completely stalled.
When vertical compaction fails, duplicate data from replicated ingesters never gets merged. Each query must then read and deduplicate those same time series three times at runtime.
That’s how we ended up with 143 TB of raw storage, but only 48 TB of unique data.
Before Diving In — A Quick Primer on Prometheus TSDB
Before diving into Mimir’s compactor, it’s important to understand how **Prometheus TSDB** stores and organizes data. Mimir builds directly on this foundation, extending it to handle multi-tenant, horizontally scalable storage.
The Building Blocks of Prometheus TSDB
Prometheus organizes data in immutable blocks on disk. Each block contains three major components:
- Chunks — compressed time-series samples. Each series is stored as a sequence “chunk” files that hold 120 samples.
- Index — the metadata layer that maps label pairs → series IDs → chunk locations.
- Meta.json — block metadata describing time range, ULID and parent blocks.
When Prometheus starts, it maintains a head block in memory that buffers live samples. Every 2 hours (sample at every 1 minute) the head block is cut, written to disk as an immutable block and a new head begins.
Over time, these 2-hour blocks accumulate, creating the need for compaction and retention.
How Compaction Works in Prometheus
Compaction merges smaller, adjacent blocks into larger ones to:
- reduce index lookup overhead
- remove deleted series
- keep total on-disk block count manageable.
2h + 2h + 2h + 2h + 2h + 2h →  12h block
12h + 12h →  24h block
Each compaction stage merges multiple blocks that share identical label sets and contiguous time ranges. The result is a new, larger block that contains all unique series without duplication.
Block Index
Inside each block, Prometheus maintains a binary index file that tells it where to find every series and which chunks belong to it. You can think of it as a two-level inverted index:
- Label names → Label values → Postings lists
- Postings list → Series IDs → Chunk references
Assume our block only has these series:
A: http_requests_total{job="api", status="200"}
B: http_requests_total{job="api", status="500"}
C: http_requests_total{job="web", status="500"}
index-header
+-----------------------------+
| MAGIC "XHDR" | ver=2        |
+-----------------------------+
| ULID: 01FQXYZ...            |
+-----------------------------+
| SYMBOLS                     |
|  id=1 "__name__"            |
|  id=2 "http_requests_total" |
|  id=3 "job"                 |
|  id=4 "api"                 |
|  id=5 "web"                 |
|  id=6 "status"              |
|  id=7 "200"                 |
|  id=8 "500"                 |
+-----------------------------+
| LABEL NAMES                 |
|  LID=10 -> sym(3) "job"     |
|  LID=11 -> sym(6) "status"  |
|  LID=12 -> sym(1) "__name__"|
+-----------------------------+
| LABEL VALUES                |
|  LID=10 "job"    -> [sym(4)="api", sym(5)="web"]      (VIDs: 20,21)
|  LID=11 "status" -> [sym(7)="200", sym(8)="500"]      (VIDs: 22,23)
|  LID=12 "__name__"-> [sym(2)="http_requests_total"]   (VID: 24)
+-----------------------------+
| POSTINGS OFFSETS (into index)             |
|  (LID=10, VID=20) job="api"    -> {off=  1000, len=120}  --> postings: [A,B]
|  (LID=10, VID=21) job="web"    -> {off=  1120, len= 60}  --> postings: [C]
|  (LID=11, VID=22) status="200" -> {off=  1180, len= 40}  --> postings: [A]
|  (LID=11, VID=23) status="500" -> {off=  1220, len= 80}  --> postings: [B,C]
|  (LID=12, VID=24) __name__="http_requests_total" -> {off=1300, len=140}
+-----------------------------+
| SERIES OFFSETS (into index)                 |
|  SID(A)=5001 -> {off= 2000}  (series A descriptor)
|  SID(B)=5002 -> {off= 2400}  (series B descriptor)
|  SID(C)=5003 -> {off= 2700}  (series C descriptor)
+-----------------------------+
| CHECKSUM                     |
+-----------------------------+
The big index file (separately in object storage for mimir)
- At
off=1000,len=120lives the postings bytes forjob="api"→[SID 5001, SID 5002] - At
off=1220,len=80lives the postings forstatus="500"→[SID 5002, SID 5003] - At
off=2400lives the series B record → full labelset + chunk refs.
Query: {job="api", status="500"}
- From index-header, fetch two offset pointers:
job="api"→{off=1000,len=120}status="500"→{off=1220,len=80}
- Do two range GETs against the index file (object storage) to read those postings.
3. Intersect postings: [5001,5002] ∩ [5002,5003] = [5002].
-
Need series B details? From header, Series Offset Table says
SID 5002 → off=2400. Do one more range GET to read the series descriptor (labels + chunk refs). -
Use chunk refs to fetch actual compressed chunks/ (separate GETs).
The index-header avoided loading the huge index or scanning it. It gave us the exact byte ranges to pull.
The 64 GB Index Limit
Each block’s index uses 32-bit offsets into its chunk file, meaning a single block’s index section can’t exceed roughly 64 GB.
Once that limit is reached, Prometheus can’t add new series to the block, forcing it to flush early. For clusters ingesting tens of millions of series, this leads to:
- thousands of tiny blocks instead of a few large ones,
- higher query fan-out, and
- more object-storage overhead.
Mimir inherits this structural constraint but adds split-and-merge sharding functionality for improved scalability and parallel compaction.
Mimir’s Store-Gateway
Mimir introduces a new layer: the store-gateway.
- It’s responsible for serving queries over historical blocks stored in object storage (like GCS or S3).
- When a query spans a time range beyond the active ingesters (for example > 6 hours), the store-gateway fetches the relevant block indexes and chunk metadata.
- To speed things up, it downloads only index-headers — a compact subset of the index containing label and series offsets — and keeps them cached locally.
When there are too many small or duplicated blocks, the store-gateway must open and scan each one, reading redundant postings lists over and over. This is why compaction directly influences query performance: fewer, larger, deduplicated blocks mean less I/O and fewer index intersections.
As our cluster scaled to 70 M active series, the compactor couldn’t keep up. Over time, 1.6 million uncompacted blocks piled up in object storage. Each block had its own index, metadata and postings list.
For the store-gateway, this was catastrophic.
To answer a query, every store-gateway pod must:
- Fetch index-headers for all blocks that overlap the query range.
- Load the postings (label → series mappings).
- Intersect those postings to resolve which chunks to read.
With 1.6 M blocks, that meant each store-gateway had to download 1.6 M index-headers and maintain them on local disk — roughly 1.5 TB per pod even with index-header compaction. We ran 50 pods, each loaded with terabytes of index data, yet queries still timed out and total GCS usage was 143 TB.
The problem wasn’t just space — it was sheer I/O and CPU overhead. Every query fanned out to millions of block metadata lookups, multiplying index intersections and GC activity.
Compaction process
Meanwhile, the compactor itself was paralyzed. It never progressed past the deduplication phase, where it must compare every block’s metadata against every other block’s metadata.
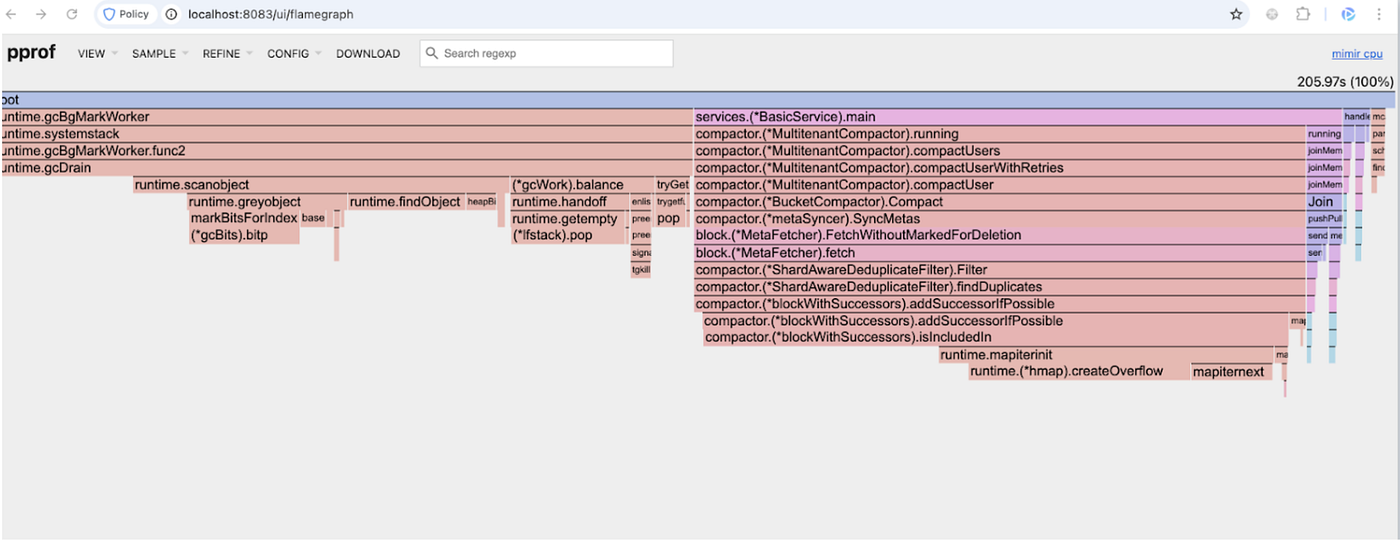
// Filter filters out from metas, the initial map of blocks, all the blocks that are contained in other, compacted, blocks.
// The removed blocks are source blocks of the blocks that remain in metas after the filtering is executed.
func (f *ShardAwareDeduplicateFilter) Filter(ctx context.Context, metas map[ulid.ULID]*block.Meta, synced block.GaugeVec) error {
 f.duplicateIDs = f.duplicateIDs[:0]

 metasByResolution := make(map[int64][]*block.Meta)
 for _, meta := range metas {
  res := meta.Thanos.Downsample.Resolution
  metasByResolution[res] = append(metasByResolution[res], meta)
 }

 for res := range metasByResolution {
  duplicateULIDs, err := f.findDuplicates(ctx, metasByResolution[res])
  if err != nil {
   return err
  }

  for id := range duplicateULIDs {
   if metas[id] != nil {
    f.duplicateIDs = append(f.duplicateIDs, id)
   }
   synced.WithLabelValues(block.DuplicateMeta).Inc()
   delete(metas, id)
  }
 }

 return nil
}Essentially, compaction was doing quadratic work on millions of inputs — a task that could never finish. This meant vertical compaction never began, duplicates accumulated endlessly, and store-gateways bore the entire burden.
Fix
- Reduce Retention The first practical step was to shorten the retention window from 90 days → 30 days. That alone cut block count from 1.6 M → ~800 K. Fewer overlapping time windows meant fewer metadata comparisons during deduplication.
- Wait for Code Fixes
We found the real deadlock in
shard_aware_deduplicate_filter.go, whereaddSuccessorIfPossible()could loop indefinitely. Grafana Labs fixed it in PR #11819, released in Mimir 2.17.0. After upgrading, compaction finally advanced. - Compaction Recovery Once the fix was in place, compaction resumed automatically. Over the next few days, block count dropped from 800 K → 2 K. Queries that had previously timed out began completing consistently.
- Longer Block Ranges for Faster Queries We extended the compactor’s block range from 2 hours → 2 days and 4 days. Now, multiple smaller blocks merge into a single, optimized one, allowing the store-gateway to fetch one postings index instead of hundreds. Query fan-out collapsed, and 30-day queries became several-times faster.
      block_ranges:
        - 2h0m0s
        - 12h0m0s
        - 24h0m0s
        - 48h0m0s
        - 96h0m0s
After Compaction: Overall Gains
After the compactor fixes, retention cleanup and improved block sharding, the results were transformative:
- Blocks: reduced from 1.6 million → 2 thousand
- Store-gateway local disk: 1.5 TB → 75 GB per pod (~95 % reduction)
- Store-gateway pods: 50 → 5 while maintaining identical SLOs
- Querier fleet: significantly reduced, with zero query timeouts even for 90-day ranges
- GCS object-store footprint: 143 TB → 4 TB (~97 % reduction)
- Query latency: long-range queries that once took 30–45 seconds now finish under 10 seconds

GCS

Blocks
Caveat: A few very high-cardinality queries can still fail due to the current hard limit
max_samples = 50,000,000. This is expected to change in Mimir 3.0 with query streaming, which removes this hard cap by delivering results incrementally.
I haven’t gone into every low-level detail of compactor internals here because there’s already an excellent write-up — **“Grafana Mimir Compaction: From Bottleneck to Savings” and [Mimir Compactor** ](https://grafana.com/docs/mimir/latest/references/architecture/components/compactor/)— which helped me quickly narrow down the issue when debugging our own setup.
That article provides deep background on how the split-and-merge algorithm works, the vertical vs. horizontal compaction flow and how index-header caching interacts with store-gateways. It’s a must-read if you’re optimizing Mimir at scale.
메타데이터
- post_id
- f6835da565a1
- slug
- chapter-2-taming-the-mimir-compactor-fixing-block-explosion-and-bringing-queries-back-to-life-f6835da565a1
- url
- https://medium.com/@niteshbv/chapter-2-taming-the-mimir-compactor-fixing-block-explosion-and-bringing-queries-back-to-life-f6835da565a1
- canonical_url
- https://medium.com/@niteshbv/chapter-2-taming-the-mimir-compactor-fixing-block-explosion-and-bringing-queries-back-to-life-f6835da565a1
- author_url
- https://medium.com/@niteshbv
- status
- ok
- fetched_at
- 2026-06-26 21:52:29