Building My Own Personal AI Assistant: A Chronicle, Part 4
Fernão Looked at My Stock & ETF Portfolio. It Was Not Impressed.
Building My Own Personal AI Assistant: A Chronicle, Part 4
Fernão Looked at My Stock & ETF Portfolio. It Was Not Impressed.
I have a bad habit of building things that give me unwelcome news about myself. Stay tuned, as that’s what the new Fernão module will be.
If you’re new here: I’ve been building Fernão, my own personal AI assistant. A very sparse stitched together app with different tabs, each one handling a slice of my life. Part 1 was a schedule organizer. Part 2, a task breaker. Part 3, a writing editor (which is, somewhat ironically, helping me write this very post).
And now Part 4: a portfolio analyzer that looked me in the eyes and told me I was doing it wrong.
Time to meet my nemesis — meaning, me as a stock picker.
First, Some Context On Why I Even Needed This
I’ve been investing for 5 years. Nothing crazy as I’m not day trading crypto at 3am or anything. I hold a mix of ETFs, individual stocks, some bonds, a couple of REITs.
At the same time, I like to read about companies, I follow earnings and I have opinions on things like competitive moats and management quality and total addressable markets.
I was, in other words, doing what most retail investors think they can do: putting in a reasonable amount of effort and assuming it was worth something — even if it was just for learning experience.
(And yes, I’ve read all the warnings. “Most retail investors underperform the market.” Moreover, I have a statistics masters. I knew the odds. I just needed to prove my own stupidity through experience. 😬)
When you start to invest, it’s difficult to have a free app that can tell you exactly your cost basis and performance. You can look at your portfolio on a random Tuesday, see that it’s up overall, and conclude that things are going fine, but there aren’t many tools that give you a holistic view of how you are performing through time and against many benchmarks (Yahoo finance gives a somewhat overview of that, but still limited for investors in Euro).
I wanted to check my performance over time and figure out what to do differently. So, having Fernão right here in my computer, I asked for help.
Spoiler alert: my investment decisions are not yielding extraordinary results.
Feeding Fernão: From Spreadsheets to Something Useful
The data source is an Excel file where I log every trade I do with date, ticker, buy or sell, quantity, price. I’ve been logging it since I started investing, which is the one thing I did right from the beginning.
Consistency in data entry is unsexy but it’s what makes a tool like this possible. If you’re not tracking your trades, the first step isn’t building the analyzer, it’s spending a painful afternoon reconstructing your history from brokerage statements (not fun!)
From that file, Fernão builds a few different views of what I own.
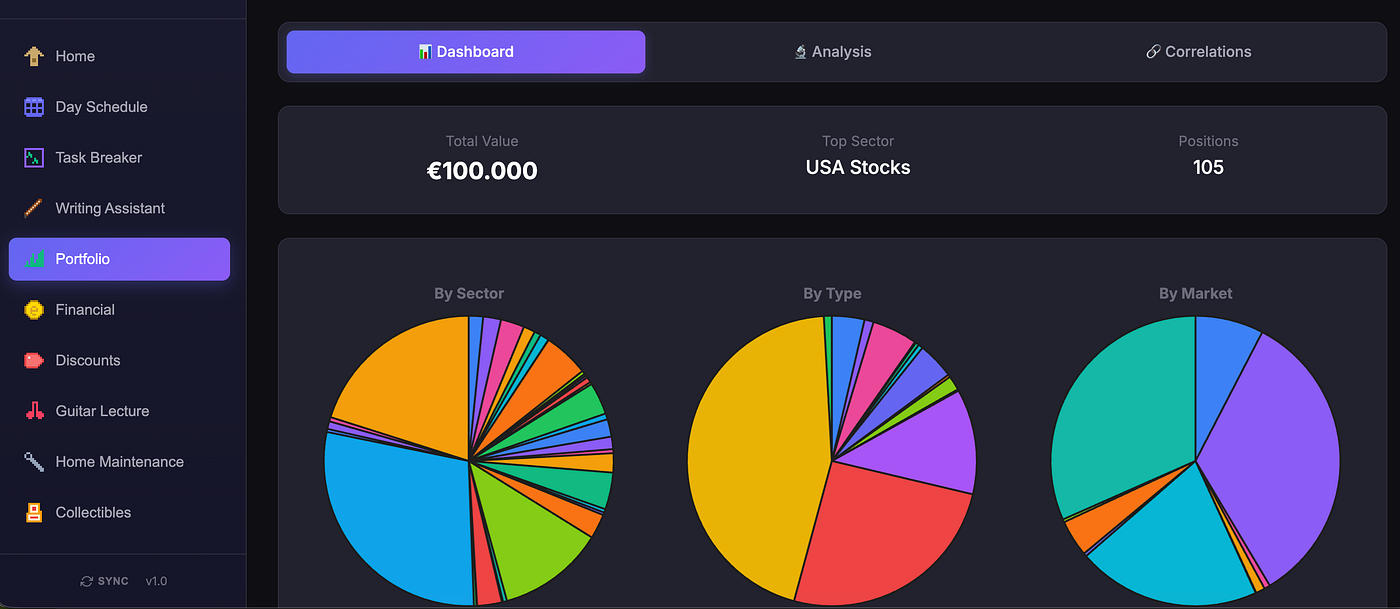
Portfolio section Overview
(I really need to improve the UI on this one. The emojification of front-ends by Claude is giving me the itch)
(Note: the values, except percentages, that I’ll show in this post are fictional or hidden, for privacy reasons).
The sector breakdown is the first reality check. It shows me where my capital lives. I had sectors I considered “small positions” that had grown, and sectors I thought were core holdings that had been diluted down as I bought other stuff. Seeing it as a pie chart is not the most data-viz recommended way, but they get the job done.
In the screenshot above, we can see that I have 105 positions open (some of these positions are repeated across brokers as I try to diversify across 3 different banks here in Portugal. Also, I have other assets such as real estate or Certificates of Deposit — the real unique positions should be around 50 to 60).
Also, we see the division by three groups:
- Sector: It’s not industry of the stock, but tells me the portion of the economy I’m investing in (World Stocks, US Stocks, Gold, etc.). In hindsight should have called this Asset Type.
- Type: If it’s an ETF, Individual Stocks, Real Estate, etc.
- Market: If it’s negotiated in the Nasdaq, Amsterdam, Deutsche Borse, etc.
Nevertheless, I immediately see that I have too many scattered positions. One of the things that I’ll be aiming to do in the next few months is to simplify my portfolio a lot, and probably reduce the positions to around 25/30 (taking into account duplication). As we will see next, I am suffering from diworsefication (where you diversify too much that your portfolio ends up returning less than the overall market).
This overview section is what it is — context, structure, a picture of the thing. Looking at it, we already see that there are too many positions open and that I should try to simplify in the future.
But, the interesting part is what comes next.
The Analysis Tab
The “Analysis” tab is where Fernão really showed me the important details.

Fernão Analysis Tab
The first thing I asked for was a historical comparison between my portfolio and the S&P 500 , on a Euro basis. This part matters a lot, because I’m based in Portugal. Most investors benchmark themselves against the dollar-denominated S&P 500 when they don’t actually live in dollars.
The only benchmark that’s real for me is the one in the currency I actually spend (Euro), so let’s analyze it:

My Portfolio (in Green) vs. S&P 500 (in grey)
This graph was the slap in the face.
Up until 2024, I was keeping pace, not beating the index, but close enough. Then the gap opened. My best theory: the stocks I like (blue chips, mature businesses, the boring stuff) aren’t where the market is putting its money right now. AI has a type, and it’s not them. I think it may revert, and I still believe in some of the stocks I bought.
But what bothers me more than the recent gap is the years before it — was where I was on par with the index. From 2022 to 2024, I was spending a lot of time choosing stocks. Hours of research, company analysis, reading filings. And the outcome was: about the same as doing nothing.
This isn’t a new story. Warren Buffett literally bet a million dollars on it — a public wager that a simple S&P 500 index fund would outperform a handpicked basket of hedge funds over ten years. The hedge funds lost. If the smartest, most resourced active managers in the world can’t consistently beat the market, what exactly was I doing thinking I could from my laptop on a Sunday afternoon?
That said — I’d do it again. Not because it was profitable, but because I needed to find out for myself. Some lessons only land when they’re yours! This one’s mine now, properly. There’s so much growth in making mistakes and learning quickly!
There’s this concept in investing called alpha, which is the excess return you generate compared to the benchmark. Positive alpha means you’re adding value with your stock selection. Negative alpha means you’d have been better off buying an ETF and going to the beach.
My alpha was negative.

My portfolio vs. SP500
One year of outperforming the index, the year the index was negative. My selection seems good when the index turns negative, but that doesn’t compensate the very positive years of the index.
Every other year, I lagged. 2023, 2024, 2026 especially, and my average outperformance is around -4.8 p.p. Ouch!
Every year you underperform isn’t just a small miss in that year — it’s a smaller starting point for compounding in the next year, and the one after that, and every year for the next two decades. A consistent 5% annual underperformance is not boring and manageable. Over 25 years it’s the difference retiring in your 40’s or 60’s.
The saving grace is time. I still have a long runway (hopefully) ahead of me, and catching these mistakes means I can do something about it. The portfolio is correctable, the habits are correctable, and compounding still has decades to work in my favour if I stop getting in its way.
Main conclusion from Fernão’s analytics: I was putting in more work than an index investor — more research, more monitoring, more mental energy spent thinking about positions. I was taking on more risk, because individual stocks are meaningfully more volatile than a broad index fund. And in return for all of that extra work and extra risk, I was producing worse outcomes.
Thanks Fernão for pointing out my bad strategy!
The Wins, the Blunders
Diving deep from the macro levels, I also want Fernão to give me an analysis on individual positions.

Top Positions by Return
My top stocks by percentual return are Apple, Digital Ocean and Lam Research. The issue here is that I’ve also had my share of blunders as well:

Largest Losses
In this individual analysis, I can now keep track of all my individual positions in the portfolio.
At 60–70 positions, I had created a portfolio that was hard to manage and that was obscuring underperformance by spreading it thin enough to not immediately notice.
So: too many positions, negative alpha, underperforming the index consistently. The diagnosis was pretty clear. Let’s see what my personal assistant recommends next.
Fernão as My Financial Advisor: What Should I Actually Do?
Data without prescription is just expensive introspection.
With the diagnosis of the ill issues around my portfolio, I built a “Consolidate & Invest” tab to turn the analysis into action. The idea is simple: every month, I give Fernão my current portfolio state, my investment goals, my tax situation, and how much new capital I want to deploy, and I ask it what to do.
The prompt took a while to get right. In Generative AI, the quality of the output is directly proportional to the quality of the context you give it, which is true of every AI application, but especially obvious when the subject is your specific financial life. Once I gave it real numbers such as actual allocations, targets, emergency fund balance, monthly expenses, the recommendations got useful.
So, given all of this: Let’s imagine I want to invest €2,000 next month. What does Fernão say?

Consolidate & Invest tab
The executive summary flagged three things. One: my core growth ETFs are significantly underweight. I’d been trickling money into individual stocks and letting the ETF allocation drift down over the years. Two: several individual stocks and some bond and REIT ETFs are both underperforming and sitting above their target allocation, as we’ve seen.
And three, as I had a large expense in my life in the last month, my emergency fund covers 2.8 months of expenses, while the target is 6.
Here is the prompt I’m passing to Fernão for the recommendations:
You are a portfolio advisor helping Ivo Bernardo optimize and grow his portfolio. You have two jobs today:
(1) identify what to clean up / rebalance, and
(2) produce a concrete investment routing plan for this month.

{portfolio_summary}

- -
## IVO'S FULL FINANCIAL PICTURE
### Target Portfolio Allocations (from investing ratios)
| Asset Class | Implied Dividend | Implied Return | Target % | Current % |
| - - - - - - - - - - | - - - - - - - - -| - - - - - - - - | - - - - - | - - - - - -|
| VWCE | 0% | 13% | 35% | 16.48% |
| Nasdaq | 0% | 18% | 25% | 9.75% |
| SPYD | 1.8% | 5.5% | 10% | 9.08% |
| Asia Pacific Div | 2.52% | 2% | 3% | 2.85% |
| Euro Div | 3.24% | 0% | 1% | 1.12% |
| TDIV | 2.52% | 7% | 9% | 0% |
| Individual Stocks | 3% | 6% | 17% | 17% |

## RETURN DATA - CRITICAL INSTRUCTION
The context above includes a section **"ACTUAL POSITION RETURNS (from verified price history)"**. This table contains real YTD / 6M / 1Y / 5Y returns for each position, resolved via the correct ticker mapping (e.g. "Amundi Nasdaq" maps to 6AQQ.DE, not QQQ or ^NDX). **Always use these figures when discussing position performance.** Do NOT substitute generic index benchmarks or make up returns for positions that appear in this table.
 - -
## OTHER CRITICAL CONTEXT
- **High Growth individual stocks** are intentionally small positions for learning/practice. Do NOT recommend selling them unless the thesis is fundamentally broken.
- **Same instrument across multiple banks = intentional custodian diversification.** Never flag this as redundancy.
- **Fragmented ETF positions across banks = intentional.** Only suggest consolidating same-bank duplicates.
- Ivo holds collectibles and real estate as non-correlated alternatives - some equity concentration is acceptable.
- **TDIV** is at 0% vs 9% target - highest priority to start.
- **VWCE** at 16.5% vs 35% target - major underweight, needs the most new capital.
- **Nasdaq** at 9.75% vs 25% target - also significantly underweight.
- **Individual Stocks** is overweight at the overall wealth level (26.6% vs 17% target) but at target within the investing ratios framework. Trim only if genuine redundancies exist.

 - -
## EMERGENCY FUND RULE
The context above includes an **"EMERGENCY FUND STATUS"** section with live data (avg monthly expenses, 6-month target, current DP's balance, months covered).
- If **⚠️ UNDERFUNDED**: include a 🛡️ EMERGENCY FUND action at the TOP of Part 2, and add a DP's top-up row to the Part 3 routing table with the shortfall amount. Investment into growth assets is secondary until the fund is secure.
- If **✅ FULLY FUNDED**: briefly acknowledge it in Part 1 and proceed with the normal investment plan.
- Always state the exact figures: "€X/month avg expenses → 6-month target €Y → current DP's €Z → X.X months covered."
 - -
## YOUR OUTPUT (4 parts)
### PART 1 - EXECUTIVE SUMMARY
3 sentences: current state vs targets, biggest gaps, what this month's plan achieves. Include one sentence on emergency fund status.
 - -
### PART 2 - SELL / REDUCE / CONSOLIDATE
If emergency fund is underfunded, start with:
 - -
#### 🛡️ TOP UP EMERGENCY FUND: DP's / Term Deposits
**Action:** Deposit €[shortfall] into DP's / term deposits to reach 6-month target
**Shortfall:** €[amount]
**Reasoning:** Current DP's covers only X.X months of expenses vs the 6-month target. Reinforce before deploying capital to growth assets.
 - -
Then for each position to act on:
 - -
#### 🔴 SELL / 🟡 REDUCE / 🔀 CONSOLIDATE: [Ticker(s)]
**Action:** [One-line action]
**Estimated proceeds:** €[amount]
**Reasoning:** [2–4 sentences. Reference P&L, position size, target gap.]
**Contrarian View:** [1–2 sentences - why someone might keep it]
**Learning Position?:** Yes / No
 - -
Aim for 2–4 actions. Sum up total estimated sell proceeds at the end of Part 2.
 - -
### PART 3 - THIS MONTH'S INVESTMENT ROUTING PLAN
**Total capital to deploy = fresh capital ({invest_amount}) + proceeds from Part 2 sells**
Allocate across ETFs both are underweight and serve the passive income goal.
If emergency fund is underfunded, add a DP's top-up row at the top:
| Destination | Rationale | € to deploy | Action |
| - - - - - - -| - - - - - -| - - - - - - -| - - - - |
| DP's (if underfunded) | Emergency fund shortfall | €… | Transfer to term deposit |
| VWCE | Largest ETF underweight | €… | Buy X units on [broker] |
| TDIV | 0% → 9% target, priority | €… | Start position |
| Nasdaq (CNDX/EQQQ) | 9.75% → 25% target | €… | Add to existing |
| Other | (if applicable) | €… | … |
| **TOTAL** | | **€…** | |
End with: **"After this month: estimated new % for VWCE ~X%, TDIV ~X%"**
Be decisive, specific, and data-driven. Use the actual portfolio data above for current values.
And now.. let’s see the recommendations. The financial data has been anonymized, but the type of recommendations Fernão provides should still come through clearly.
PART 1 — EXECUTIVE SUMMARY
Ivo Bernardo’s portfolio, valued at x across x positions, demonstrates strong diversification across asset types and platforms, with a commendable focus on learning through individual stock picks. However, key growth ETFs like VWCE and Nasdaq are significantly underweight, while several individual stocks and bond/REIT ETFs show persistent underperformance and are over their target allocation. This month’s plan prioritizes shoring up the emergency fund, then streamlines underperforming assets to redirect capital towards core growth and passive income generators, accelerating the path to the €x/month passive income goal. The emergency fund is currently underfunded, covering only x months of expenses.
PART 2 — SELL / REDUCE / CONSOLIDATE
🛡️ TOP UP EMERGENCY FUND: DP’s / Term Deposits Action: Deposit x into DP’s / term deposits to reach 6-month target Shortfall: x Reasoning: Current DP’s covers only x months of expenses (€x) versus the 6-month target of €x. Reinforcing this essential safety net is the top priority before deploying capital to growth assets.
🔴 SELL: Sweetgreen (SG) Action: Sell entire position in Sweetgreen (SG). Estimated proceeds: €x Reasoning: This “Stock High Risk, Fast-Growth” position has a current value of only €x, an abysmal P&L of -78.1%, and a 5-year return of -74.2%. Analyst consensus implies a further downside of -21.6%. While intended for learning, the fundamental thesis appears severely broken, making it an inefficient use of capital.
🔴 SELL: RH (RH) Action: Sell entire position in RH (RH). Estimated proceeds: €x Reasoning: This “Fast-Growth” individual stock has experienced a significant P&L loss of -65.6% and a 5-year return of -78.0%. While analysts see a modest implied upside of +6.0%, the persistent underperformance indicates a broken thesis for a learning position.
🔴 SELL: InMode (INMD) Action: Sell entire position in InMode (INMD). Estimated proceeds: €x Reasoning: As a “Stock High Risk, Fast-Growth” position, InMode exhibits a substantial P&L loss of -65.8% and a 5-year return of -70.5%. The position is very small, and its consistent underperformance suggests the learning value is diminished given the capital could be better utilized elsewhere.
🔴 SELL: Ishares Euro Corporate Large Bond (IBCX.DE) Action: Sell entire position in Ishares Euro Corporate Large Bond (IBCX.DE). Estimated proceeds: €x Reasoning: This Bond ETF has a significant P&L loss of -56.3% and a negative 5-year return of -0.9%. The Bond ETF asset class is currently overweight (3.71% vs 2% target), making this an opportune time to reduce exposure to an underperforming asset within this category.
SELL: iShares European Property Yield UCITS ETF (IPRP.AS) Action: Sell entire position in iShares European Property Yield UCITS ETF (IPRP.AS). Estimated proceeds: €x Reasoning: This REIT ETF is significantly overweight relative to its target (0.17% vs 0.01%) and has a P&L loss of -28.0% with a negative 5-year return of -14.9%. Reducing this position aligns with target allocations and removes a consistently underperforming asset.
Total Estimated Sell Proceeds: €x + €x + €x + €x + €x = €x
PART 3 — THIS MONTH’S INVESTMENT ROUTING PLAN
Total capital to deploy = fresh capital (€x) + proceeds from Part 2 sells (€x) = €x. Given the emergency fund’s underfunded status, all available capital this month will be directed to reinforcing it.
After this month: The emergency fund will increase to €x (current) + €x = €x. This covers x months of expenses, significantly closer to the x-month target of €x, leaving a remaining shortfall of €x. Further investment into growth assets will be possible once the emergency fund is fully secured.
Fernão’s recommendations are only as good as the context I give it, and I validate everything before acting. The goal isn’t to outsource the decisio, it’s to make sure I’m not missing something obvious before I make it. But this helps me deal with decision fatigue as I come into conclusion that that decision fatigue was only bringing me underperformance.
The Dividend Tab: Discovering That Income Isn’t Free
Two last tabs before we finish this blog post.
The dividend tab does two things. It projects my forward dividend income based on current holdings and historical payouts. And it applies tax rates, both the withholding at source in each holding’s country and the income tax I’d owe in Portugal on top.
Here’s roughly what happens when I earn dividends in Portugal. A US company pays me €100. The US withholds 15% at source, treaty rate for Portuguese residents. I’m left with €85. Portugal then taxes that €85 as regular income. Depending on the bracket, I net somewhere between €55–€70 of the original €100 after the US withholding credit, I always model dividends at worst-case to keep my projections conservative.
Meanwhile, if I hold an accumulating ETF, one that reinvests dividends rather than distributing them, those same gains compound inside the fund. I only pay tax when I eventually sell, and potentially at a more favourable rate.

Summary of Dividend Projection
The asymmetry is significant over a 20–25 year horizon. I was holding several distributing ETFs when accumulating equivalents existed, earning dividends that were immediately being taxed at a high combined rate, and thinking of it as “income.” I’ll still want to target around 1% of dividend income as time goes by, but I’ll not overweight distributing dividends.
A stock paying 4% today that’s growing its dividend at 10% annually will, after enough years, be yielding a much higher amount on your original cost. I also map this for the future in the application. Here are some examples based on my portfolio positions and how the net dividend projection may become:

Dividend Projection
Correlation Analysis: What Diversification Looks Like
The correlations tab was the most technically interesting thing to build, and also the most educational to actually use.
The basic idea of diversification is that you want your assets to behave differently from each other. If everything falls together when the market drops, you weren’t diversified, you just had the same bet in different packaging. The goal is to own things whose prices move with some independence, so losses in one part of the portfolio don’t necessarily show up everywhere else at the same time.
Correlation is how you measure this. A correlation of +1 means two assets move in perfect lockstep , if one goes up 10%, the other goes up as well. Zero means no relationship. Negative means they tend to move in opposite directions. In practice, most financial assets have correlations somewhere between 0 and +1. Fernão also gives me this data with a rolling correlation through time — take the example of Google and Apple:

Google vs. Apple Correlation
Google and Apple: strongly correlated, as expected. Both are massive US tech companies, both exposed to the same macro environment (interest rates, ad markets, consumer sentiment, regulatory pressure) and both owned heavily by the same institutional investors. When one moves, the other tends to move in the same direction. Holding both gives you company-specific exposure, but it doesn’t help you from a diversification standpoint.
Apple against the total market is where it gets interesting. Apple has become so dominant in major indices, at various points the largest company in the world by market cap, representing a significant chunk of the S&P 500 — that it and the index have become nearly inseparable. The correlation between Apple’s stock and the Total Market is even larger:

Apple vs. Vanguard FTSE Total Market
Gold is where the picture changes. Against the total stock market, gold’s rolling correlation hovers around zero and regularly swings negative. This is what “flight to safety” looks like:

Physical Gold vs. Vanguard FTSE Total Market
This is why portfolio managers allocate to gold even though it doesn’t pay a dividend, doesn’t have earnings, doesn’t do anything except sit there and be gold. You’re not holding it for returns, you’re holding it to reduce how badly things go when stocks go down. The drag in good times is the price of the cushion in bad ones.
Bitcoin is the most interesting case study here, and it’s one where the data tells a pretty different story from the marketing. Some pitches for Bitcoin is “digital gold” , scarce, decentralised, a hedge against inflation and currency devaluation. Under that narrative, you’d expect it to behave like gold: low or negative correlation with equity markets, a place capital moves toward when risk appetite contracts.

Bitcoin vs. Nasdaq 100 ETF
The rolling correlation chart between Bitcoin and the NASDAQ is… not that. They’re positively correlated. When tech stocks fall, Bitcoin tends to fall too. When tech stocks rally, Bitcoin often rallies alongside them. The likely explanation is that Bitcoin’s investor base and the NASDAQ’s investor base overlap heavily.
For Bitcoin to earn the uncorrelated status that gold actually holds, it would need to decouple from risk sentiment in a sustained, consistent way across multiple market cycles.
Okay But What Am I Actually Changing?
Building this module gave me a lot of insights. I was feeling frustrated as an individual investor of not having a tool to deeply analyze my portfolio — most tools are too expensive or thought for institutional investors. Luckily, the AI world is giving us these abilities to build our own tools quite fast. This is not, of course, an enterprise grade application, but more of a personal cockpit that I’m building.
So let me just say what I’m doing differently after analyzing this data:
- Stopping new capital going into individual stocks. Not selling everything immediately, some positions still have real theses and some would trigger unnecessary tax events if sold now.
- Switching to accumulating ETFs wherever possible. For every ETF where an accumulating version exists, I want the accumulating one.
- Fixing the emergency fund before anything else.
- Reducing position count over time. I have too many open positions. I’m not going to make 90 sell decisions at once, but as positions naturally run off or hit sell criteria.
What I Actually Learned From Building This
I built this module in my Personal Assistant to get better financial information.
I’m lucky I built this when I still have a lot of years of investing ahead of me. The earlier you catch a bad strategy, the more time you have to compound the correct one instead. That’s the whole game, really.
What are your thoughts on using AI for this kind of personal financial analysis? And if you were building your own personal assistant, what module would you build first?
More modules to come!
— Ivo
메타데이터
- post_id
- f6d2126b068a
- slug
- building-my-own-personal-ai-assistant-a-chronicle-part-4-f6d2126b068a
- url
- https://medium.com/@ivopbernardo/building-my-own-personal-ai-assistant-a-chronicle-part-4-f6d2126b068a
- canonical_url
- https://medium.com/@ivopbernardo/building-my-own-personal-ai-assistant-a-chronicle-part-4-f6d2126b068a
- author_url
- https://medium.com/@ivopbernardo
- status
- ok
- fetched_at
- 2026-06-09 15:37:30