Using the BornInBradford SQL database_extract Command Line Interface
Unlike the interactive Graphical User Interface, there is also a CLI for use on headless machines or HPC clusters, when local memory…
Using the BornInBradford SQL database_extract Command Line Interface
Unlike the interactive Graphical User Interface, there is also a CLI for use on headless machines or HPC clusters, when local memory requirements just don’t cut it. Here we go over some of the basic functionality:
Photo by Henry & Co. on Unsplash
IPython
Although the script works through normal python or Jupyter notebooks, the most intuitive way to explore data is through the IPython shell. This allows the user to run the script, and then manually manipulate the data afterwards.
Viewing the arguments
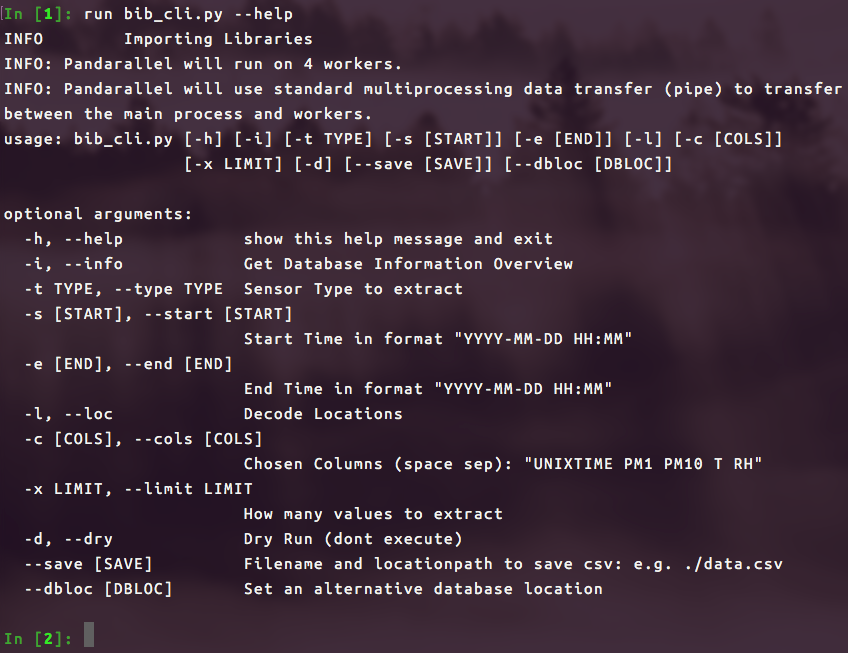
There are a number of available arguments, and the easiest way to view these is by using the --help option
Getting an Overview of the Database
Database Location
As with the GUI, we first have to set the location of our decryption key and database location within the configuration (config.py)file.
Alternatively, we can use the --dbloc /path/to/database.db argument.
Dry Run
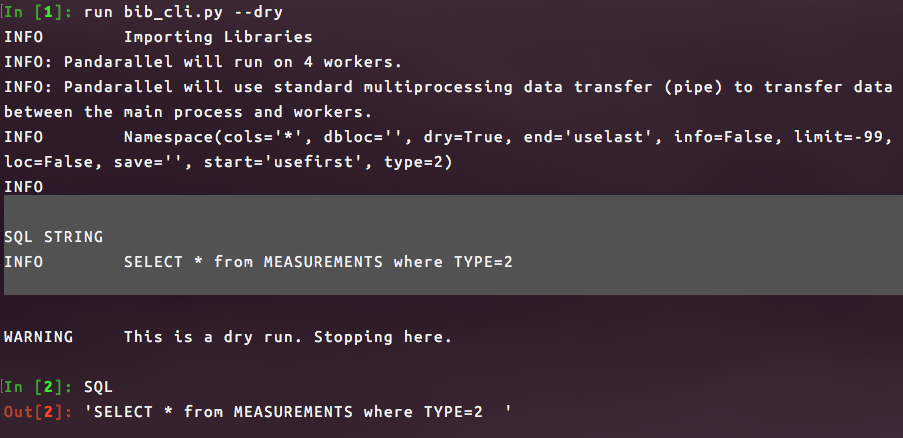
We can extract only the SQL key (variable name SQL ) buy compiling this, but not actually executing with the --dry argument.
Database Info
Or we can execute a simple SQL query to count the number of rows and determine the start/end times. with the --info flag — if used with the ‘dry run’ flag. Otherwise, the information is provided, and the full sql query is executed to extract a dataset.
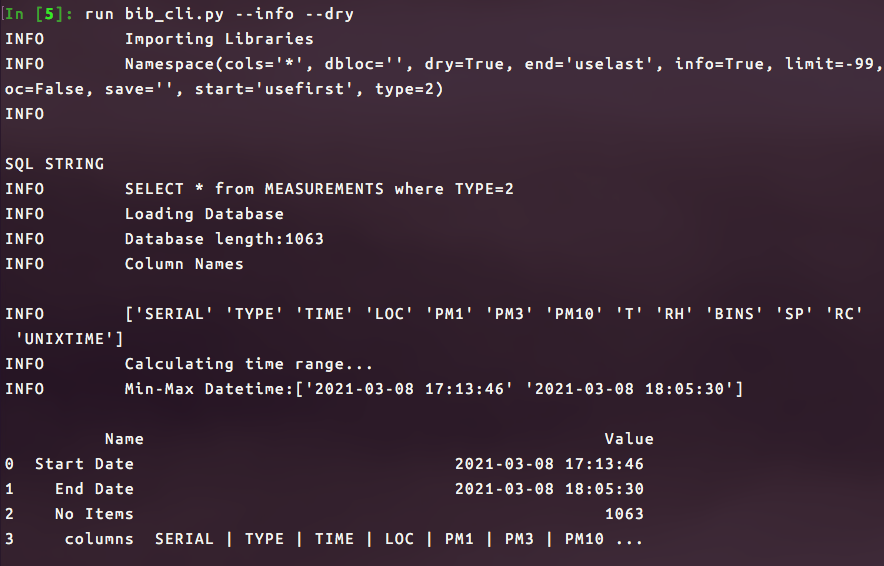
If running without the dry flag, we also get information on the returned database, e.g. the shape and size in memory:
{'Shape': '(1063, 13)', 'Size in Memory': '733.9 KB'}Filtering the Data
There are a number of filtering options available. The simplest being the start and end dates.
Datetime Filter
We can filter by --start date, --end date, or both by specifying a date-time string in the argument. If either of these is not described, then the database maximum/minimum is used.
For example, if we wanted all the times from 17:00 until 17:50:46 we could use the following command:
run bib_cli.py -s "2021-03-08 17" -e "2021-03-08 17:50:46"Here the shorthand notation for start and end is used, with the date being in a format "YYYY-MM-DD HH:MM:SS". Note how it is possible to specify 17:00:00 by leaving the date string incomplete.
Type of Sensor
We have a number of sensors, in this case we are only interested in the portable ones (type 2, default), and we can specify this if required with the --type flag.
run bib_cli.py --type 2Columns
Within the info output, there is a list of available columns provided. By default all of the columns are used, however, it is possible to specify just a select few.
NOTE: Be careful in specifying individual columns. For instance, UNIXTIME should always be used, and if locations or bins are calculated, the LOC or BIN columns should be included. This is done automatically on the GUI.
run bib_cli.py --cols "UNIXTIME,LOC,BINS,T,PM1,RH"These should be separated with a , and have no spaces between them.
Limit
Finally we can limit the number of results returned:
run bib_cli.py --limit 900Example
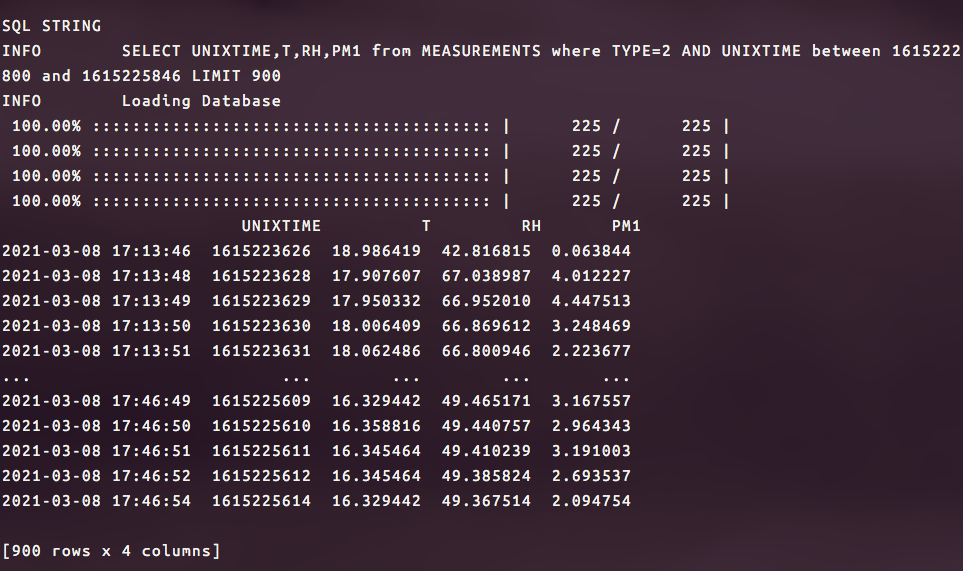
Using the example command:
python bib_cli.py -s "2021-03-08 17" -e "2021-03-08 17:50:46" -t 2 -c "UNIXTIME,T,RH,PM1" --limit 900Produces the following data frame of results:
Post Processing
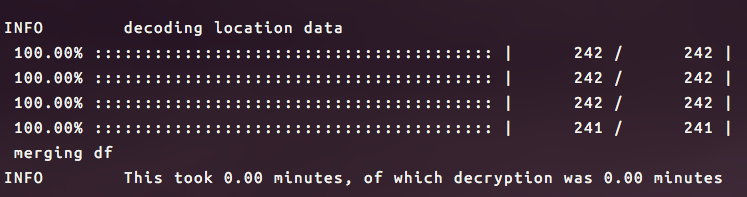
Getting Locations
To do this, the decryption file location must be set in config.py and the --loc flag applied on runtime.
run bib_cli.py --locThis adds an additional step that converts the ‘LOC’ array into LAT, LON, ALT columns.
Save File
If you require a comma-separated output file, this can be generated by providing a save location in the --save flag.
run bib_cli.py --save "/home/user/files/mycsv.csv"Direct usage
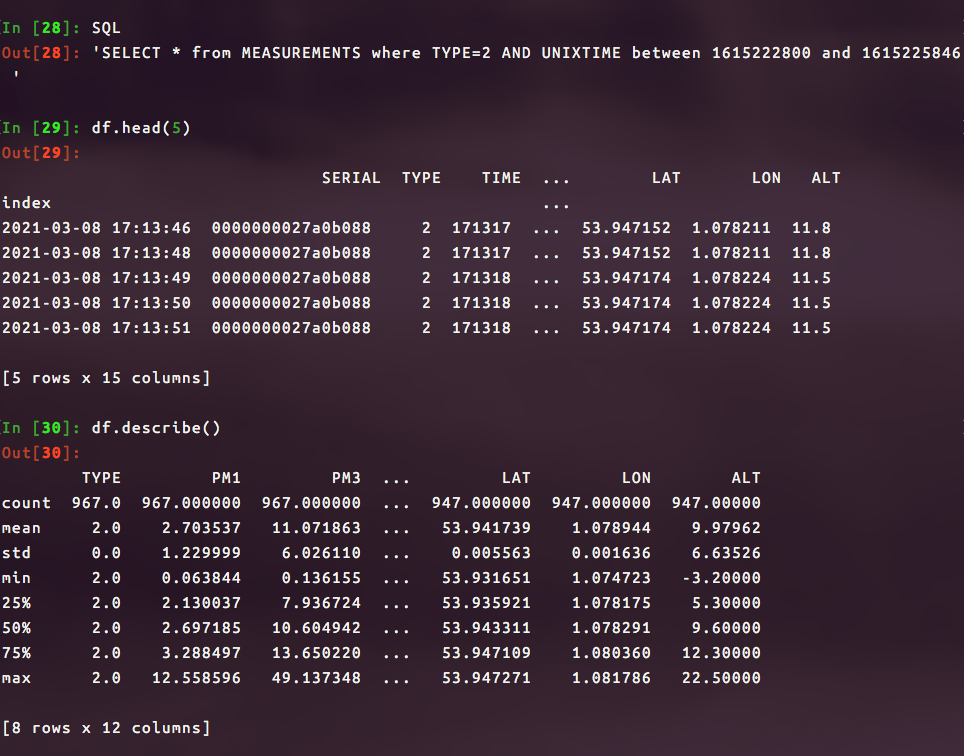
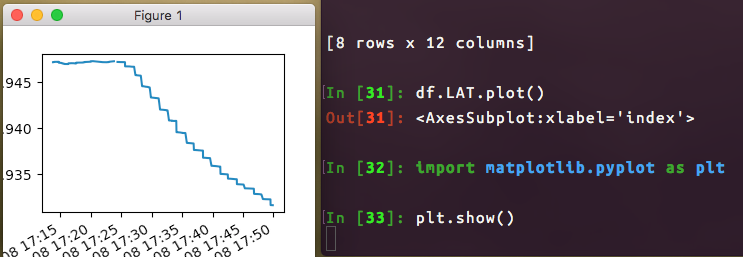
Alternatively, as we are already in IPython we can use the shell to explore the existing dataframe as normal. Here we have two returned values:
- the
SQLvariable which corresponds to the string command used on the database - the output dataframe
df
Describe Example
Plotting Example
Quick-Plotting the Data
The geoplot.py the script also works similar to bib_cli. You can use basic commands (see python geoplot.py --help for options) to display a map of ALL the extracted data points.
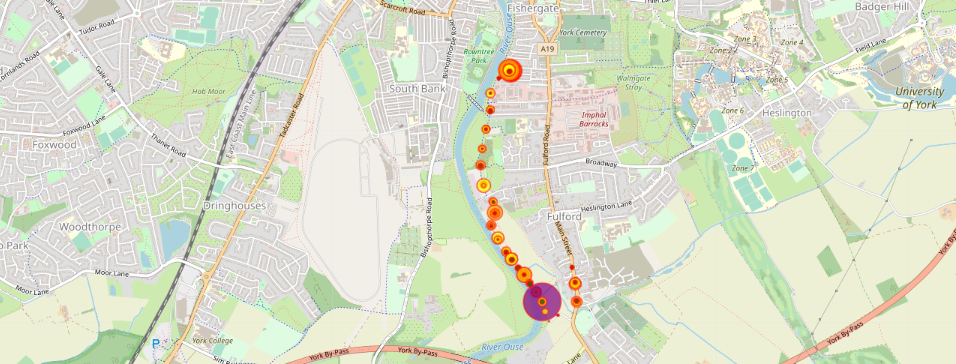
Colours are based on the categories in (https://www.researchgate.net/publication/268057874_AIRNow_AIR_QUALITY_NOTIFICATION_AND_FORECASTING_SYSTEM/figures)
메타데이터
- post_id
- f6db6a910c11
- slug
- using-the-borninbradford-sql-database-extract-command-line-interface-f6db6a910c11
- url
- https://medium.com/cemac/using-the-borninbradford-sql-database-extract-command-line-interface-f6db6a910c11
- canonical_url
- https://medium.com/cemac/using-the-borninbradford-sql-database-extract-command-line-interface-f6db6a910c11
- author_url
- https://medium.com/@daniel-ellis
- status
- ok
- fetched_at
- 2026-06-09 21:21:26