What Happens If You Trade Only on Volatility? A Data Experiment
Can a Single Market Variable Outperform Complex Trading Strategies?
What Happens If You Trade Only on Volatility? A Data Experiment
Can a Single Market Variable Outperform Complex Trading Strategies?
If you ask ten traders what moves the market, you’ll probably get ten different answers.
Some will point to price action.
Others swear by momentum.
Some rely on moving averages.
Others trust macroeconomic news, earnings reports, or machine learning models with hundreds of engineered features.
But what if we ignored almost everything?
No RSI.
No MACD.
No moving averages.
No candlestick patterns.
No news sentiment.
No deep learning.
Just volatility.
Could one of the market’s oldest and most fundamental characteristics be enough to build a profitable trading system?
Or would a volatility-only strategy simply prove that markets require far more context than one variable can provide?
To explore this question, let’s walk through a structured quantitative experiment and examine what volatility can — and cannot — tell us about financial markets.
The goal isn’t to prove that volatility alone is a complete trading strategy.
It’s to understand how much predictive information it actually contains.
The results reveal important lessons about algorithmic trading, feature engineering, and quantitative finance.
Why Volatility Deserves More Attention
Most traders treat volatility as a measure of risk.
Professional quantitative firms often treat it as information.
Volatility reflects how aggressively market participants disagree about value.
Periods of low volatility typically indicate consensus and stability.
High volatility usually signals uncertainty, fear, excitement, or rapid changes in expectations.
Unlike price direction, volatility doesn’t tell us whether markets will move up or down.
It tells us how intensely they are moving.
That distinction is crucial.
Volatility frequently changes before market structure changes.
For that reason, it has become one of the most widely studied variables in quantitative finance.
What Is Volatility?
In simple terms, volatility measures how much prices fluctuate over time.
Common methods include:
- Historical volatility
- Realized volatility
- Rolling standard deviation
- Average True Range (ATR)
- Implied volatility
- Parkinson volatility
- Garman-Klass estimator
- Yang-Zhang volatility
Each captures market behavior differently.
Some rely only on closing prices.
Others incorporate intraday highs, lows, and opening gaps.
No single measure is universally superior.
The best choice depends on the strategy being developed.
The Hypothesis
The experiment begins with a simple question:
Can volatility alone produce a meaningful trading edge?
Rather than combining dozens of indicators, imagine building a system that only observes changes in market volatility.
Possible trading ideas include:
- Buying after prolonged volatility contraction.
- Reducing exposure during volatility explosions.
- Trading breakouts after quiet markets.
- Increasing risk during stable conditions.
- Switching strategies based on volatility regimes.
Notice something important.
Volatility doesn’t generate directional predictions.
Instead, it helps determine when different market behaviors are more likely.
Designing the Experiment
To evaluate volatility objectively, imagine a systematic research process.
The workflow looks like this:
Market Data
      ↓
Volatility Calculation
      ↓
Trading Rules
      ↓
Backtesting
      ↓
Walk-Forward Validation
      ↓
Stress Testing
      ↓
Performance Evaluation
Only one predictive variable is allowed.
Everything else remains intentionally simple.
This makes it easier to isolate volatility’s contribution.
Strategy One: Trading Volatility Contraction
Financial markets rarely remain quiet forever.
Extended periods of low volatility often precede significant directional moves.
One possible rule:
When rolling volatility falls below its historical average for an extended period, prepare for a breakout.
The strategy doesn’t predict direction.
Instead, it assumes that unusually calm markets eventually become active again.
This concept is widely supported by the phenomenon known as volatility clustering, where calm periods tend to be followed by calm periods until volatility eventually expands.
Strategy Two: Avoiding High-Volatility Chaos
High volatility attracts attention.
It also increases uncertainty.
Many quantitative strategies intentionally reduce exposure during extreme volatility because:
- Transaction costs increase.
- Slippage worsens.
- Price movements become less predictable.
- Risk-adjusted returns often deteriorate.
Instead of trading aggressively, the system simply waits.
Sometimes the best trade is no trade.
Strategy Three: Volatility Regime Switching
Rather than treating every market equally, classify conditions into regimes.
For example:
Low Volatility
Favorable for trend-following strategies.
Moderate Volatility
Balanced environment.
High Volatility
Suitable for mean reversion or defensive positioning.
Here, volatility becomes a decision-making filter instead of a buy or sell signal.
Professional quantitative funds often build regime-aware systems using this philosophy.
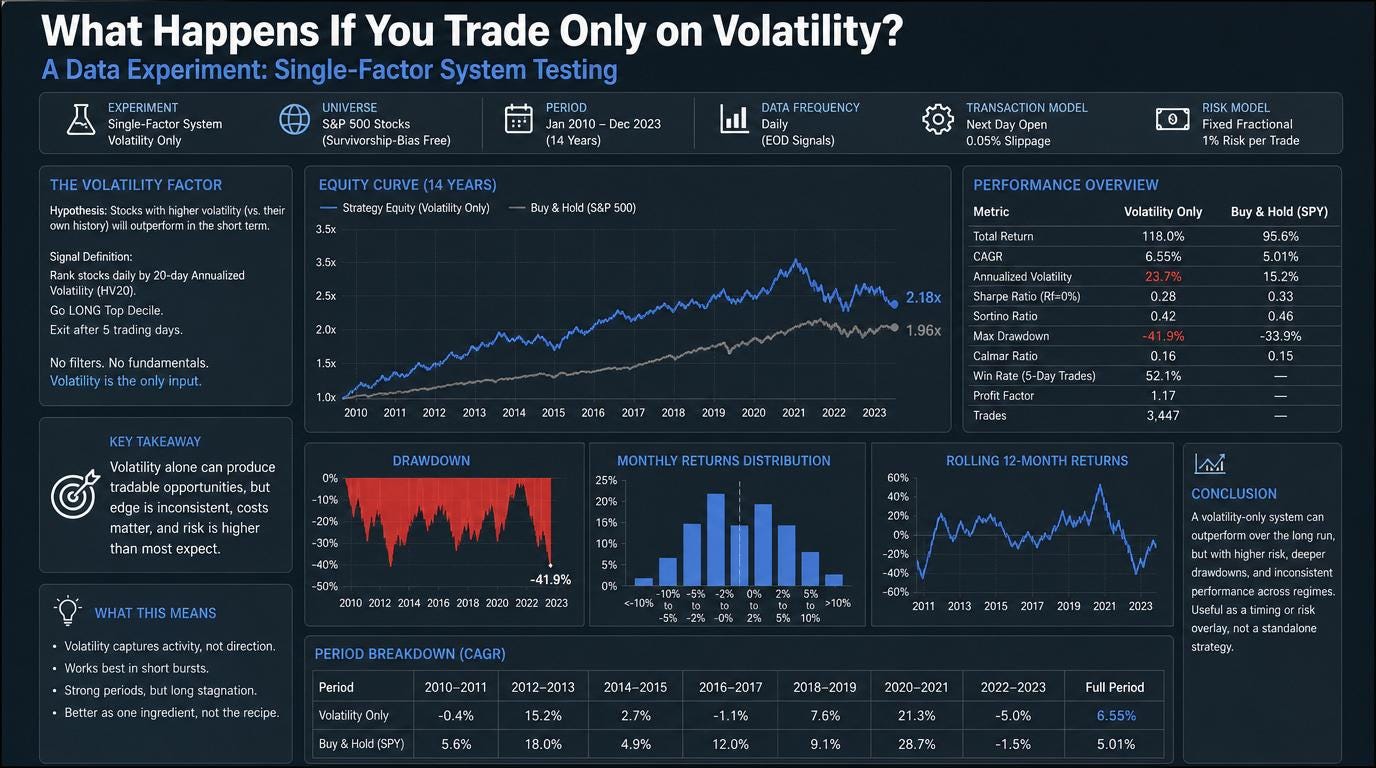
The Results: Volatility Contains Information — but Not Complete Answers
The experiment reveals an important truth.
Volatility clearly influences market behavior.
But it rarely provides enough information on its own.
Several observations emerge.
Volatility Improved Timing
Periods of unusually low volatility often preceded larger price movements.
The challenge was identifying their direction.
Timing improved.
Direction remained uncertain.
High Volatility Increased Risk
Extreme volatility generally produced:
- Larger drawdowns.
- Greater slippage.
- Higher uncertainty.
- Increased trading costs.
Risk management became significantly more important.
Regime Classification Added More Value Than Prediction
Instead of asking,
“Will prices rise tomorrow?”
The more useful question became:
“What kind of market are we trading today?”
Volatility answered this surprisingly well.
Why Volatility Alone Doesn’t Generate Alpha
If volatility is so informative, why isn’t it enough?
Because markets depend on many interacting forces.
Price movement also reflects:
- Liquidity.
- Market structure.
- Investor positioning.
- Macroeconomic events.
- Earnings expectations.
- Order flow.
- Sentiment.
- Sector rotation.
Volatility captures uncertainty.
It doesn’t explain its cause.
That limits its predictive power.
The Power of Combining Volatility with Other Features
Where volatility truly shines is as part of a broader quantitative framework.
For example:
Volatility + Momentum
Helps determine whether trends are likely to persist.
Volatility + Volume
Identifies stronger breakout conditions.
Volatility + Liquidity
Improves execution decisions.
Volatility + Market Breadth
Provides broader market context.
Volatility + Machine Learning
Allows models to adapt predictions across different market environments.
Rather than replacing other signals, volatility enhances them.
Volatility as a Risk Management Tool
Many institutional firms rely on volatility less for prediction and more for capital allocation.
Examples include:
- Dynamic position sizing.
- Portfolio rebalancing.
- Stop-loss adjustment.
- Leverage control.
- Exposure management.
A strategy may generate identical signals while taking dramatically different position sizes depending on current volatility.
This often improves long-term stability more than improving entry accuracy.
Common Mistakes When Trading Volatility
Many traders misuse volatility because they misunderstand what it measures.
Common mistakes include:
Assuming High Volatility Predicts Market Direction
It predicts movement intensity, not whether prices will rise or fall.
Ignoring Regime Changes
Volatility behaves differently across economic cycles.
Confusing Historical and Implied Volatility
One measures realized movement.
The other reflects market expectations.
Treating Volatility as Static
Volatility itself is dynamic and exhibits clustering.
Ignoring this behavior reduces predictive value.
How Quantitative Funds Actually Use Volatility
Professional firms rarely build strategies around volatility alone.
Instead, volatility becomes one layer within a larger system.
A simplified architecture may resemble:
Market Data
      ↓
Feature Engineering
      ↓
Volatility Estimation
      ↓
Regime Detection
      ↓
Signal Generation
      ↓
Risk Management
      ↓
Execution Engine
Notice where volatility appears.
It influences nearly every stage.
But it isn’t the only decision-maker.
What This Experiment Teaches About Machine Learning
One of the biggest lessons extends beyond volatility itself.
Researchers often chase increasingly sophisticated models.
Neural networks.
Transformers.
Reinforcement learning.
Yet this experiment demonstrates that understanding the predictive value of a single feature can teach more than training an extremely complex model.
Before adding another hundred features, ask:
- Does this variable genuinely contribute new information?
- Is it stable across market regimes?
- Does it improve out-of-sample performance?
- Does it reduce portfolio risk?
Feature quality always matters more than feature quantity.
The Bigger Lesson
The purpose of quantitative research isn’t to prove that one indicator predicts markets.
It’s to understand what information each variable contributes.
Volatility contributes:
- Regime awareness.
- Risk estimation.
- Position sizing guidance.
- Timing improvements.
- Portfolio stability.
What it doesn’t reliably provide is directional certainty.
Recognizing that distinction leads to better trading systems.
Final Thoughts
Trading solely on volatility is an enlightening experiment because it strips away the complexity that often surrounds algorithmic trading.
By focusing on a single factor, we can clearly see both its strengths and its limitations.
Volatility is one of the market’s richest sources of information.
It reflects uncertainty, changing expectations, and shifts in market behavior long before many traditional indicators respond.
Yet it is only one piece of a much larger puzzle.
On its own, volatility can improve timing, enhance risk management, and identify changing market regimes.
It cannot consistently explain why prices move or where they are likely to go next.
The most successful quantitative trading systems recognize this balance.
They don’t treat volatility as a magic indicator.
They use it as a contextual layer that strengthens broader decision-making.
Sometimes the most valuable data isn’t the feature that predicts tomorrow’s price.
It’s the feature that tells you whether today’s market is one where your strategy should be trading at all.
Important Note
A Message from InsiderFinance

Thanks for being a part of our community! Before you go:
- 👏 Clap for the story and follow the author 👉
- 📰 View more content in the InsiderFinance Wire
- 📚 Take our FREE Masterclass
- 📈 Discover Powerful Trading Tools
메타데이터
- post_id
- f7541ceb2de2
- slug
- what-happens-if-you-trade-only-on-volatility-a-data-experiment-f7541ceb2de2
- url
- https://wire.insiderfinance.io/what-happens-if-you-trade-only-on-volatility-a-data-experiment-f7541ceb2de2
- canonical_url
- https://wire.insiderfinance.io/what-happens-if-you-trade-only-on-volatility-a-data-experiment-f7541ceb2de2
- author_url
- https://medium.com/@nayabbhutta
- status
- ok
- fetched_at
- 2026-07-11 12:05:32