How the Tampa Bay Rays Are Beating a Model That Can’t See Them
How a last-place finish in every damage metric became a first-place offense, and why the models never saw it coming.
How the Tampa Bay Rays Are Beating a Model That Can’t See Them
All statistics current at the conclusion of June 2nd 2026 games via Baseball Savant and Fangraphs
The Tampa Bay Rays are in first place in the AL East. They are doing it with the third-lowest payroll in baseball, at around $87 million. And by every modern measure of how a good offense is supposed to look, exit velocity, barrel rate, and hard-hit rate, they are dead last in the sport.
That is not supposed to be possible. And yet here we are.
For the better part of a decade, the central gospel of baseball analytics has been damage. Hit the ball hard. Accept strikeouts because the tradeoff is power. Optimize for exit velocity and launch angle, and the expected statistics that flow from them. The Rays read that gospel and built the exact opposite roster. This piece is about why that works, why the models do not see it coming, and why the skills behind it are not going anywhere.
What Statcast Says About This Team
Statcast is Major League Baseball’s tracking system. It measures things like exit velocity, launch angle, and the quality of contact, and it uses all of that to build expected statistics, numbers that estimate what a team’s production should look like based purely on how hard they are hitting the ball.
By those numbers, the Rays look like a bottom-of-the-barrel offense. They rank last in Barrel%, which measures how often a hitter makes the kind of hard, well-angled contact most likely to result in extra bases, and last in HardHit%, the rate of balls hit 95 mph or harder. They sit in the bottom three in average exit velocity. Their expected offensive production, measured by xwOBA, lands 12 points below the league average.
If you stopped there, you would think this team had no business leading the AL East.
What The Results Say
Here is where it gets interesting. The Rays are not just beating their expected statistics. They are beating them by more than anyone else in all of Major League Baseball.
You can see it in one chart. Below, each team’s actual offensive output is plotted against what the model expected. The dotted diagonal is where the two match up. Teams below and to the right of it are producing more than the model says they should, and the Rays, circled, sit further into that corner than any team in baseball. They are not on the edge of the pack. They are off by themselves.
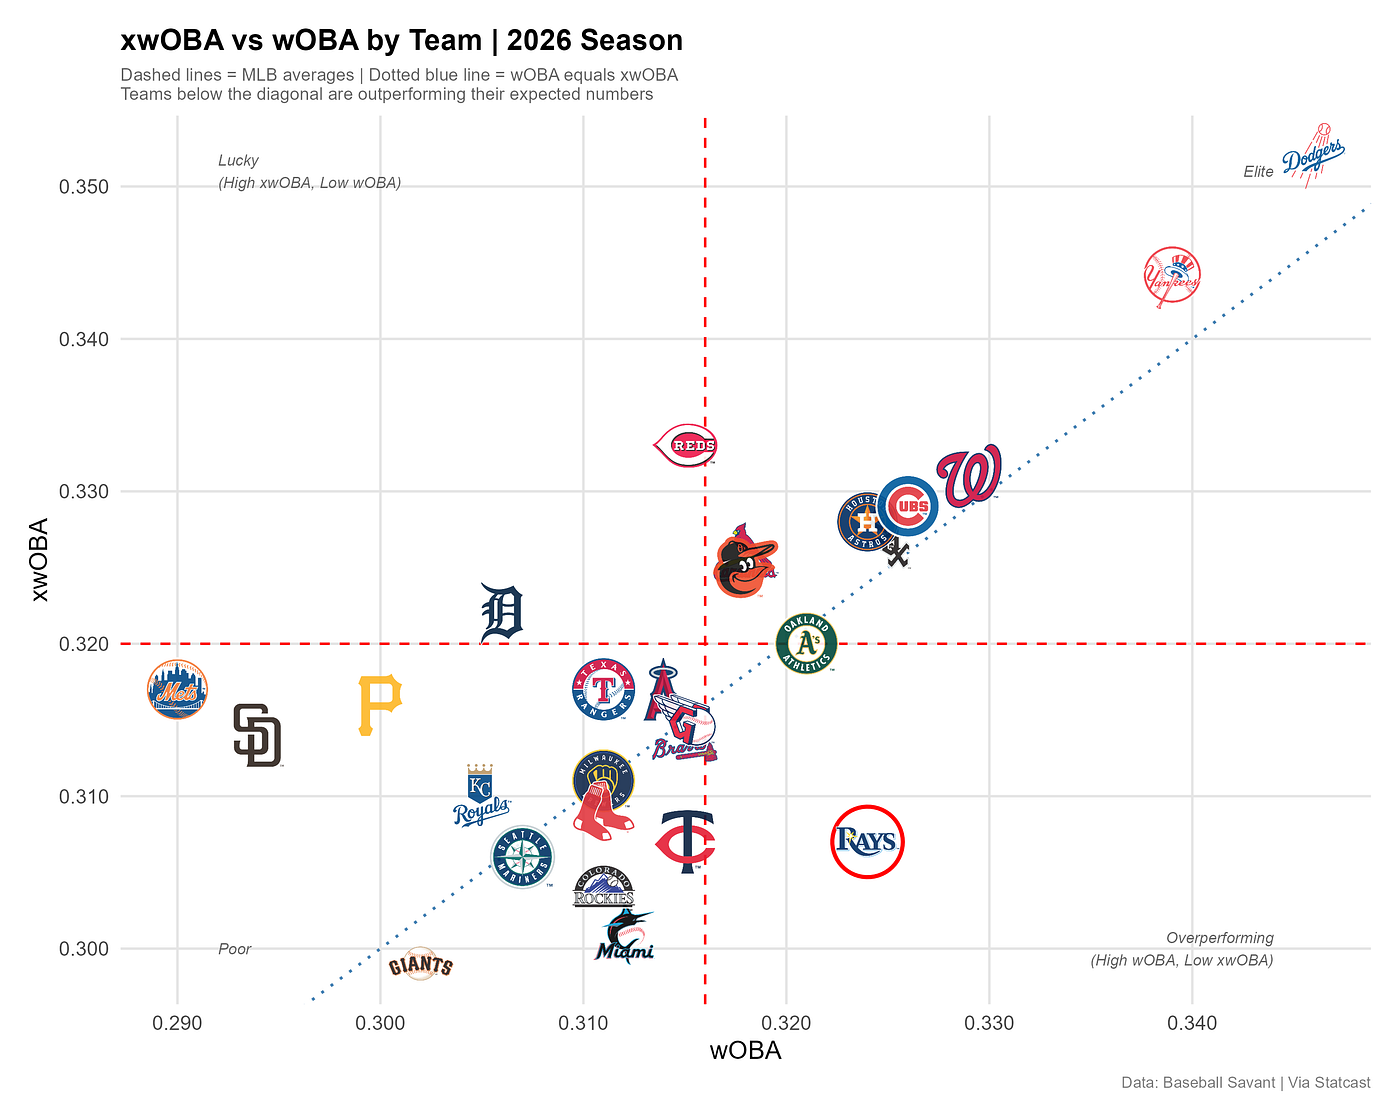
xwOBA vs wOBA by team (2026). Source: Baseball Savant
The table below shows their wOBA against their xwOBA over the last three seasons. wOBA, or Weighted On-Base Average, is a single number that captures how much offensive value a player or team is creating per plate appearance, weighting walks, singles, doubles, and home runs differently based on how much each one actually helps a team score. xwOBA is the expected version, built entirely from contact quality. A positive gap means the team is producing more than the model says they should.
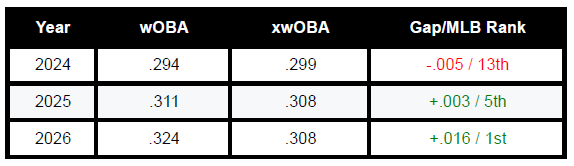
Rays wOBA vs. xwOBA (2024 to 2026). Source: Baseball Savant, as of 6/2/26.
In 2026, that gap is plus-16 points, the largest in baseball. Two months is a small enough sample that the exact margin will move, and whether it holds at plus-16 is a fair question. But the gap is large, it is not just one stat, and it lines up with how the roster was built. And it is not just wOBA where you see it. Their batting average is .258 against an expected .242. Their slugging is .388 against an expected .368. Their production on balls put in play (wOBAcon) is .355 against an expected .333. It shows up across every category.
This is not a one-year fluke either. They went from 13th in that gap in 2024, to 5th in 2025, to 1st in 2026. As the front office rebuilt the roster, out went Brandon Lowe to Pittsburgh and Josh Lowe to the Angels, and in came a contact-and-speed profile that most of the industry stopped chasing years ago. The trend line matches the roster construction almost perfectly.
One piece of context belongs on that multi-year trend. In 2025, the Rays did not play at Tropicana Field. Hurricane damage forced them to spend the entire season at George M. Steinbrenner Field, the Yankees’ spring training park across town in Tampa, before moving back to the Trop for 2026 season. That matters because expected stats are sensitive to ballpark, and a full season in a different, unfamiliar environment adds noise to any single-year read. The honest takeaway is that the Rays beat their expected numbers in 2025 anyway, in a park the model had no settled baseline for, which makes the multi-year pattern more convincing rather than less.
There is one more layer that makes this even more striking. Across the whole league, actual production tends to run about four points below what the model expects every year. The average MLB team does not break even with the model; they trail it slightly. So when you measure the Rays against that real-world baseline rather than zero, their edge over the field grows from 16 points to roughly 20. They are not just first. The chart at the top of this section shows the distance literally. They are in a different zip code.
Their wRC+, a number that captures overall offensive production adjusted for ballpark and era, with 100 representing league average, sits at 103, tied for 10th in baseball. A team that Statcast thinks is a below-average offense is producing an above-average one. That is the whole argument in one sentence.
Why the Model Misses Them
To understand how the Rays are pulling this off, you need to understand what the expected stats model is actually measuring, because there is a real gap between what it captures and what scores runs, and the Rays have built their entire roster inside of it. xwOBA was never designed to measure speed or sequencing. It is a contact-quality model doing exactly what it was built to do. The Rays are not beating a broken model. They are living in the space it was never built to cover.
xwOBA is essentially a damage model. It is built around how hard you hit the ball. The numbers that drive it up are exit velocity, barrel rate, and hard-hit rate. But the numbers that correlate most closely with actual runs scoring, the ones that end up on the scoreboard, are a different list entirely. The gap between those two lists is where the model has been quietly wrong for years.
The table below shows that gap, measured across qualified hitter-seasons. The three-year gap column is the correlation to actual wOBA minus the correlation to xwOBA. Think of it as a measure of how much each skill is over- or undervalued by the model. A positive number means real run production rewards that skill more than the model does. A negative number means the model is giving that skill too much credit.
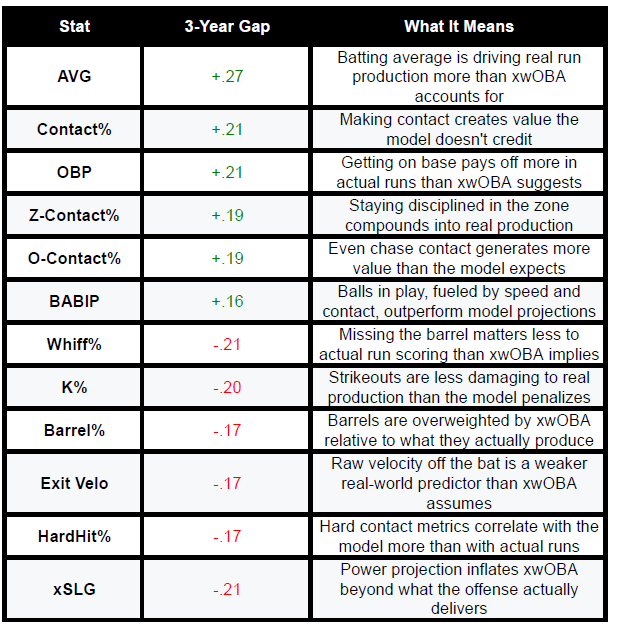
3-Year Gap Correlations: Actual wOBA vs. xwOBA. Source: app.stockyardbaseball.com
The pattern is the same every single year. The model loves hard contact and essentially penalizes putting the ball in play without power. Actual run production rewards both, and it rewards contact and batting average noticeably more than the model accounts for. This is not a 2026 quirk. This is how xwOBA is designed, and it has been this way since the beginning.
There is also a ballpark wrinkle that compounds the problem for this specific team. Tropicana Field suppresses hard contact more than almost any park in baseball. On Baseball Savant’s park factors, the Trop carries a HardHit factor of 92, meaning hard-hit balls there produce less than they would in a neutral environment. So a Rays hitter is being judged by a model that prizes exit velocity, while playing half his games in a stadium that quietly mutes what that exit velocity is worth. The model penalty and the park penalty point in the same direction.
Now connect that to the Rays. They have the lowest strikeout rate in all of baseball at 18.6 percent, meaning they put the ball in play more than anyone. They rank near the top of the league in contact rate on pitches in the strike zone and on pitches they chase out of it. They take among the fewest swords in baseball, tied for second-fewest at 58 behind only the Tigers, a sword being a swing that is ugly and in a non-competitive location. They are among the league leaders in batting average at .258.
Every single category where the model comes up short is a category this team leads. That is not a coincidence. That is the whole explanation for why their expected numbers read below average while their actual production reads above it.
Which raises the obvious next question. If the Rays are built on contact and speed, are those skills real and repeatable, or are we just watching two good months? That is worth answering directly.
These Skills Are Not Going Anywhere
One thing that often gets lost when a team does something like this is whether the underlying skills are real and repeatable or whether it is just a stretch of good luck. For the Rays, the answer is pretty clear.
Contact and discipline are the most repeatable skills in baseball. The table below comes from a year-over-year stability study of 25 hitting metrics across qualified hitter-seasons from 2015 to 2026, pulled from Robert Stock’s Stockyard Baseball website. The R-squared number next to each stat represents how sticky that skill is from one year to the next. Think of it like a consistency score. A number close to 1 means players who are good at this skill stay good at it. A number close to 0 means it bounces around and is harder to count on.
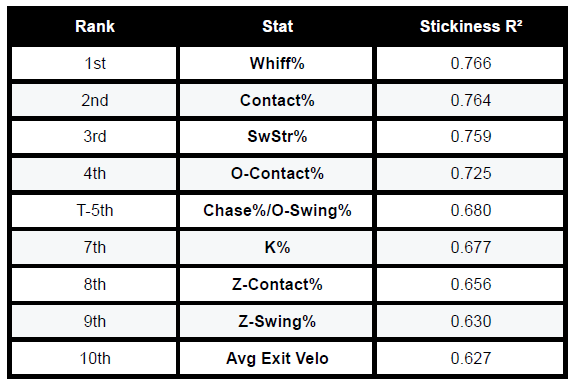
Top 10 in Stickiness from 2015 to 2026. Source: app.stockyardbaseball.com
Every contact and discipline skill the Rays are built around sits above exit velocity in that ranking. Exit velocity is the metric the industry has treated as the most reliable indicator of offensive talent for the better part of a decade. The skills powering this Rays offense are not lucky variance. They are among the most stable and repeatable skills in the sport, and they belong to these players. The model does not fully credit them for it, but the scoreboard does.
Who Is Actually Doing This
Now here is where I want to push back on the lazy take, because this is not just a team that slaps singles around. There is a real identity here, and it is built intentionally.
Junior Caminero is the exception. He is 22 years old, he is arguably the Rays’ franchise cornerstone, and I say this as someone who spent five straight days watching him play at Tropicana Field: I do not think I saw him not smiling once. But the personality is not the point here, the bat speed is. Out of 214 qualified hitters this season, Caminero ranks first in bat speed at 79.9 mph, first in fast-swing rate at 88.3 percent, and has the longest swing in the game at 8.53 feet. His actual production sits close to what the model expects, his wOBA running just 8 points above expected and his batting average dead even with it, because his power is genuine and the model is built to reward exactly that. That small gap is the tell. He is the one hitter in this lineup the model mostly gets right. He has 14 home runs and one of the highest barrel rates in the lineup. He is the power floor for this offense.
Outside of Caminero, the Rays’ qualified hitters cluster near the bottom of the league in bat speed, with Simpson, Aranda, and Mullins among the slowest swings in the game. That is not a flaw. That is the design.
Yandy Diaz is the lineup’s anchor on the other side of the spectrum. Unlike the contact-and-speed guys, Diaz swings with slightly above-average bat speed and barrels the ball at a 9.6 percent clip, above the league average of 8.2, so he is not beating the model the way the rest of this group does. He is just a genuinely good hitter. His production is running 28 points above expected and his batting average 24 points above expected, though it is worth being honest that over his career he has run about even with the model, so this is a strong year landing above his own baseline rather than a permanent edge. His role here is not to defy the model. It is to give a contact-and-speed lineup a real middle-of-the-order bat to hit around, which is what keeps the whole approach from being a gimmick.
Chandler Simpson is the archetype for the speed half of this. He ranks 210th out of 214 qualified hitters in bat speed at 64.9 mph. He essentially never tries to swing hard. He has the shortest swing on the Rays’ qualified list. And yet he ranks third in all of baseball in squared-up rate at 41 percent, a stat that measures how consistently a hitter makes clean, centered contact. That skill produces a .279 batting average and actual offensive production that runs 33 points above what the model expects, one of the largest gaps on the roster among everyday players. His expected numbers already give him some credit for his speed on grounders and line drives. The fact that he still beats the model by that much comes down to his legs turning balls that would be routine outs for almost anyone else into hits.
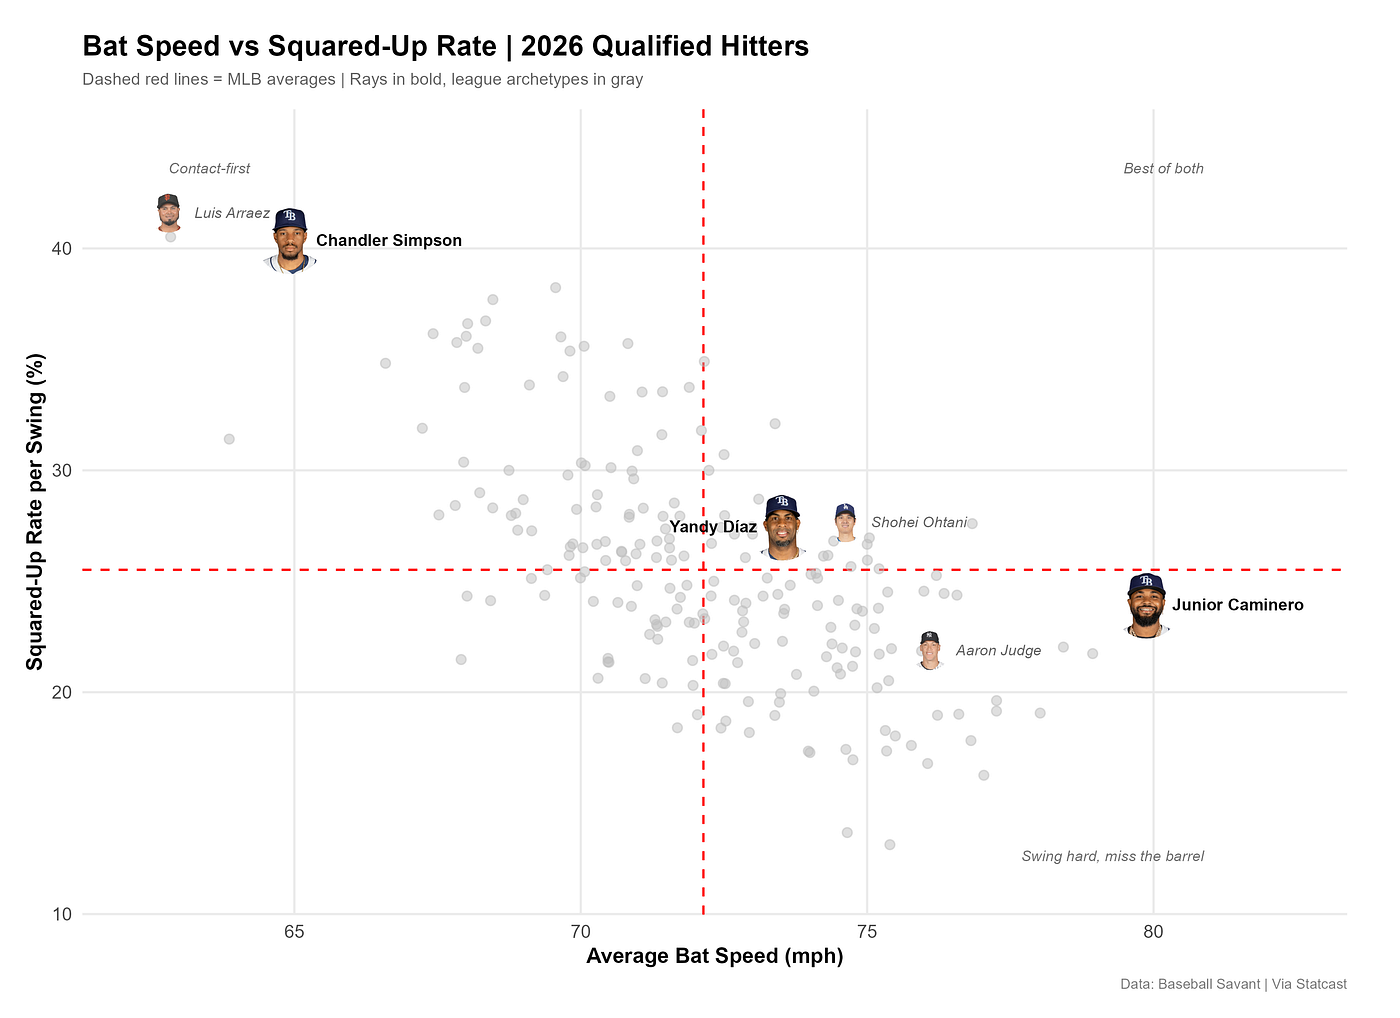
One masher. One anchor. A wall of contact-and-speed guys. That is this offense.
Speed Is The Engine
A contact-driven offense only works if balls in play become hits and bases. Speed is what turns it from a fun idea into actual runs.
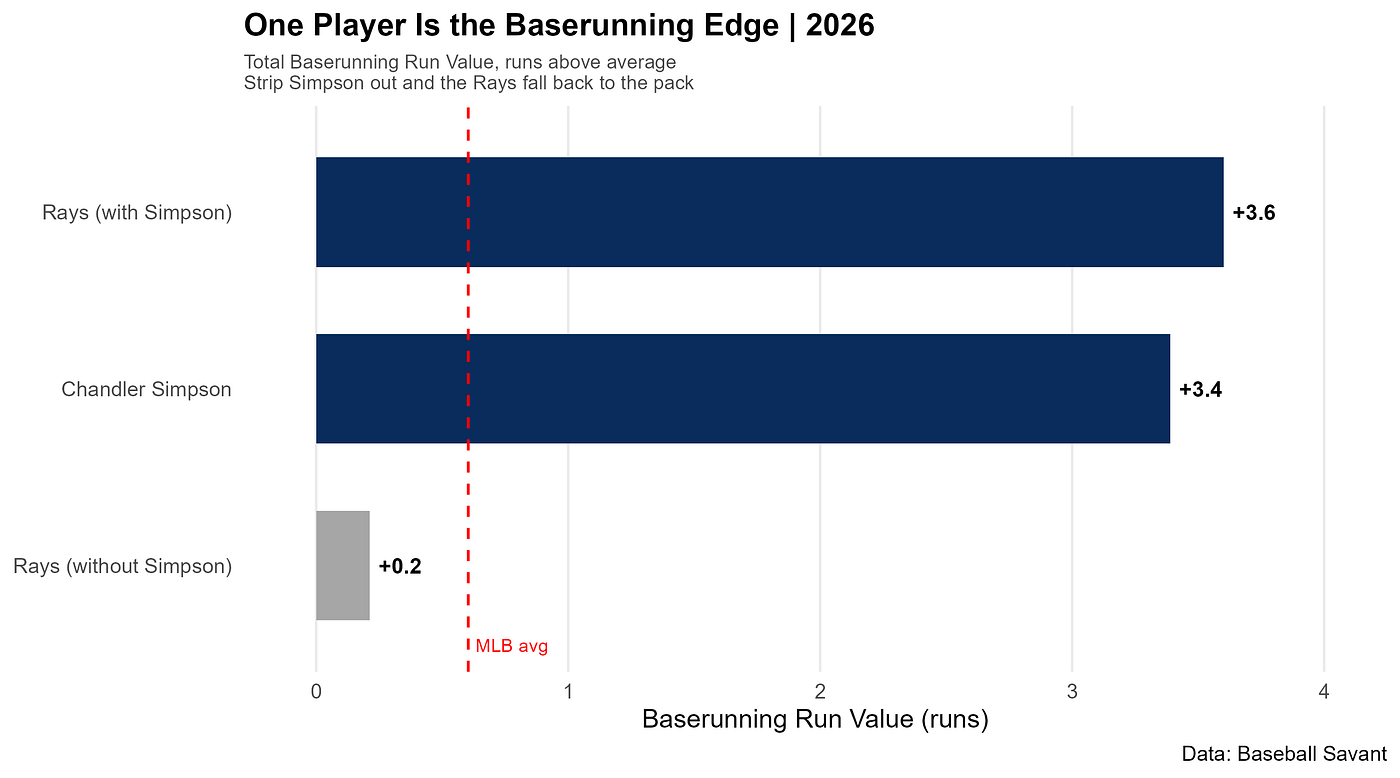
By Baseball Savant’s Baserunning Run Value, which measures how many runs a team gains or loses on the bases compared to an average team, the Rays grade as a good baserunning club, sitting seventh in baseball. They rank first in Extra Bases Taken Run Value, meaning no team in baseball is better at turning singles into doubles and doubles into triples by reading the ball and running aggressively. But the team number comes with a heavy asterisk, and it is worth being honest about it. Almost all of that value is one man. The Rays sit at plus-3.6 runs on the bases. Chandler Simpson alone accounts for plus-3.4 of it. Strip him out and the rest of the roster is plus-0.2, a hair below the league average of plus-0.6. He is not pulling the number up. He more or less is the number.
The ballpark helps too, though in a specific way worth being precise about. Tropicana Field is not a hitter’s paradise. Its overall park factor on Baseball Savant’s 2026 single-year marks sits at 103, barely above neutral and behind a half-dozen more generous parks. But its triples factor is 135, fifth-highest in baseball, trailing only big-outfield parks like Comerica, Chase, Coors, and Oracle. That is the one number that matters for this roster. Triples are the extra-base hit that speed and contact produce rather than power, and the Rays play half their games in a park that inflates exactly that outcome. The stadium is not helping them slug. It is amplifying the specific skill they built the team around, which is precisely the kind of edge that never shows up in a hitter’s expected numbers.
One honest note worth including here. FanGraphs tracks baserunning value using a different system called BsR, and by that measure, the Rays sit a bit above average at plus-2.8. The two systems weigh stolen bases and extra bases taken differently, which is why they do not line up exactly, but both point the same direction, and both point at the same player. The most accurate read is that the Rays are a slightly above-average baserunning team carried into good territory by one elite speed threat. Either way, the speed is real, and it is doing real work for this offense.
The Other Half
You do not lead the AL East on offense alone, and the pitching side of this story matters because it follows the exact same pattern.
The Rays have a 3.98 ERA, which sits around 13th best in baseball. ERA is the traditional measure of how many runs a pitcher or staff allows per nine innings. But when you look at the expected versions of that number, metrics that strip out sequencing and luck and focus purely on the quality of contact allowed, the staff looks considerably worse. Their xERA of 4.41 ranks 23rd, bottom third of the league, and their FIP and xFIP tell the same story. That is the same gap that defines the offense, just on the mound: the results are good, the expected numbers say they should not be. Their strikeouts per nine innings at 7.64 rank among the lowest in baseball, meaning their pitchers are getting outs by inducing weak contact rather than missing bats entirely. The contact-over-damage identity does not just live in the lineup. It runs through the entire organization on both sides of the ball.
A quick note on defense, because it matters for the full picture. The Rays rank 22nd out of 30 teams in Outs Above Average, which is Baseball Savant’s measure of how many outs a defense creates above or below what an average defense would. Multiple other defensive metrics agree that this is not a strong defensive roster. They run well, and they field poorly, and those are two genuinely different things.
The takeaway from all of it is that actual results are running ahead of expected numbers on both sides of the ball. Their staff is allowing opponents to hit for a lower average on balls in play than their defense alone can explain, a .268 mark that ranks among the best in baseball sitting behind a defense that grades out in the bottom third. I want to be careful not to overclaim here. The simplest read is some mix of sequencing and a soft-contact staff, not proof that the offensive blind spot mirrors itself on the mound. But it is at least worth flagging that the same contact-over-damage pattern shows up on both sides of the ball.
The Efficiency Bookend
Here is the part that ties the whole thing together, because all of this is happening on roughly $87 million, the third-lowest payroll in baseball. Only the Cleveland Guardians and the Miami Marlins spend less.
WAR, or Wins Above Replacement, is a single number that attempts to capture how many wins a player or team contributes beyond what a freely available replacement-level player would. The Rays are sitting at roughly 12.9 team WAR on the season, with position players contributing about 7.7 and pitching about 5.2. Spread their $87 million payroll across that production and it comes out to about $6.8 million per win. That is not the same thing as the open-market price, though. When you calculate what free agents projected for two-plus wins actually signed for this offseason, the rate comes out to about $8.6 million per win, and the Rays are getting their production for less than that. But the comparison flatters them, and it is worth being honest about why: the $6.8 million figure is a whole-roster number, and every roster is full of cheaper pre-arbitration players who make that math look better than the open market ever would. The stronger claim, and the one that actually holds up, is simpler than that: the third-lowest payroll in baseball is producing 12.9 wins above replacement and sitting in first place in the AL East.
That is the real number. And what makes it more impressive is that they are doing it by being genuinely good at things the rest of the industry stopped valuing. You can see it in one picture. Plot every team’s offensive output against what they spend, and the Rays sit on the far left of the payroll axis, above the league-average line. The Dodgers and Yankees run better offenses, but they are buying them at three and four times the cost. The more telling part is everyone in between. The Phillies and Blue Jays, both pushing $290 million, sit at or below the line the Rays are above, paying more than three times as much for an offense that is no better.
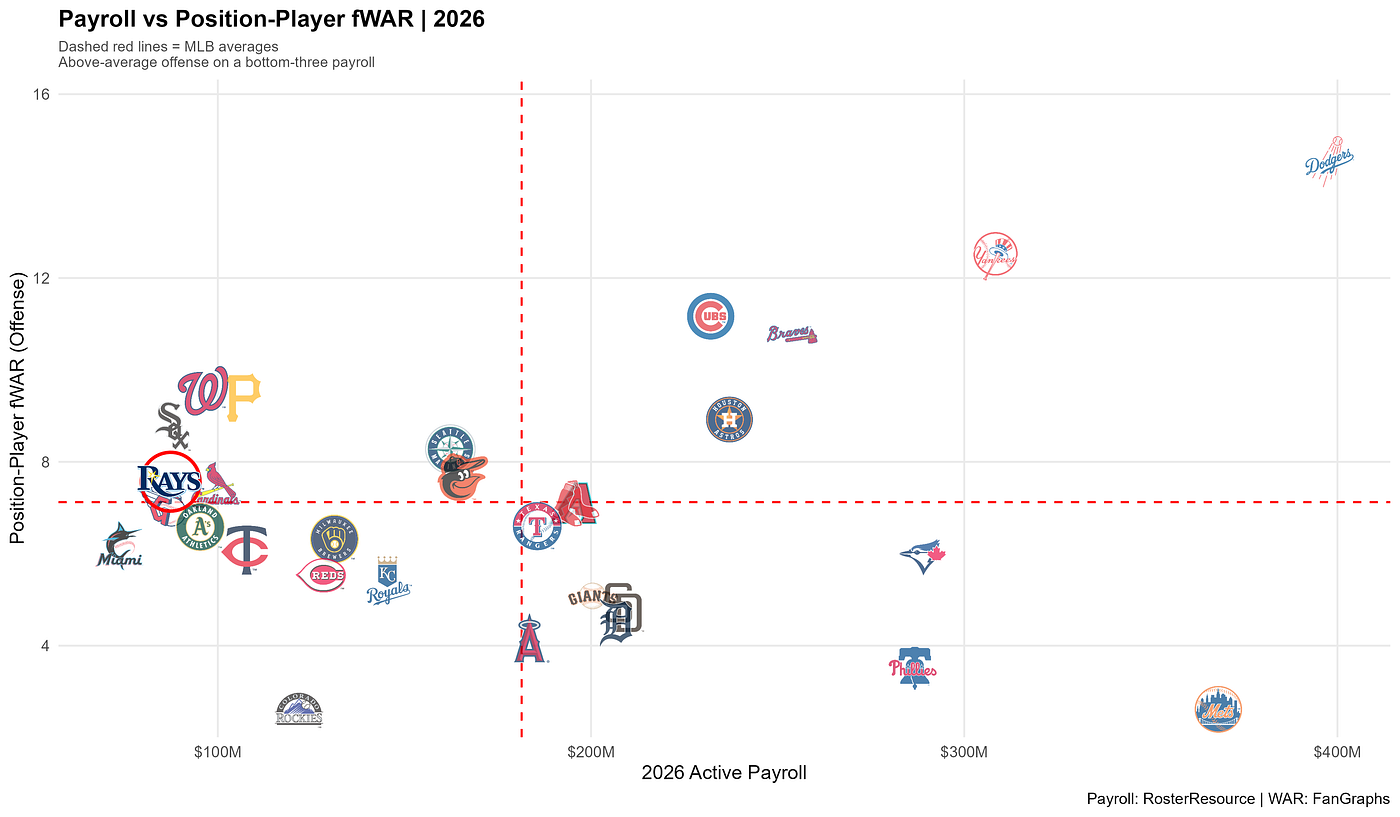
They did not find a loophole. They found a real inefficiency in how the models evaluate offense, built a roster around it from top to bottom, and are now sitting in first place in a division that includes the 2025 American League Champion Toronto Blue Jays, the New York Yankees, and the Boston Red Sox.
The skills feeding this are the most repeatable skills in baseball. The blind spot in the model is structural and has been there for years. Whether the exact margin holds all season is a fair question. Whether the approach is real and intentional is not.
메타데이터
- post_id
- f8aecf9ece1a
- slug
- how-the-tampa-bay-rays-are-beating-a-model-that-cant-see-them-f8aecf9ece1a
- url
- https://medium.com/@nickcbland/how-the-tampa-bay-rays-are-beating-a-model-that-cant-see-them-f8aecf9ece1a
- canonical_url
- https://medium.com/@nickcbland/how-the-tampa-bay-rays-are-beating-a-model-that-cant-see-them-f8aecf9ece1a
- author_url
- https://medium.com/@nickcbland
- status
- ok
- fetched_at
- 2026-06-09 15:37:30