A Trillion Every Five Months
The total public debt of the United States, as reported by the Treasury and confirmed by the Senate Joint Economic Committee on 5 August…
A Trillion Every Five Months
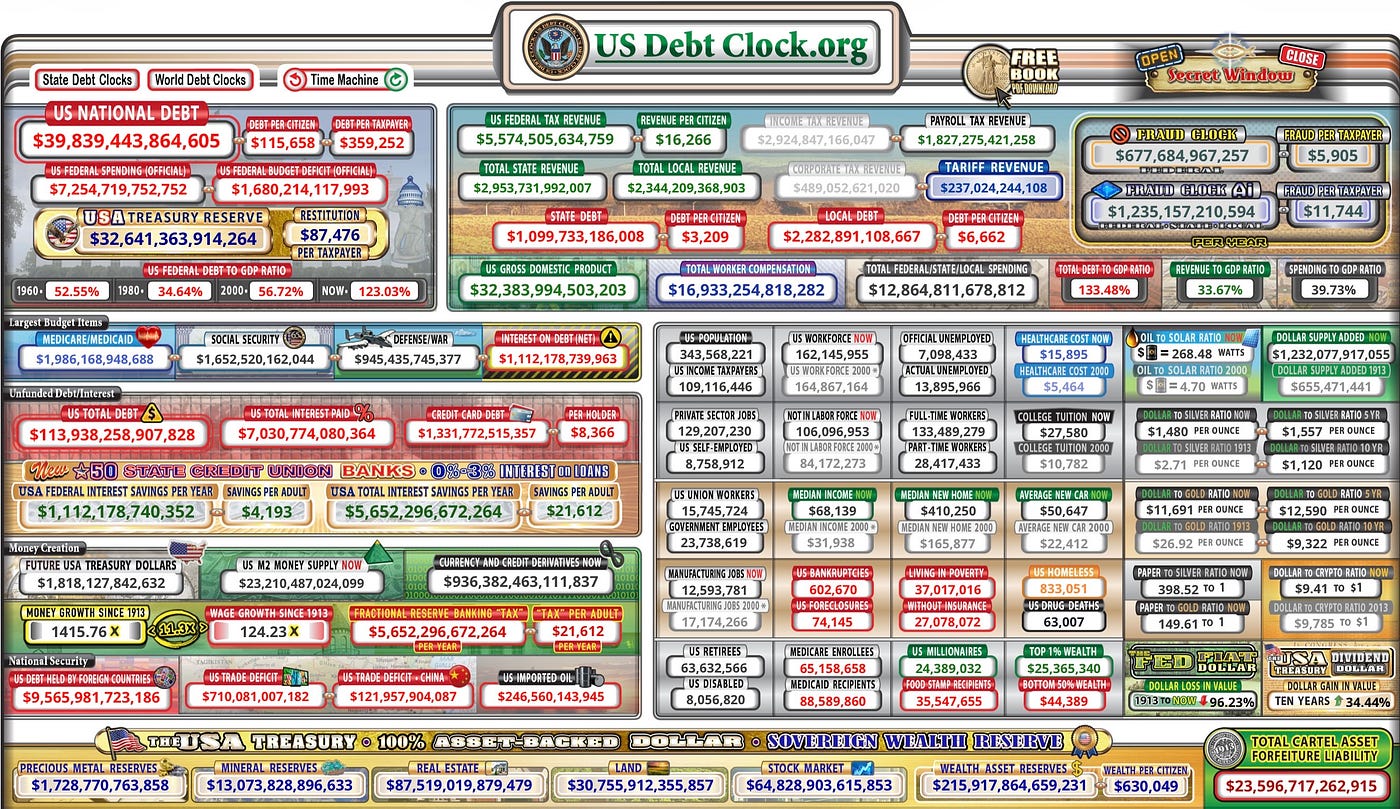
It does not stop, and it has never gone backwards in twenty five years. Image: www.usdebtclock.org (09 Aug 26)
The total public debt of the United States, as reported by the Treasury and confirmed by the Senate Joint Economic Committee on 5 August 2026, is:
$39,830,000,000,000
Twelve zeroes. It is worth looking at them rather than reading past the word “trillion,” because the word is doing an enormous amount of concealment. A trillion is not a large million. It is a million million.
At the current rate of increase, that threshold is likely to be crossed sometime between 18 and 27 August 2026, depending on which recent pace holds.
This series has spent months documenting what a war costs, in interceptors, in appropriations, in household energy bills and in strategic reserves. This piece is about the number underneath all of them, because at a certain scale a debt stops being a financial fact and becomes a constraint on what a state is able to decide.
The question is not whether it can be paid. It is what having it does to a government’s freedom of action and to the institutions that were built on the assumption it would never get this large.
What the Number Actually Is
The composition matters, because the headline figure includes money the government owes itself.
Of the $39.83 trillion, $32.10 trillion is debt held by the public, Treasury securities owned by investors, funds, banks, foreign governments and individuals. The remaining $7.73 trillion is intragovernmental, principally the Social Security and Medicare trust funds. That portion is a claim by one arm of the state on another.
Per person, the total works out at $116,480. Per household, $295,494.
The rate of increase over the past year has averaged $7.91 billion per day. Over the most recent thirty days the pace has run higher at roughly $12.6 billion. Debt to GDP is approximately 123%.
Fiscal year 2025 closed at $37.64 trillion. Fiscal 2026 is on track to close near $40 trillion. Debt has risen in every fiscal year since 2001.
Tier: Established. Figures from the Treasury’s Debt to the Penny dataset, the Senate Joint Economic Committee’s monthly debt update of 7 August 2026, and Treasury Fiscal Data.

Twelve zeroes. The word conceals more than it conveys. All images generated by author unless stated
What It Would Buy
Abstractions at this scale are not comprehensible, so here is the same number in units that are.
Set against the median American teacher’s salary of roughly $65,000, the debt represents 613 million teacher years. Against a registered nurse’s median of around $86,000, 463 million nurse years.
A large new hospital costs somewhere between one and two billion dollars to build. At $1.5 billion, the national debt would build more than 26,500 of them. The United States currently has around 6,100 hospitals in total.
Against median household income of roughly $80,000, the debt represents 498 million household years of gross income, in a country containing about 131 million households.
None of those comparisons is a policy proposal. Nobody is going to build 26,500 hospitals. They exist to make a number legible, because a figure that cannot be pictured cannot be reasoned about and a great deal of political argument depends on that.
But the comparison that does the most work is smaller and more current.
Interest on the debt is now running at approximately $1.08 trillion a year — around $2.96 billion every day.
One day’s interest, on its own, builds two large hospitals.
Tier: Analytical. The comparisons are arithmetic performed on the verified debt total using published median salary and construction cost figures. They are illustrative, not projections.

One day’s interest. Two hospitals. Neither of them built.
The Interest Is the Story
The total is arresting. The trajectory of the interest bill is what actually constrains a government.
In October 2020, net interest paid over the preceding twelve months was $345 billion. By October 2025 the same measure was $981 billion. It has nearly tripled in five years and it is now the fastest growing line in the federal budget.
Two things drove it: the debt got bigger and the price of carrying it went up. The average interest rate on total marketable debt was 1.583% five years ago. As of June 2026 the weighted average across all interest bearing Treasury debt was 3.41%, 3.71% on bills, 3.28% on notes, 3.43% on bonds.
That second factor is the one that compounds. Debt issued cheaply in the 2010s and during the pandemic matures and is refinanced at current rates. Nothing has to be borrowed for the interest bill to rise; the existing stack simply reprices.
Which brings in the structural detail that receives least attention. The average maturity of the debt stood at 71 months as of the last confirmed Treasury reading (30 June 2026) and was shortening, it was 72 months a year earlier.. Around a fifth of outstanding public debt is in Treasury bills of one year or less.
Shorter maturity means the whole stack reprices faster. It reduces borrowing costs when rates are falling and it removes the buffer when they rise.
Tier: Established. Treasury Fiscal Data and Joint Economic Committee monthly debt updates.

The stack reprices whether or not anything new is borrowed.
What Cannot Be Done About It
There are four routes out of a debt this size. All four are known, none is novel and the reason nothing happens is that each is either painful or unavailable.
Grow out of it. This is the historically proven route and it has been done. Between 1945 and the mid 1970s the United States took debt from 106% of GDP to about 23% without ever paying down the nominal amount. The debt did not shrink; the economy outgrew it. It required sustained growth above the interest rate for three decades.
Inflate it away. Inflation reduces the real value of fixed rate debt. This is a default on creditors conducted quietly and combined with negative real interest rates, a condition economists call financial repression, it did much of the work in that same post-war period. It requires a captive buyer base, and the post-war version involved capital controls and a banking system with nowhere else to put its money.
Run a primary surplus. Tax more or spend less until revenue exceeds spending before interest. The United States is currently running a deficit of roughly 6–7% of GDP. The drivers are Social Security, Medicare and interest, not the discretionary spending that dominates political argument. Closing that gap in one move is not politically conceivable.
Default or restructure. Never done. It would end the dollar’s reserve currency role and the consequences are cannot be modelled.
And two things that sound like solutions and are not.
The $7.73 trillion of intra-governmental debt could theoretically be cancelled, but that is an accounting entry. The obligation to pay pensions and medical benefits does not disappear because the accounting between two federal agencies is erased.
And the government could print. Money creation does not create goods; spend beyond what an economy can produce and the result is inflation, which is a tax falling hardest on people without assets. The United States has just run a version of that experiment. This series has documented consumer inflation reaching a three-year high of 4.2% in May 2026 and an average household paying roughly $450 more in energy costs against a $384 tax cut.
The constraint is real and it does not announce itself gradually.
Tier: Established for the historical post-war record and the current deficit. Analytical for the assessment of political feasibility.

Four routes. Three are painful and one has never been attempted.
Who Is Owed, and What It Buys Them
The persistent public assumption is that foreign creditors, China above all, hold leverage over the United States through its debt.
The composition says otherwise.
Of the $39.83 trillion, roughly $8–9 trillion is held abroad. The largest foreign holder is Japan, at around $1.1 trillion. China holds approximately $660 billion — under two per cent of the total, down steadily from a peak near $1.3 trillion in 2013.
The leverage argument does not survive first contact with the mechanics. Selling that position rapidly would crash the value of the remainder as it sold. It would drive the yuan sharply upward, which is precisely what Chinese export policy exists to prevent. The Federal Reserve could absorb the supply. And there is no alternative market deep enough to hold three quarters of a trillion dollars, which is the actual reason the position exists.
There is no creditor committee, no repayment date and no mechanism by which anyone forecloses. The United States borrows in a currency it issues, which is why comparisons to household borrowing mislead so badly. It cannot be forced into involuntary default the way Greece or Argentina can.
The real risk is not a creditor demanding payment. It is a rollover failure — roughly nine trillion dollars matures every year and must be refinanced, and if buyers demand materially higher yields, interest costs compound faster than the economy grows.
Meanwhile the slower story runs underneath. Central banks bought 289 tonnes of gold in the second quarter of 2026, up 62% year on year, with 45% of surveyed reserve managers planning to add more over the next twelve months. That is not a run on the dollar. It is diversification at the pace of a glacier, and it is what actual de-dollarisation looks like.
Tier: Established for the holdings data. Analytical for the assessment of Chinese leverage.

No creditor committee. No repayment date. Nobody knocks.
Fiscal Dominance
Here is the consequence that has received the least attention and matters the most.
When debt service reaches a certain scale then a government requires low interest rates in order to remain solvent. That gives it a powerful incentive to ensure the central bank delivers them and monetary policy stops being set for price stability and starts being set for the Treasury’s financing requirements.
Economists call this fiscal dominance. It is not usually associated with developed economies.
The sequence is now visible in the American record and this series has documented each element separately. Consumer inflation at a three-year high. A Federal Reserve that entered 2026 expected to cut and by May was leaning toward a hike. A President publicly attacking the Chair for refusing to cut. A nominated successor moving toward confirmation with no clarity on whether he would pursue cuts or could carry the committee. And a midterm election in November.
Each of those is individually defensible. Assembled, they describe enormous pressure on the one institution whose independence rests on convention rather than statute.
And the connection to the war is direct. Interest is the fastest growing item in the federal budget and it crowds out everything discretionary, including defence. This series has documented Navy and Air Force operational accounts running dry with Congress in recess and a $4.3 billion transfer request stalled. That was reported as an appropriations failure. It is more accurately the leading edge of a structural squeeze that worsens every year regardless of who holds office.
Tier: Established for the individual facts. Analytical for the fiscal dominance frame, which is an interpretive characterisation rather than an official designation.

Its independence was never written down as anything stronger than convention.
The Attribution Problem
A figure this size attracts attribution and almost all of it is wrong in the same way.
Debt has risen approximately $3.7 trillion since January 2025, from around $36.2 trillion. That is verifiable and citable.
What does not follow is that any individual added it. Federal debt is the arithmetic result of appropriations passed by Congress, mandatory spending set by legislation decades old, revenue determined by tax law and economic conditions and interest on borrowing that predates every current officeholder. A president signs bills. A president does not set Social Security outlays and does not control the rate at which existing debt reprices.
The honest construction is “debt has risen $3.7 trillion since January 2025.” The dishonest one is “X added $3.7 trillion.” The second is used by both American political parties, about each other, continuously.
This publication has documented, repeatedly and in unrelated contexts, the mechanism by which an unattributed or misattributed figure hardens into established fact through repetition. Debt attribution is the largest and oldest example in circulation and it survives because both sides find it useful in alternate years.
Tier: Established for the increase. Contested for any causal attribution to an individual officeholder.

A signature is not the same as a cause.
The Pattern, Assembled
First, the constraint is not solvency, it is rollover. A state borrowing in its own currency cannot be forced to default. But nine trillion dollars matures annually and must be refinanced and the average maturity is shortening. That is where the risk actually sits.
Second, the interest bill is the binding item. Net interest nearly tripled in five years, from $345 billion to $981 billion and now runs above a trillion. It is the fastest growing line in the budget and unlike every other line it cannot be legislated down.
Third, the historical escape route required conditions that no longer exist. The 1945–1975 reduction happened through growth plus mild inflation plus financial repression, under capital controls and with a captive banking system, following a war that had ended. None of those conditions is present.
Fourth, foreign leverage is largely a myth and the real exposure is domestic. China holds under two per cent. The largest single creditor bloc is American, trust funds, pension funds, banks, the Federal Reserve and individuals. A debt crisis would be experienced principally by Americans, not inflicted by foreigners.
Fifth, the pressure lands on the central bank. Fiscal dominance is the mechanism by which a debt problem becomes a monetary problem and then an institutional one. The pressure is already visible and it is not obviously reversible.
And sixth, this is the floor under everything else this series has documented. The interceptor stockpile that cannot be replenished before 2029. The operational accounts that ran dry in July. The strategic reserve at a forty three year low. Those are usually reported as separate failures of planning. They are the same constraint arriving in different departments, a state whose fastest-growing budget line is the cost of money it has already spent.
What Remains Open
When forty trillion is crossed. On the twelve-month average pace, around 26–27 August. On the accelerated thirty-day pace, closer to 18–21 August.
Whether the Federal Reserve’s independence holds through the confirmation of a new Chair during an inflationary period with a midterm pending.
Whether the July CPI figure, published 12 August 2026, shows inflation resuming its rise. If it does, the pressure described in Part Six intensifies immediately.
Whether average maturity continues to shorten. It is the single most informative early indicator of financing stress and almost nobody reports it.
What the war has actually added. This series has documented that the Department of Defence has not passed a financial audit in years and produced four irreconcilable cost estimates in three months. The war’s contribution to the debt figure is therefore not calculable from public sources, which is its own finding.
The Verdict
The official position is that United States Treasury securities remain the world’s safest asset, that the government has never defaulted, that debt to GDP remains below the levels of some peer economies and that the Federal Reserve remains independent. Every element of that is accurate.
The evidentiary position is that total public debt stands at $39,830,000,000,000; that it has risen by $2.88 trillion in a single year and is increasing by roughly $8 billion a day; that net interest has nearly tripled in five years and now exceeds a trillion annually, making it the fastest growing item in the federal budget; that the average maturity of the debt is shortening, so the stack reprices faster; and that of the four available routes to reduction, three are politically unavailable and the fourth requires conditions that took a world war and capital controls to produce last time.
The finding is not that the United States cannot pay its debts. It is that the debt has grown large enough to start determining what the United States is able to decide.
A government paying nearly three billion dollars a day in interest needs low rates more than it needs price stability. A government whose fastest growing budget line is the cost of past spending has less room for present spending, whatever it wants to do. And a government in that position applies pressure to a central bank whose independence exists because everyone has agreed to pretend it is a rule.
The number is not the problem. The number is twelve zeroes on a Treasury page, updated daily and nobody is coming to collect.
What it buys, quietly and without a vote, is a narrowing of the choices available to everyone who comes next.

Nobody is coming to collect. The choices narrow anyway.
This article is part of the What If AI Investigated series, applying structured evidence-tiering to documented public records. Claims are classified as Established, Contested, or Unresolved according to what the evidence supports. Figures are sourced to the US Treasury and the Senate Joint Economic Committee. Where a figure is arithmetic performed on those totals, it is identified as illustrative.
메타데이터
- post_id
- f943c8396cb6
- slug
- a-trillion-every-five-months-f943c8396cb6
- url
- https://medium.com/what-if-ai-investigated/a-trillion-every-five-months-f943c8396cb6
- canonical_url
- https://medium.com/what-if-ai-investigated/a-trillion-every-five-months-f943c8396cb6
- author_url
- https://medium.com/@jamie_gray027
- status
- ok
- fetched_at
- 2026-08-12 11:07:36