A Practical Guide to Data Metric Functions (DMFs) in Snowflake
Why Data Quality Comes First

A Practical Guide to Data Metric Functions (DMFs) in Snowflake
Why Data Quality Comes First
Every data team talks about dashboards, pipelines, and models. Few talk about the thing that makes all of them trustworthy: data quality. Most teams catch data quality issues reactively: a dashboard looks wrong, a report doesn’t add up, a stakeholder asks, “why does this number seem off?” By then, the damage is done.
Here’s the uncomfortable truth — your analytics are only as good as the data behind them. A perfectly built dashboard built on dirty data is just a beautiful lie.
The Cost of Ignoring Data Quality:
· Revenue impact. A pricing table with stale values? You just sold 10,000 units at last quarter’s discount.
· Lost trust. When a VP catches a wrong number in a board deck, they stop trusting every number. Rebuilding that trust takes months.
· Wasted engineering time. Without quality checks, engineers spend 40–60% of their time investigating “is the data wrong, or is the logic wrong?” The answer is almost always the data.
· Compliance risk. Regulations like GDPR and CCPA assume your data is accurate. If it isn’t, you have a legal problem, not just a data problem.
The Problem
Bad data is expensive. A NULL that slips into a critical column, a broken foreign key, stale data that hasn’t refreshed in days — these issues compound silently until someone makes a bad decision based on bad numbers.
Snowflake’s Data Metric Functions (DMFs) flip the script. Instead of discovering problems after the fact, DMFs let you define quality rules directly on your tables and run them on a schedule — automatically, continuously, and natively inside Snowflake. Think of DMFs as unit tests for your data, running in production, on a cron.
What Exactly Is a DMF?
A Data Metric Function (DMF) is a specialized SQL function in Snowflake that measures single aspect of data quality on a table or view and returns a NUMBER. It can be attached to tables, scheduled to run automatically, and its results are stored for trending, alerting, and compliance.
That’s it. No external tools, no orchestrators, no Python scripts polling your warehouse at 3 AM.
Requirements: Snowflake Enterprise Edition or higher.
Two Types of DMFs
Type 1: System DMFs (Built-in)
Provided by Snowflake under SNOWFLAKE.CORE. Ready to use — no code required.
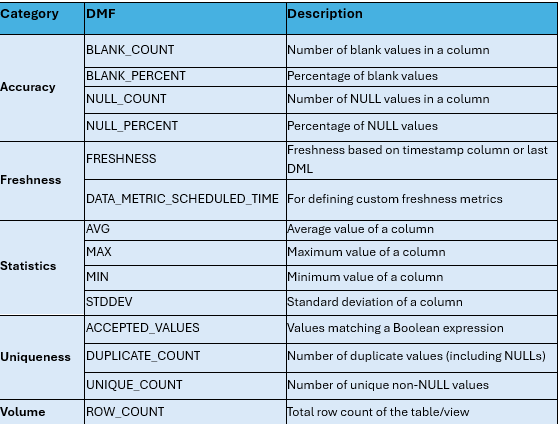
ALTER TABLE analytics.core.orders
  ADD DATA METRIC FUNCTION SNOWFLAKE.CORE.NULL_COUNT
    ON (customer_id);
Done. Snowflake will now track NULLs in customer_id every hour by default.
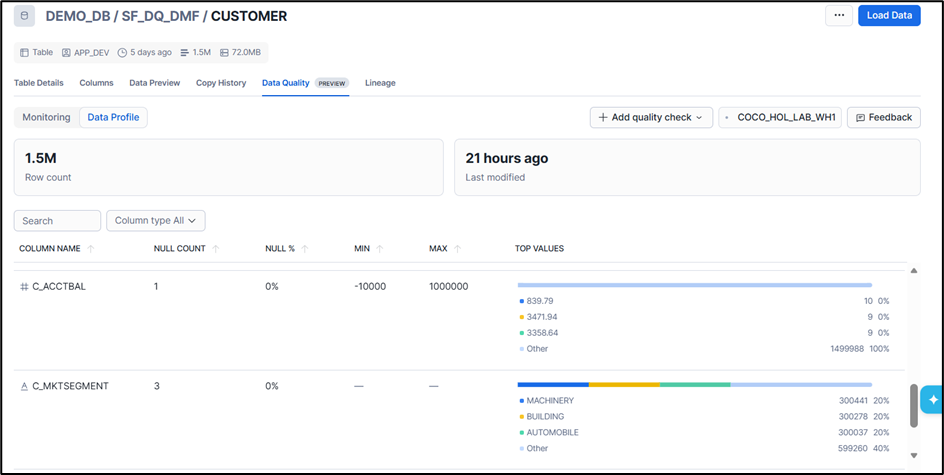
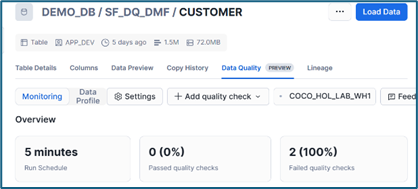
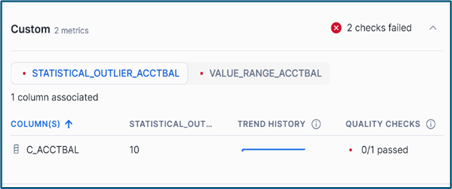
We can also keep a track of it in: Snowsight → Data → Databases → Select Table → Data Quality tab
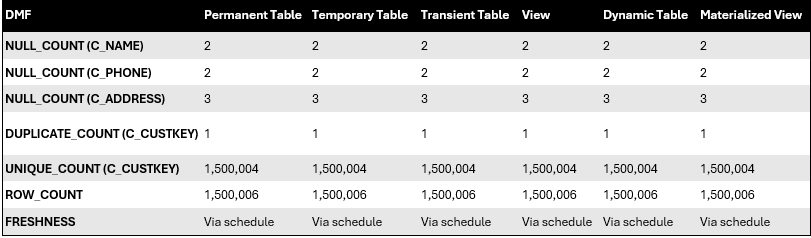
Supported table kinds
· DMFs are supported on permanent, temporary, transient tables, views, dynamic tables, materialized views, external tables, and Iceberg tables.
· Event tables have a fixed schema and don’t support column-level DMFs.
· All object types return consistent results when querying the same underlying data.
· Scheduling works on all types — we set DATA_METRIC_SCHEDULE = ‘5 MINUTE’ on every object and DMFs ran automatically.
Type 2: Custom DMFs (User-defined)
You write these yourself for domain-specific checks (e.g., email validation, value ranges, cross-column logic).
Writing Your First Custom DMF
System DMFs cover the basics, but real-world data quality is messy. Let’s say you need to catch invalid email addresses. No built-in DMF does that — so you write your own.
Step 1: Create the Function
CREATE OR REPLACE DATA METRIC FUNCTION governance.dmfs.invalid_email_count(
  arg_t TABLE(arg_c1 VARCHAR)
)
RETURNS NUMBER
AS
$$
  SELECT COUNT(*)
  FROM arg_t
  WHERE arg_c1 IS NOT NULL
    AND arg_c1 NOT LIKE '%_@_%.__%'
$$;
Step 2: Test It Manually
Before attaching it to anything, run it directly:
SELECT governance.dmfs.invalid_email_count(
  SELECT email FROM analytics.core.customers
);
If it returns 0, your emails are clean. If not, you know the function works.
Step 3: Attach It to a Table
ALTER TABLE analytics.core.customers
  ADD DATA METRIC FUNCTION governance.dmfs.invalid_email_count
    ON (email);
Step 4: Set a Schedule
-- Run every 30 minutes
ALTER TABLE analytics.core.customers
  SET DATA_METRIC_SCHEDULE = '30 MINUTE';

-- Or use cron: daily at 6 AM UTC
ALTER TABLE analytics.core.customers
  SET DATA_METRIC_SCHEDULE = 'USING CRON 0 6 * * * UTC';

-- Or trigger on data changes
ALTER TABLE analytics.core.customers
  SET DATA_METRIC_SCHEDULE = 'TRIGGER_ON_CHANGES';
DMFs can accept multiple tables, which unlocks referential integrity checks.
Viewing Results
DMF results land in a built-in table function:
SELECT *
FROM TABLE(
  SNOWFLAKE.LOCAL.DATA_QUALITY_MONITORING_RESULTS(
    REF_ENTITY_NAME   => 'analytics.core.customers',
    REF_ENTITY_DOMAIN => 'TABLE'
  )
)
ORDER BY MEASUREMENT_TIME DESC;
This returns columns like METRIC_NAME, VALUE, MEASUREMENT_TIME, and ARGUMENT_NAMES — everything you need to trend, alert, or dashboard.
Storing of DMF
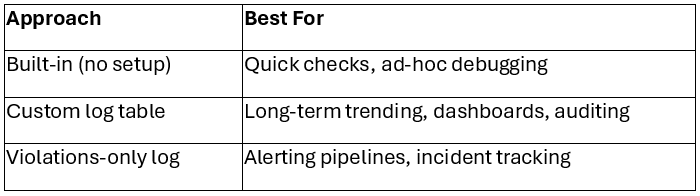
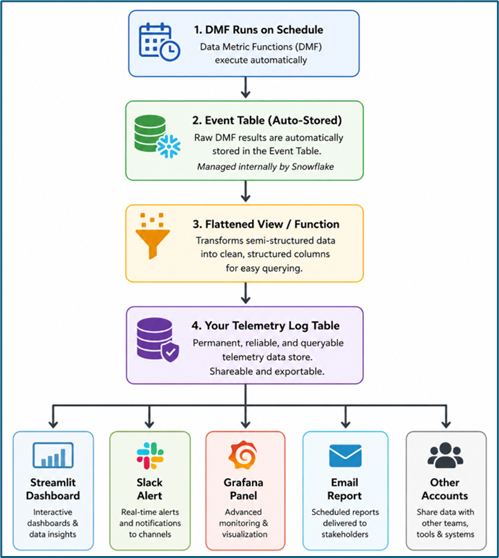
DMF results are automatically stored by Snowflake -you don’t need to build your own logging. But you can also create a custom log table if you want more control.
When to Use Which
Observability Pipelines with DMF Results
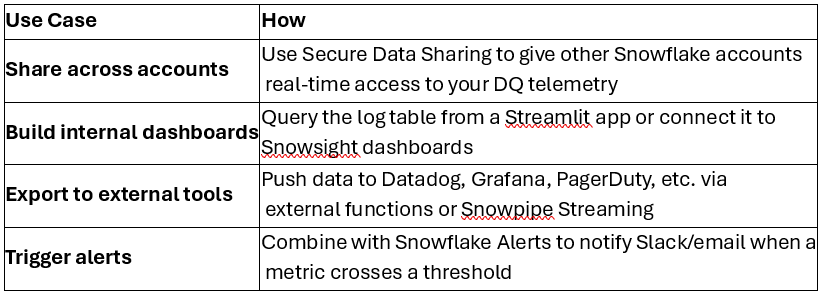
Beyond just querying DMF results, you can feed them into observability pipelines — making data quality visible across teams, accounts, and external tools.
Step 1: Create a Telemetry Log Table
CREATE TABLE IF NOT EXISTS governance.logs.dq_telemetry_log (
    measurement_time TIMESTAMP_LTZ,
    metric_name      VARCHAR,
    table_name       VARCHAR,
    value            NUMBER,
    captured_at      TIMESTAMP_LTZ
);
Step 2: Create a Task to Capture Results Hourly
CREATE OR REPLACE TASK governance.logs.capture_dq_telemetry
  WAREHOUSE = my_wh
  SCHEDULE  = 'USING CRON 0 */1 * * * UTC'
AS
  INSERT INTO governance.logs.dq_telemetry_log
  SELECT
      MEASUREMENT_TIME,
      METRIC_NAME,
      TABLE_NAME,
      VALUE,
      CURRENT_TIMESTAMP() AS captured_at
  FROM TABLE(SNOWFLAKE.LOCAL.DATA_QUALITY_MONITORING_RESULTS(
      REF_ENTITY_NAME   => 'MY_DB.MY_SCHEMA.MY_TABLE',
      REF_ENTITY_DOMAIN => 'TABLE'
  ))
  WHERE MEASUREMENT_TIME > DATEADD('hour', -2, CURRENT_TIMESTAMP());

ALTER TASK governance.logs.capture_dq_telemetry RESUME;
Step 3: Use It Downstream
Once results are in your telemetry log table, you can:
In brief
Practical Tips
- Start with system DMFs. NULL_COUNT, ROW_COUNT, and FRESHNESS catch 80% of issues with zero custom code.
- Use TRIGGER_ON_CHANGES for high-traffic tables. It avoids unnecessary runs when data hasn’t changed.
- Organize DMFs in a dedicated schema like governance.dmfs — keeps them discoverable and access-controlled.
- Test before attaching. Always call a DMF manually first. A broken DMF on a schedule is just noise.
- Suspend, don’t drop. If a DMF is noisy, suspend it while you tune:
ALTER TABLE t1
MODIFY DATA METRIC FUNCTION governance.dmfs.invalid_email_count
ON (email) SUSPEND;
6. Set expectations. Snowflake supports DMF expectations (thresholds) so you get pass/fail status, not just raw numbers.
How DMFs Are Billed?
DMFs use serverless compute — you don’t need a running warehouse. Snowflake manages the compute automatically, and you’re billed only when a scheduled DMF runs. Credits appear on your monthly bill under the DATA_QUALITY_MONITORING service type.
What Drives Cost
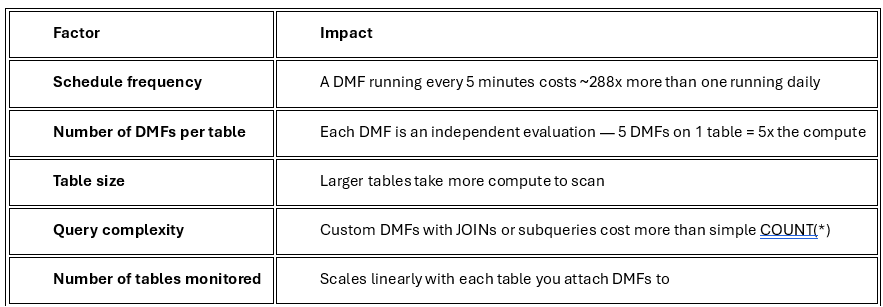
Why DMFs Are Worth the Cost
The short answer: DMFs are cheap. Bad data is expensive.
A Real Example
Say you have a table orders with 10 million rows, refreshed daily. You attach 3 system DMFs:
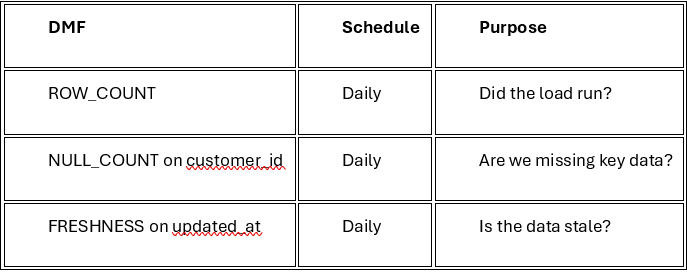
Estimated cost: ~0.01 to 0.05 credits per run, per DMF.
That’s roughly 0.03–0.15 credits/day for all three — which translates to
approximately 0.06–0.30/day (at ~$2/credit).
Per month: roughly 2–9 to monitor your most critical table.
Now compare that to the cost of NOT monitoring:
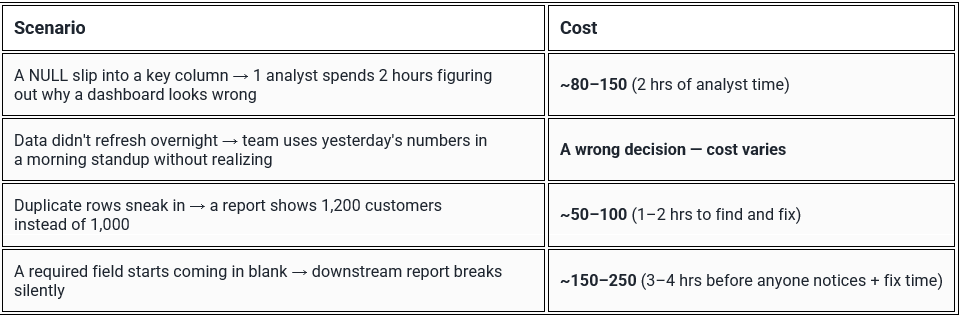
The DMF Cost to Catch All of This

3–15/month to avoid 50–250 per incident — and most teams hit at least one
incident a week.
Limitations & Notes
· DMFs support SQL only (no Python, Java, etc.)
· Expression must be deterministic
· Cannot reference UDFs or UDTFs
· Schedule changes take ~10 minutes to take effect on existing DMFs
· TRIGGER_ON_CHANGES only works on certain table types (not views)
· Cannot drop a custom DMF while it’s still attached to any table
· SYSTEM$DATA_METRIC_SCAN only works with system DMFs, not custom ones
· Results may have slight latency — always use MEASUREMENT_TIME as the basis for evaluation
The Bigger Picture
Data quality isn’t a luxury — it’s the foundation everything else depends on.
DMFs solve a problem every data team has but few address proactively: knowing whether your data is actually correct before someone downstream discovers it isn’t. They run on a schedule, store results automatically, and cost less per month than a single hour of an engineer debugging a broken dashboard.
The math never favors ignoring quality. A few credits a day to monitor your tables, or thousands in wasted hours, broken trust, and wrong decisions when something slips through unnoticed. Every team that’s been burned by bad data wishes they’d caught it sooner. DMFs are how you become the team that catches it first.
Start where it matters most — your top 3 tables, 3 system DMFs, one ALTER TABLE each. You’ll have production-grade monitoring running in minutes. Then grow from there: custom DMFs for your business rules, expectations for pass/fail thresholds, and eventually circuit breakers that stop bad data from ever reaching your consumers.
메타데이터
- post_id
- f9dfd8684c85
- slug
- a-practical-guide-to-data-metric-functions-dmfs-in-snowflake-f9dfd8684c85
- url
- https://medium.com/@sandiptabhadra2015/a-practical-guide-to-data-metric-functions-dmfs-in-snowflake-f9dfd8684c85
- canonical_url
- https://medium.com/@sandiptabhadra2015/a-practical-guide-to-data-metric-functions-dmfs-in-snowflake-f9dfd8684c85
- author_url
- https://medium.com/@sandiptabhadra2015
- status
- ok
- fetched_at
- 2026-06-12 07:40:50



