Machine Learning Algorithms(6)- Metrics for Binary Classification
Classification metrics let you assess the performance of machine learning models but there are so many of them, each one has its own…
Machine Learning Algorithms(6)- Metrics for Binary Classification

Classification metrics let you assess the performance of machine learning models but there are so many of them, each one has its own benefits and drawbacks, and selecting an evaluation metric that works for your problem can sometimes be really tricky.
In this article, you will learn about a bunch of common and lesser-known evaluation metrics and charts to understand how to choose the model performance metric for your problem.
Simply put a classification metric is a number that measures the performance that your machine-learning model when it comes to assigning observations to certain classes.
Binary classification is a particular situation where you just have two classes positive and negative.
Typically the performance is presented on a range from 0 to 1 (though not always) where a score of 1 is reserved for the perfect model.
The performance matrix is specific to binary classification problems. Let’s assume you have a dataset like this.
x1    x2    y     ŷ
-     -     0     1
-     -     1     1
-     -     0     0
-     -     0     1
-     -     0     1
-     -     0     1
-     -     1     0
-     -     1     0
Here y is the actual output and ŷ is the predicted output. Can we come up with a conclusion as to what is the accuracy of this specific model? We can use a performance Matrix to calculate the accuracy called a confusion matrix.
Well, it is a performance measurement for machine learning classification problems where the output can be two or more classes. It is a table with 4 different combinations of predicted and actual values.
First, we can create a confusion matrix for this. First of all, we can calculate the possible outputs for the given dataset. This is the result.

Now let’s create the confusion matrix and calculate the accuracy.
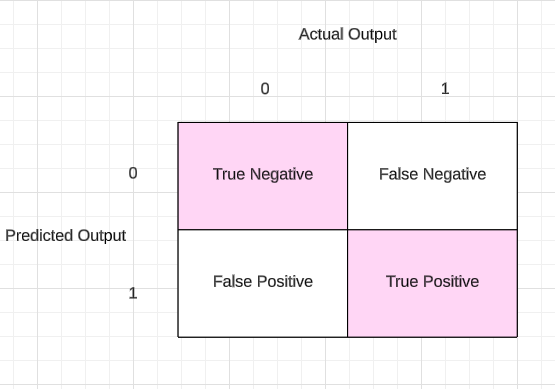
This is what we call a Confusion Matrix. Using this Confusion Matrix we need to find out the accuracy of this Model. These 2 boxes(Pink color) give us the right output.
Now we can get the accuracy using this equation to the above example.
Accuracy =  TP + TN / TP + FN + FP + TN

Let's apply to the dataset,

TP = 1   FP = 3  FN = 2  TN = 1

Accuracy =  2 / 7
         =  0.28571
As a presentage this is like  28% accuracy.
Always your model should try to reduce False Negative and False Positive values.
As an example, a machine learning model is trained to predict tumors in patients. The test dataset consists of 100 people.

True Positive (TP) — the model correctly predicts the positive class (prediction and actual both are positive). In the above example, 10 people who have tumors are predicted positively by the model. True Negative (TN) — the model correctly predicts the negative class (prediction and actual both are negative). In the above example, 60 people who don’t have tumors are predicted negatively by the model. False Positive (FP) — model gives the wrong prediction of the negative class (predicted-positive, actual-negative). In the above example, 22 people are predicted as positive for having a tumor, although they don’t have a tumor. FP is also called a TYPE I error. False Negative (FN) — model wrongly predicts the positive class (predicted-negative, actual-positive). In the above example, 8 people who have tumors are predicted as negative. FN is also called a TYPE II error.
With the help of these four values, we can calculate the True Positive Rate (TPR), False Negative Rate (FPR), True Negative Rate (TNR), and False Negative Rate (FNR).

If we have an imbalanced dataset it will affect the algorithm(As an example if you have 1s and 0s and you have 0s more than 1s like 1000 0s and 200 1s’. And you will get accuracy for 0s -> 1000/1000+200 -> 1000 / 1200 -> 83.33%. This is a good accuracy. But your data are imbalanced(biased)). So we should not depend on the accuracy only when we calculate the performance of the imbalanced dataset. There are some other terminologies that can be used.
- Precision
- Recall
- F-Score
Precision
Precision means out of all the predicted positive values how many of them have been truly predicted as true positives. In this particular scenario, our aim is to reduce False Positive(FP).

We can denote this by an equation.
TP / (TP + FP)As an example in the Spam Classification if any spam mail remains undetected (false negative) it is okay, but what if we miss any critical mail because it is classified as spam (False positive)? In this situation, a False Positive should be as low as possible. Here, precision is more vital as compared to recall.
Recall
Recall means out of all actual true positive values how many of them have been predicted as true positives? In this particular scenario, our aim is to reduce False Negative(FN). We can name recall as True Positivity and Sensitivity.
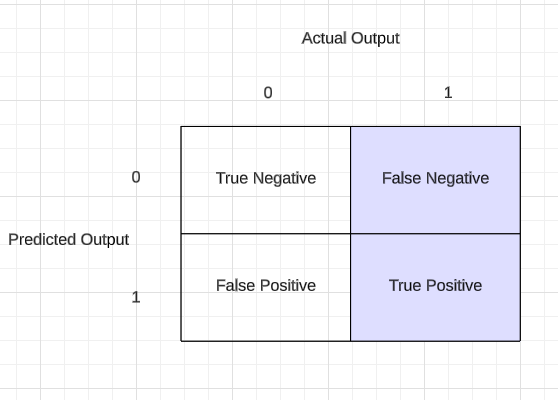
We can denote this as an equation,
TP / (TP + FN)As an example, we do not want to miss any cancer patients. Therefore, we want the false negative to be as low as possible(If a person does not have cancer and the model predicts that he has cancer(False Positive). This is okay, that person can do a test and check whether he has cancer or not. But if a person has cancer but the model predicts as not a cancer patient(False Negative) is not good. we need to reduce that). In these situations, we can compromise with the low precision, but recall should be high.
F-Score
If you need to consider Precision and Recall both at the same time, you can use F-Score. It is the harmonic mean of precision and recall. Here in F-Score, you have 3 different formulas.
F1 Score— Here the focus is on both False positives and False negatives and both important.
F-Score = (1+β²) (Precision * Recall)  / β²(Precision + Recall)

// Whenever your False Positive and False Negative are important,
we select this β = 1

F-Score = (1+1²) (Precision * Recall)  / (Precision + Recall)
        =  2 (Precision * Recall)  / (Precision + Recall)
F0.5 Score — Here False positive is more important than Flase negative.
F-Score = (1+β²) (Precision * Recall)  / β²(Precision + Recall)

// Here you will try to decrease your β value.
// This means you are providing more important to false positive than false negative
we select this β = 0.5

F-Score = (1+0.5²) (Precision * Recall)  / 0.5²(Precision + Recall)
        =  1.25(Precision * Recall)  / 0.25(Precision + Recall)
F2 Score— Here False negative is more important than Flase positive.
F-Score = (1+β²) (Precision * Recall)  / β²(Precision + Recall)

// Here you will try to increase your β value.
// This means you are providing more important to false negative than false positive
we select this β = 2

F-Score = (1+2²) (Precision * Recall)  / 2²(Precision + Recall)
        =  5(Precision * Recall)  / 4(Precision + Recall)
β is the deciding parameter to pick the correct formula for F-Score. Confusion matrix, precision, recall, and F-score provide better insights into the prediction as compared to accuracy performance metrics.
This is all about Binary Classification Metrics and see you in another Machine Learning article.
Next Article:
Thank You!
메타데이터
- post_id
- faf0db9b5ad8
- slug
- machine-learning-algorithms-6-metrics-for-binary-classification-faf0db9b5ad8
- url
- https://towardsdev.com/machine-learning-algorithms-6-metrics-for-binary-classification-faf0db9b5ad8
- canonical_url
- https://towardsdev.com/machine-learning-algorithms-6-metrics-for-binary-classification-faf0db9b5ad8
- author_url
- https://medium.com/@kasunprageethdissanayake
- status
- ok
- fetched_at
- 2026-07-31 07:58:30