How I Vibe Coded a Python Charting Library
Combining hand coding and vibe coding resulted in a professional-looking new library
How I Vibe Coded a Python Charting Library
Combining hand coding and vibe coding resulted in a professional-looking new library

I didn't start with vibe coding. I had handwritten some code to implement a few charts that I thought were useful before vibe coding was even a thing.
But when I wanted to add a couple more charts and turn them into a Python library of consistent and effective chart functions, it was brilliant!
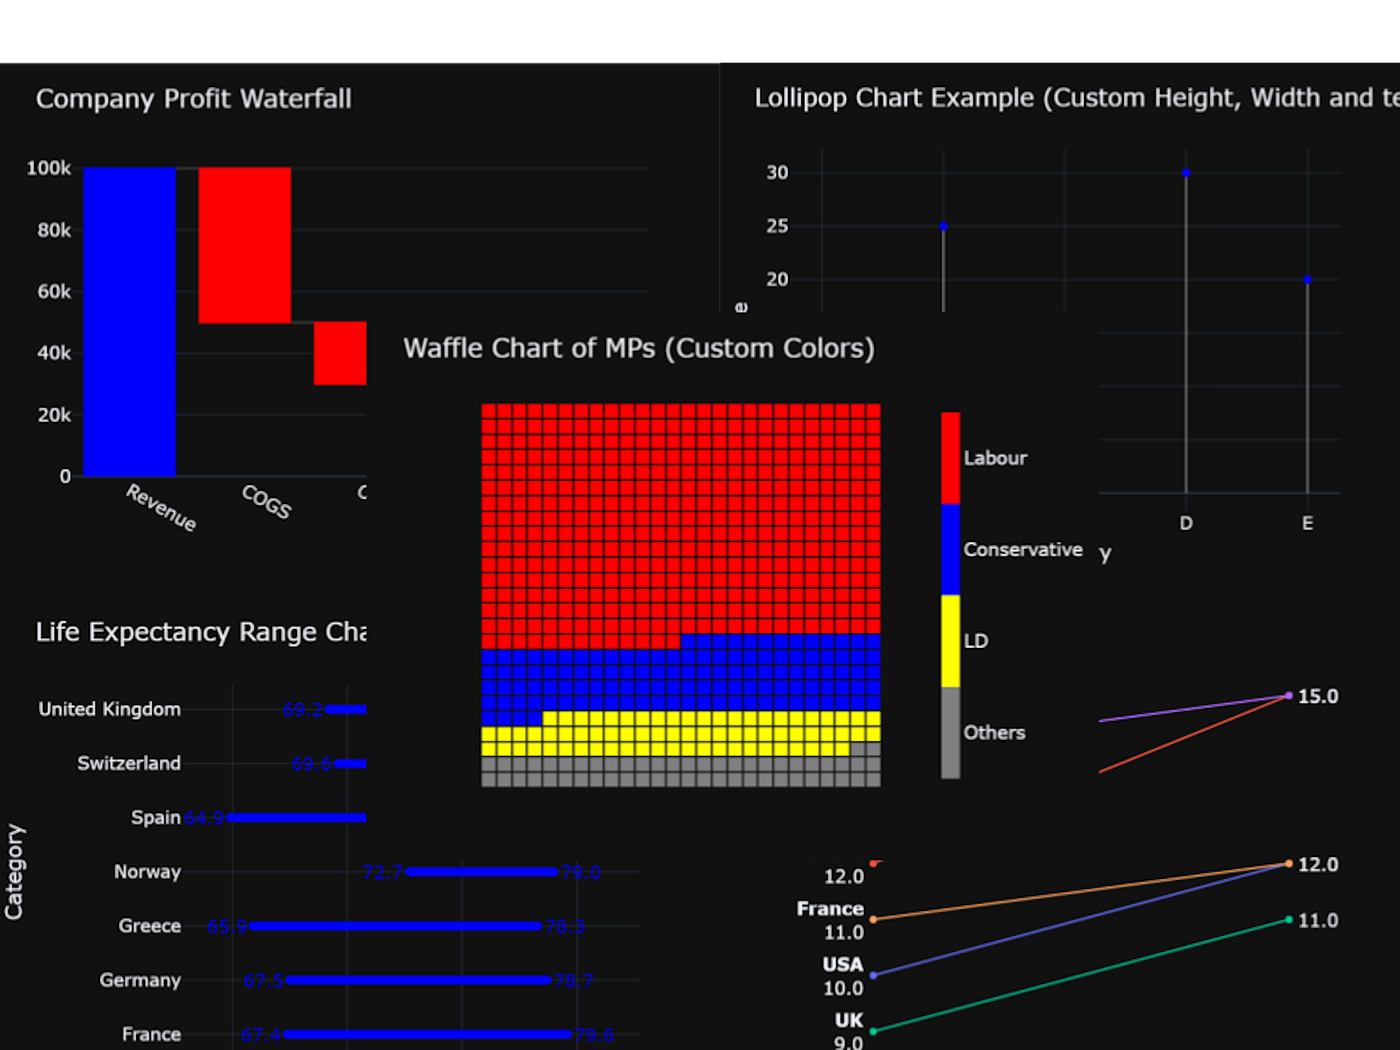
It was ages ago that I wrote a function to draw a waterfall chart in Plotly. It's not that it was completely missing from Plotly, but it was not in Plotly Express, and so you had to construct a figure from Plotly Graph Objects. I wanted a function similar to Plotly Express that allowed you to customise the figure by passing parameters to the function, but also provided sensible default values so you didn't have to set those parameters if you didn't want to.
Not a big deal, but useful. And later, I did something similar for a dumbbell chart, then a waffle chart...
This could be a library
This was beginning to look a bit like a small library, but I'd written the functions at different times without referring to the previous work; they were not very consistent in terms of naming conventions or the number and type of parameters. To my shame, they were not well-documented, either.
To fix these problems, I decided to turn to Gemini for help. I used both the Gemini plugin for VSCode and Gemini CLI, both of which work well. I'm in two minds as to which I prefer; the plugin lets me use my favourite editor with all the built-in editor functions and Git integration, but I like the CLI, too. There's more screen real estate devoted to Gemini in the CLI, and you don't necessarily need an editor when you are using it.
Of course, you don’t have to use Gemini, and you probably have your favourite vibe coding environment, but it suits me.
Documentation
My first step was to ask Gemini to add standard comments and type hints for each function and to add comments to the code where useful.
This, of course, was a breeze for Gemini. The code is not complicated, and Gemini correctly interpreted it and produced professional-looking documentation.
But documentation is not everything. I wanted my code to be consistent and well-structured, so I asked Gemini to comment on the quality of the code.
Quality
Gemini came up with a few suggestions about how the code was structured, where there was potential for refactoring code and how to make the function signatures more consistent.
I had used different naming conventions in the functions, and it made sense to change the names of similar parameters and variables to be the same. This again was an easy change for Gemini.
One thing I was keen on was to give the user the option of providing data to the charting functions as either Pandas dataframes or individual lists (in a similar way to Plotly Express). The parameters all defaulted to None, and the user would then set the appropriate parameters for the data as dataframes or lists.
Gemini was able to change the functions to incorporate this functionality, but found that it was producing duplicate code. The solution was to refactor the code into a single function, and Gemini came up with a nifty solution where both dataframes and lists were passed into it and a consistent form of the data was returned, no matter which form was used. This was called in each of the chart functions.
More charts
When I wanted to add more charts, I sketched out the code that I wanted by hand and then asked Gemini to update the library and make the new function compatible with all the others. It produced the documentation and type hints and suggested compatibility changes or other improvements.
Why not start from scratch
It occurred to me that I could simply have described the charts that I wanted to Gemini and ask it to produce the library from scratch. So I did.
The result was ok, but it was simply not what I wanted. In order to get Gemini to produce the precise type of functions that I required, I would have needed to describe them in much greater detail and isn't that what coding is?
If I were not already a programmer, then this would have been my only option, but since I am, and I had a good idea of what I wanted. It was easier to prototype the functions and then get the AI to tidy it up and do the grunt work.
Conclusion
I have found vibe coding this library a very useful experience that has taught me a lot about using AI for coding.
I have not gone into great detail about exactly what coding I did and what commands I gave to Gemini. This is deliberate because I didn't intend this to be a tutorial. If you take this approach, then you will find your own way of operating.
Having said that, writing a detailed description of a function or other piece of code, and getting it right, is not so very different to prototyping the code. Writing the code and then getting the AI to refine it, document it and make it fit in with the rest of the library was a good experience. I recommend this approach, and I'll certainly do it again.
If you would like to know more about the library, it is called px_xtras, and I've written about it in a separate article, px_xtras: Beyond Plotly Express, More Beautiful Charts. The article tells you about the charts, how to install the library and where to find the code.
I hope you have found this short article useful, and thanks for reading. To see more of my work, please follow me on Medium and/or subscribe to my newsletter where I link to new articles.
메타데이터
- post_id
- fb2db36779bb
- slug
- how-i-vibe-coded-a-python-charting-library-fb2db36779bb
- url
- https://medium.com/codefile/how-i-vibe-coded-a-python-charting-library-fb2db36779bb
- canonical_url
- https://medium.com/codefile/how-i-vibe-coded-a-python-charting-library-fb2db36779bb
- author_url
- https://medium.com/@alan-jones
- status
- ok
- fetched_at
- 2026-06-10 08:17:25