Building a Decision Tree from Scratch with ID3 Algorithm
Welcome to this comprehensive tutorial on creating a Decision Tree using the ID3 algorithm! Decision trees are a fundamental machine…
Building a Decision Tree from Scratch with ID3 Algorithm
Welcome to this comprehensive tutorial on creating a Decision Tree using the ID3 algorithm! Decision trees are a fundamental machine learning technique used for classification and regression tasks. They work by recursively splitting data based on attributes to make decisions, much like a flowchart.
In this tutorial, we’ll cover:
- What decision trees are and why they’re useful.
- Key concepts: Entropy and Information Gain.
- A step-by-step guide to building a decision tree.
- A full example dataset (the classic “Play Tennis” dataset).
- Calculations with explanations.
- How to interpret and use the tree for predictions.
- Tips, limitations, and next steps.
This is designed for beginners, but we’ll dive deep into the math. Let’s start !
Why Decision Trees?
Decision trees are popular because:
- They’re easy to interpret and visualize.
- They handle both categorical and numerical data.
- No data normalization is required.
- They can capture non-linear relationships.
Common applications include:
- Classifying emails as spam or not.
- Predicting customer churn.
- Medical diagnosis (e.g., disease based on symptoms).
We’ll focus on classification using the ID3 (Iterative Dichotomiser 3) algorithm, which selects splits based on Information Gain
Key Concepts
Entropy
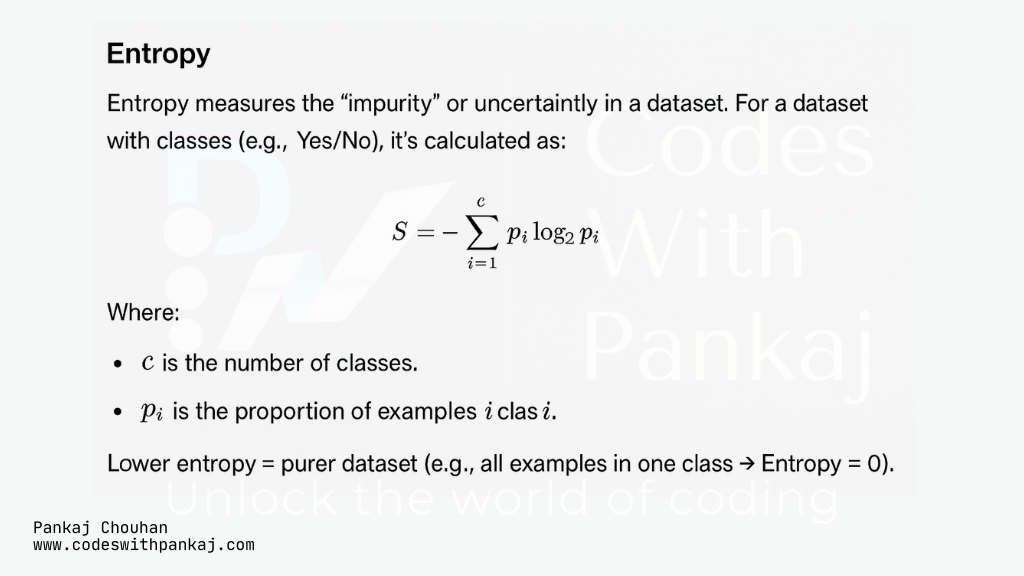
Entropy
Information Gain (IG)

Information Gain (IG)
The attribute with the highest IG becomes the node.
ID3 repeats this process recursively until.
- All subsets are pure (entropy = 0).
- No attributes left.
- A stopping criterion is met (e.g., max depth).
Example Dataset: Play Tennis
We’ll use the classic “Play Tennis” dataset to decide whether to play tennis based on weather conditions. It has 14 instances (rows) and 4 attributes (features), plus the target class (Play Tennis: Yes or No).
Here’s the full dataset in table format

Example Dataset: Play Tennis
Notes on Dataset:
- Outlook: Sunny, Overcast (Cloudy), Rain.
- Temperature: Hot, Mild, Cool (Cold).
- Humidity: High, Normal.
- Wind: Weak, Strong.
- Target: Play Tennis (9 Yes, 5 No).
This dataset is small but perfect for manual calculations.
Step-by-Step: Building the Decision Tree
Step 1: Calculate Entropy of the Entire Dataset

Calculate Entropy of the Entire Dataset
Step 2: Calculate Information Gain for Each Attribute
We’ll compute IG for Outlook, Temperature, Humidity, and Wind.
IG for Outlook

IG for Temperature
Values: Hot (4: 2 Yes, 2 No), Mild (6: 4 Yes, 2 No), Cool (4: 3 Yes, 1 No)

IG for Humidity
Values: High (7: 3 Yes, 4 No), Normal (7: 6 Yes, 1 No)

IG for Wind
Values: Weak (8: 6 Yes, 2 No), Strong (6: 3 Yes, 3 No)

Highest IG: Outlook (0.247) → Root node is Outlook.
Step 3: Split and Recurse
- Overcast Branch: All 4 Yes → Leaf node: Yes.
- Sunny Branch (5 instances: 2 Yes, 3 No): Entropy: 0.971 Recalculate IG for remaining attributes (Temp, Humidity, Wind). Highest IG: Humidity (1.000) → Node: Humidity.
- High (3: 0 Yes, 3 No) → Leaf: No.
- Normal (2: 2 Yes, 0 No) → Leaf: Yes.
- Rain Branch (5 instances: 3 Yes, 2 No): Entropy: 0.971 Highest IG: Wind (0.971) → Node: Wind.
- Weak (3: 3 Yes, 0 No) → Leaf: Yes.
- Strong (2: 0 Yes, 2 No) → Leaf: No.
Step 4: The Final Decision Tree

Making Predictions
For a new instance: Sunny, Mild, High, Strong
- Outlook = Sunny → Go to Humidity.
- Humidity = High → No (Don’t play).
Another: Rain, Cool, Normal, Weak
- Outlook = Rain → Go to Wind.
- Wind = Weak → Yes (Play).
Implementing in Code (Optional Python Example)
Here’s a simple Python snippet using scikit-learn for automation (after understanding manual steps)
from sklearn import tree
import pandas as pd
from sklearn.preprocessing import LabelEncoder

# Load dataset
data = pd.DataFrame({
    'Outlook': ['Sunny', 'Sunny', 'Overcast', 'Rain', 'Rain', 'Rain', 'Overcast', 'Sunny', 'Sunny', 'Rain', 'Sunny', 'Overcast', 'Overcast', 'Rain'],
    'Temperature': ['Hot', 'Hot', 'Hot', 'Mild', 'Cool', 'Cool', 'Cool', 'Mild', 'Cool', 'Mild', 'Mild', 'Mild', 'Hot', 'Mild'],
    'Humidity': ['High', 'High', 'High', 'High', 'Normal', 'Normal', 'Normal', 'High', 'Normal', 'Normal', 'Normal', 'High', 'Normal', 'High'],
    'Wind': ['Weak', 'Strong', 'Weak', 'Weak', 'Weak', 'Strong', 'Strong', 'Weak', 'Weak', 'Weak', 'Strong', 'Strong', 'Weak', 'Strong'],
    'Play': ['No', 'No', 'Yes', 'Yes', 'Yes', 'No', 'Yes', 'No', 'Yes', 'Yes', 'Yes', 'Yes', 'Yes', 'No']
})

# Encode categorical data
le = LabelEncoder()
for col in data.columns:
    data[col] = le.fit_transform(data[col])

X = data.drop('Play', axis=1)
y = data['Play']

# Train decision tree
clf = tree.DecisionTreeClassifier(criterion='entropy')  # ID3 uses entropy
clf.fit(X, y)

# Visualize (requires graphviz)
tree.plot_tree(clf, feature_names=X.columns, class_names=['No', 'Yes'], filled=True)
Limitations and Tips
- Overfitting: Trees can overfit noisy data. Use pruning or ensembles like Random Forests.
- Bias: ID3 favors attributes with many values.
- Handling Continuous Data: ID3 is for categorical; use C4.5 or CART for numerical.
- Scalability: Manual calculation is for small datasets; use libraries for large ones.
- Practice Tip: Try modifying the dataset (e.g., add more rows) and recalculate.
메타데이터
- post_id
- fb84e887cf8f
- slug
- building-a-decision-tree-from-scratch-with-id3-algorithm-fb84e887cf8f
- url
- https://medium.com/@codeswithpankaj/building-a-decision-tree-from-scratch-with-id3-algorithm-fb84e887cf8f
- canonical_url
- https://medium.com/@codeswithpankaj/building-a-decision-tree-from-scratch-with-id3-algorithm-fb84e887cf8f
- author_url
- https://medium.com/@codeswithpankaj
- status
- ok
- fetched_at
- 2026-06-27 18:20:27






