Optimization of the Layout of Bryant Park’s Christmas Market
Optimization of the Layout of Bryant Park’s Christmas Market
Bryant Park’s Christmas Market is one of New York City’s most iconic seasonal public events, attracting large volumes of visitors each year. However, such high-density, temporary urban environments are typically organized through experience-based planning, lacking systematic methods to predict and control pedestrian behavior.
- Overcrowding in central zones while peripheral areas remain underutilized
- Undefined circulation reduces spatial efficiency
- Uneven exposure among vendors affects overall economic performance
The problem is therefore not the lack of space, but how space is organized through movement.
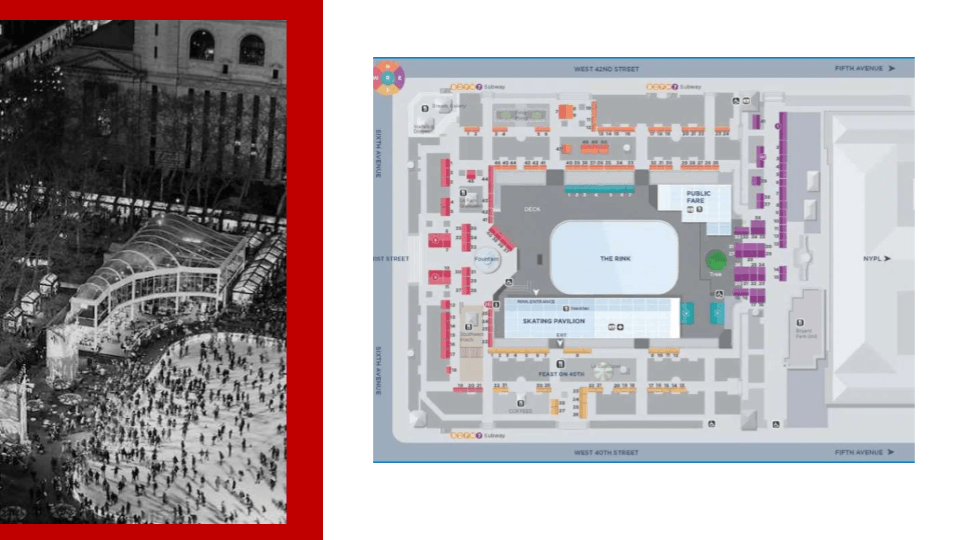
Bryant Park’s Christmas Market Plan
Who is the users?
Seasonal market event planners managing medium to large urban public space events, who need to test spatial configurations before finalizing layout decisions.
Consideration factors:
- Uneven distribution of passenger flow
- The flow line is not clear
- The tourist consumption rate is low
In response, this project proposes a flow-driven layout optimization system that transforms spatial design into a computational and feedback-based process.
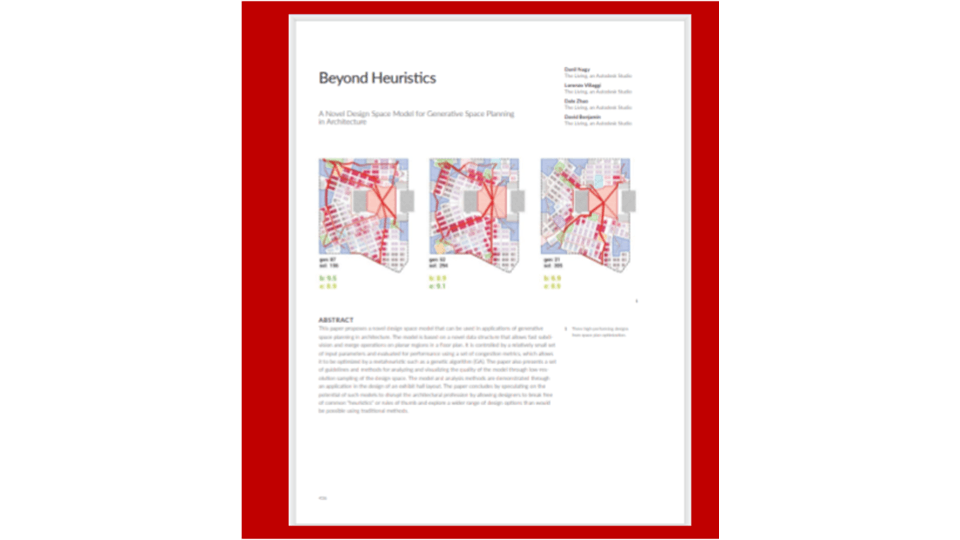
Source: Nagy et al., Beyond Heuristics, 2017
Circulation is generated through parametric rules rather than being manually drawn. Main paths subdivide the space, and program areas emerge by expanding and merging adjacent cells based on requirements.
Each generated configuration is evaluated using performance metrics such as flow distribution and accessibility. These metrics quantify how effectively movement is distributed and how well different areas are connected.
By comparing multiple generated solutions, the system identifies a set of high-performing configurations rather than a single optimal outcome.
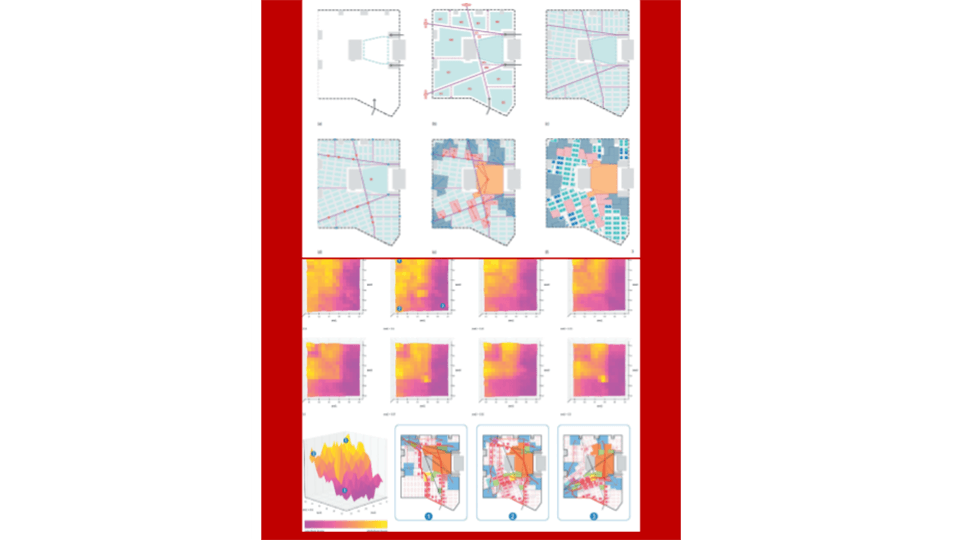
Source: Nagy et al., Beyond Heuristics, 2017
Rather than producing a single solution, our project aims to generate and compare multiple circulation scenarios, allowing the design to explore a broader range of spatial configurations.
This direction closely aligns with the design space model proposed in the paper, where design is understood as a system that generates and evaluates multiple possibilities. The use of discretization, parametric generation, and performance metrics reflects a similar shift from heuristic design to computational exploration.
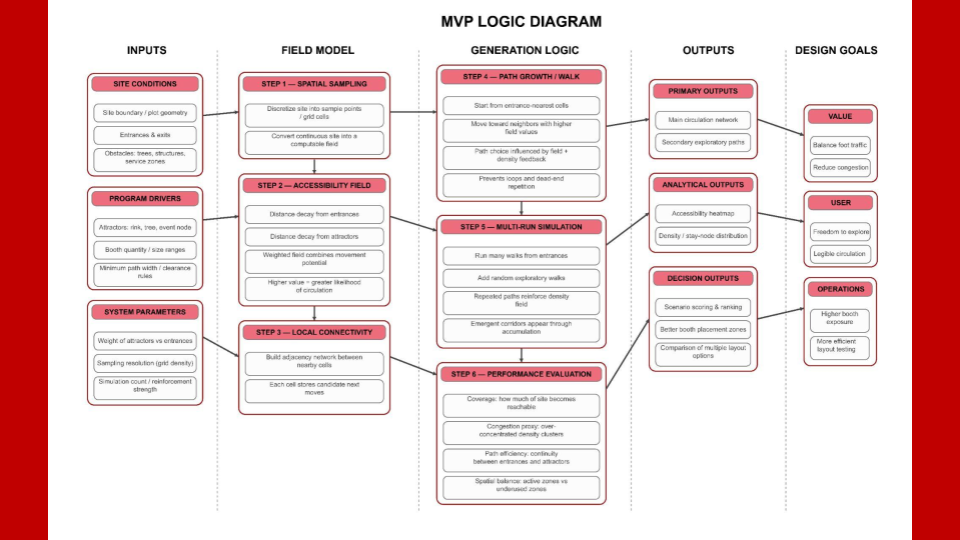
MVP Logic Diagram
The first step is the site preprocessing
module of the system. It cleans the boundary, ice rink, obstacles, main paths, and candidate zones, then combines the ice rink and obstacles into a blocked area.
By subtracting this blocked area from the site boundary, the code generates the walkable area. Finally, it outputs the cleaned candidate zones, which provide the base regions for controlling the Christmas tree and carousel positions with x and y parameters in the next step.

Draw Attractors
The second part of the code is the attractor positioning module. It controls the placement of the Christmas tree and the carousel based on the cleaned site areas from Step 1. The Christmas tree is controlled by tree_x / tree_y, while the carousel is controlled by carousel_zone_id + carousel _x / carousel_y. The code checks whether each target position is located within a valid zone, then generates rectangular buffers for both attractors to make sure they avoid the ice rink, obstacles, main paths, and each other. The final attractor buffers are passed to Step 3 as constraints for the heatmap, avoidance logic, and stall layout generation.

Attractor Module
Then, the third part is the stall placement module, which automatically generates market stalls along the main paths. It reads the input path curves and places rectangular stalls on both sides based on stall size, road width, and spacing rules. The direction of each stall follows the direction of the path.

This part can be described as the grid generation module. It converts the walkable site area into a regular analysis grid.
The code reads walkable_area_in and blocked _area_in from Step 1, then generates square grid cells based on cell_size_in. It checks whether each grid point is inside the walkable area and outside the blocked area. Only the valid points and cells are kept for later analysis.

Grid Generation
This part can be described as the heat field calculation module. It converts the valid grid points into a heatmap based on the influence of entrances, attractors, and stalls.
The code reads valid_pts_in from the grid module, then calculates the distance from each point to three types of spatial elements: entrances, attractors, and stall centers. Each element generates influence through a Gaussian falloff, meaning the closer a grid point is to an entrance, attractor, or stall, the higher its heat value will be. The influence strength is controlled by weights, while the influence range is controlled by radius values.

Heat Calculation Module
The last part, it converts the heatmap and stall layout into a single fitness score that can be read by Galapagos.
It mainly evaluates two aspects.
First, heat uniformity. The code calculates the mean and standard deviation of the heat values across all valid grid points. If the heat is more evenly distributed across the site, the heat_ _uniformity score becomes higher.
Second, stall exposure. The code checks the average heat value around each stall center within a defined radius. If the stalls are located in more active areas, the stall _exposure_norm score becomes higher.
Finally, the code combines heat uniformity
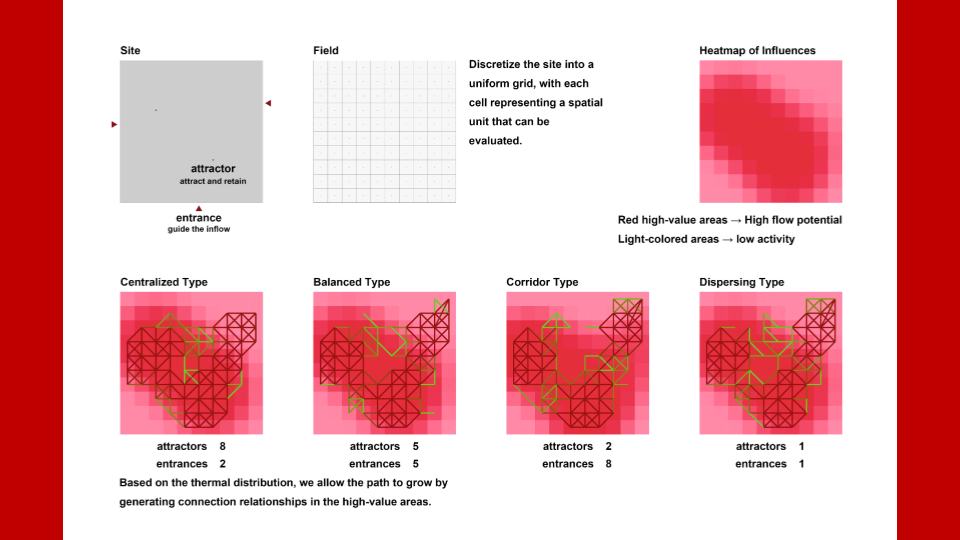
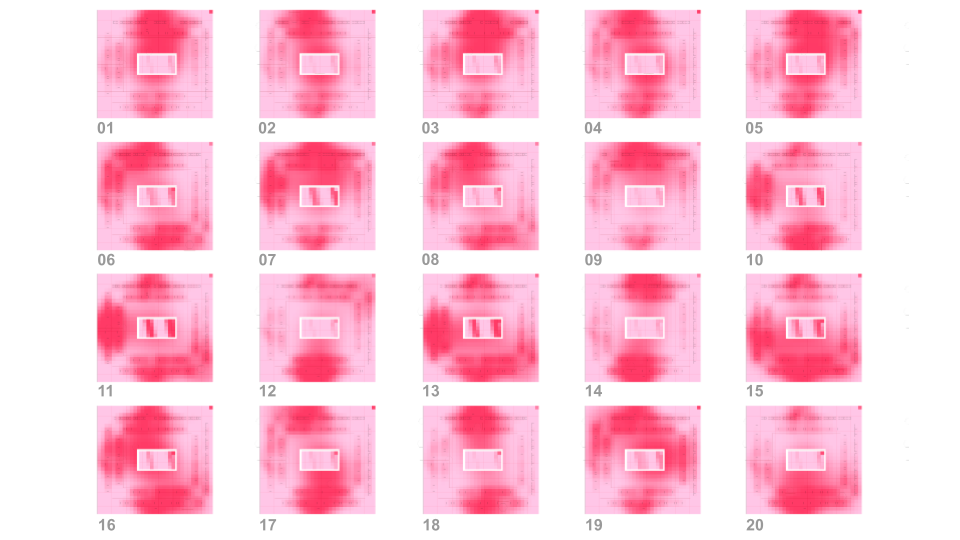
Generation of Heat Map
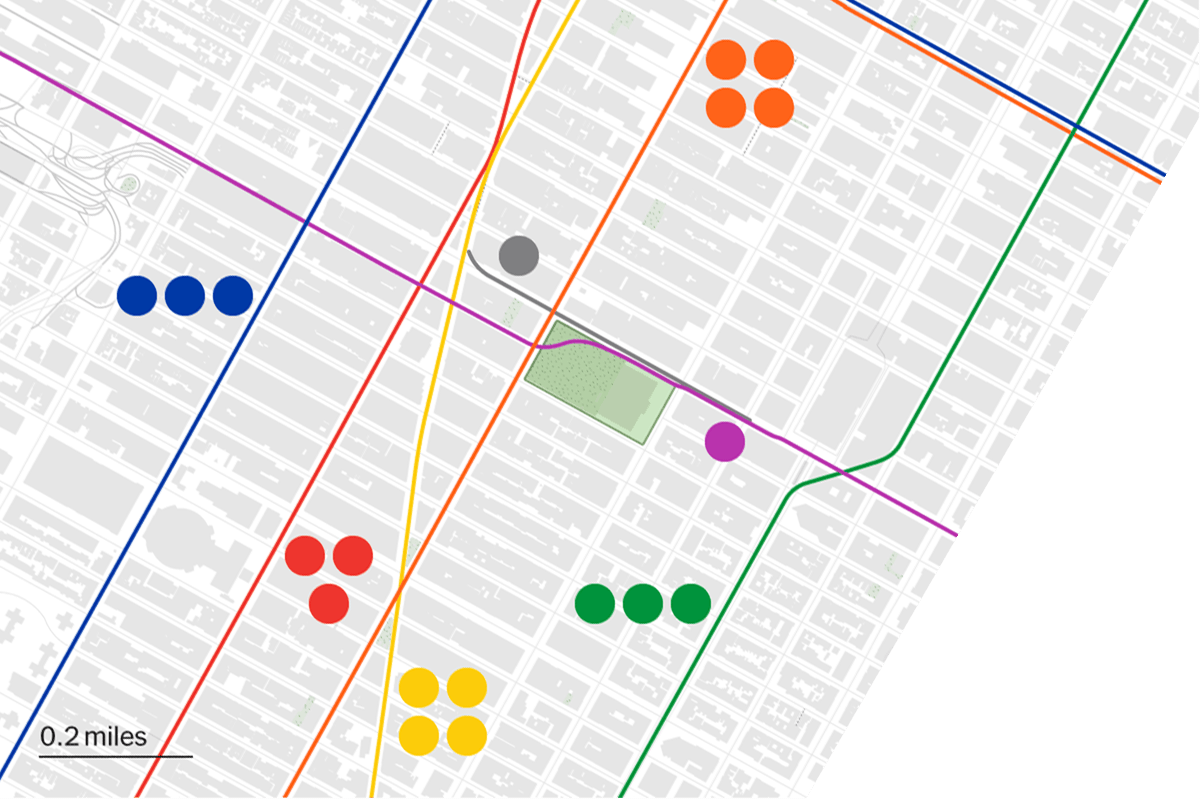
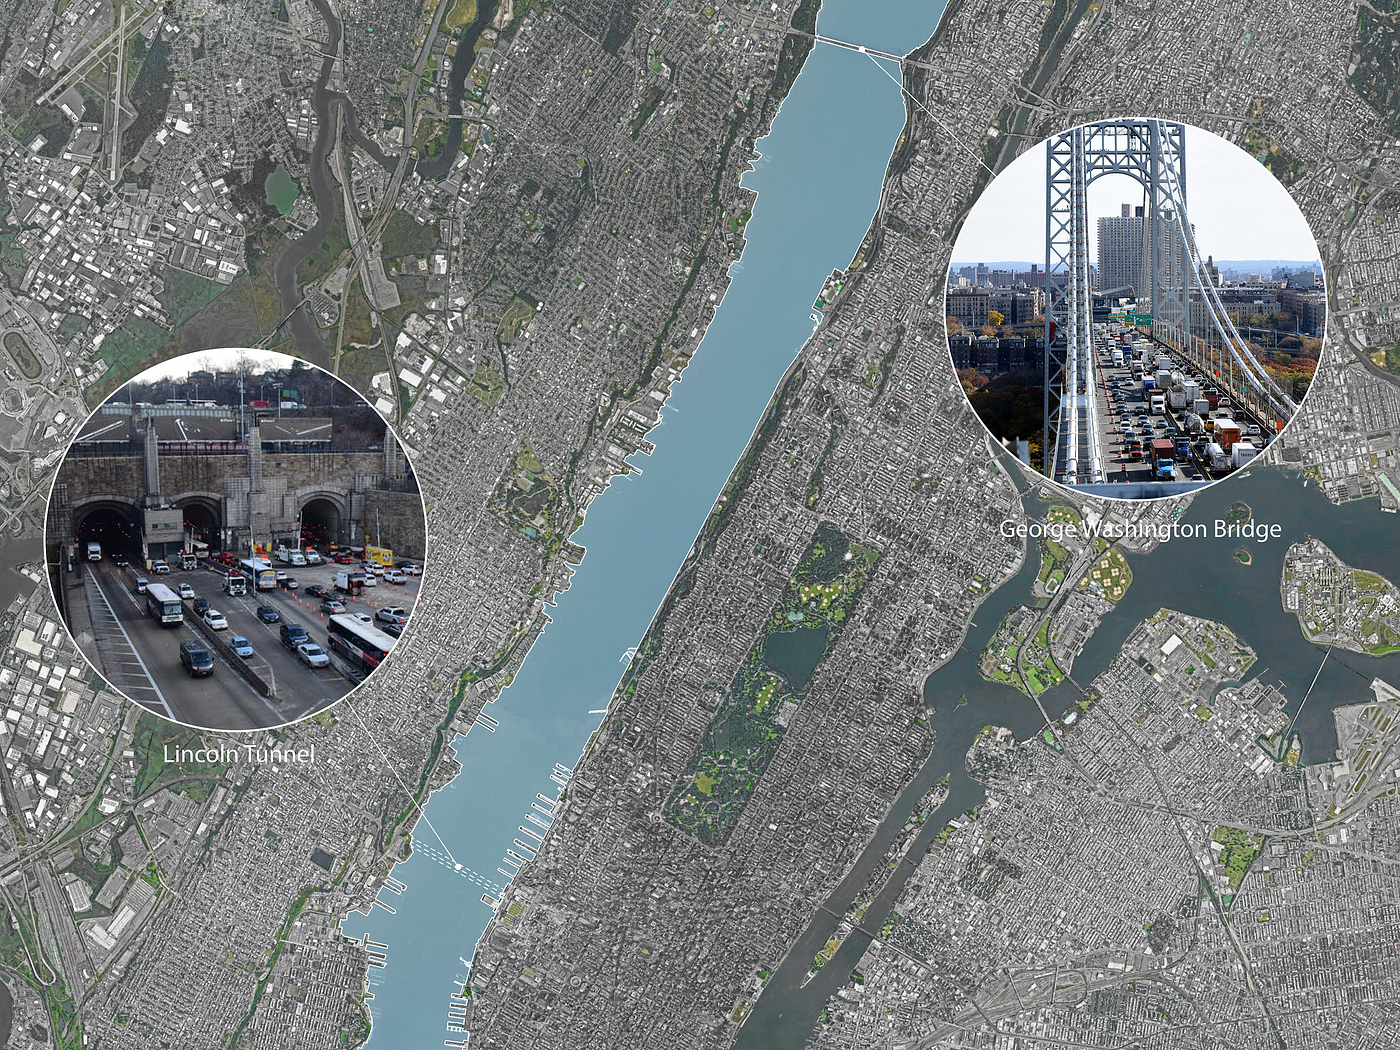
Transportation Around Bryant Park
We developed a spatial design system based on pedestrian flow.
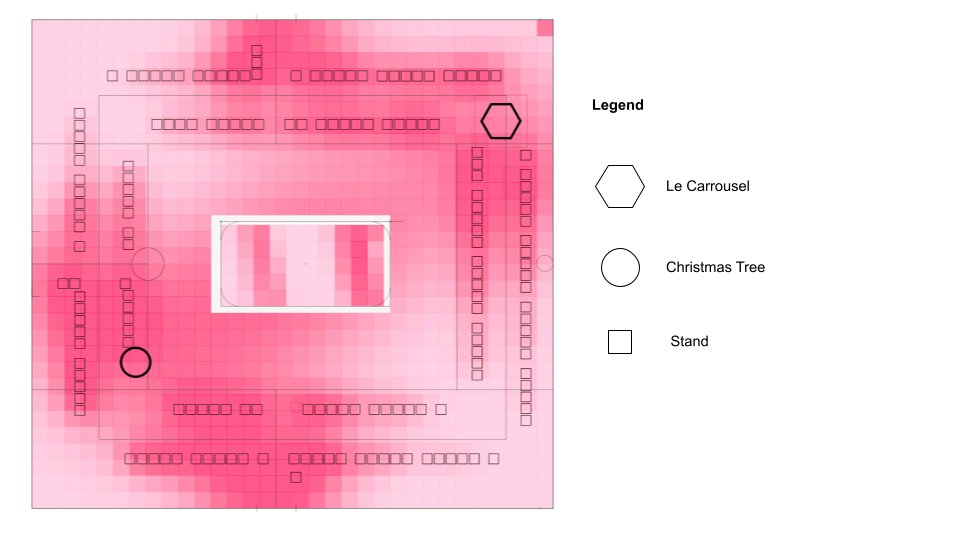
By inputting the site boundary, entrances, and attraction points, the system generates multiple circulation and layout options, then evaluates them using heat distribution and visibility.
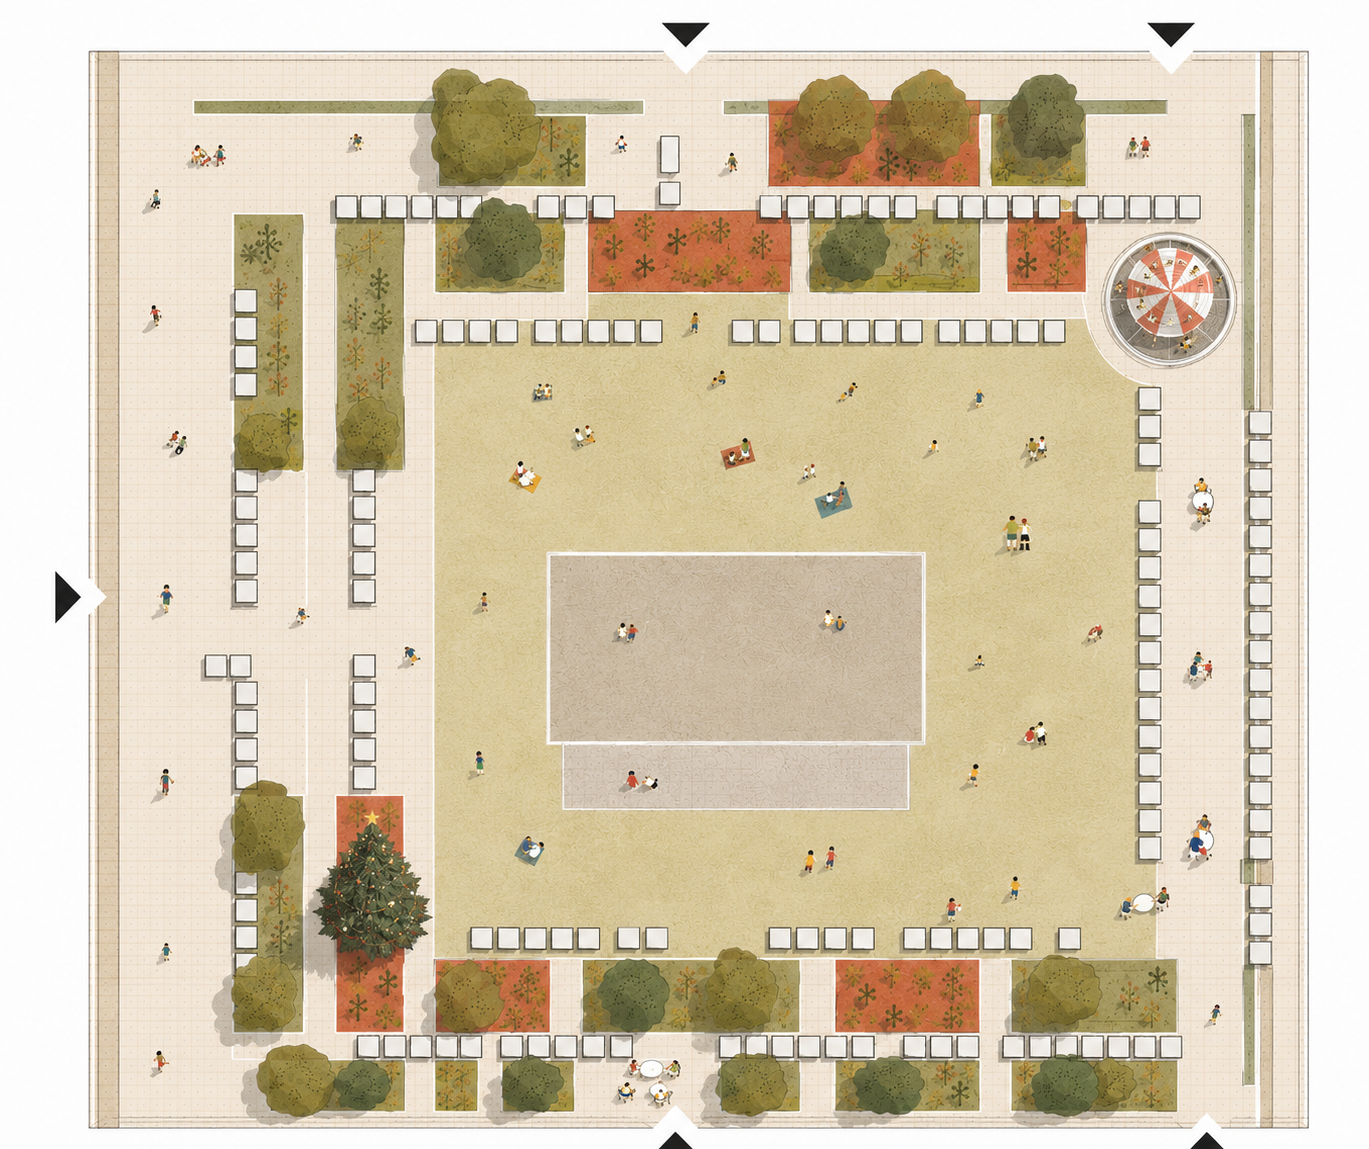
In this park proposal, paths, entrances, and fixed elements (like statues) generate the layout of stands, a carousel, and a Christmas tree.
Stands are arranged along the paths, while the carousel and Christmas tree are placed in the northeast and southwest based on performance metrics.
Squares represent stands, the hexagon represent the carousel, and circle represent the Christmas tree.
Final Plan
This is our final plan.
The left shows subway connections to the park, and the right shows the redesigned layout.
Instead of relying on intuition, the system generates and selects from multiple options to achieve a more balanced and efficient spatial organization.
메타데이터
- post_id
- fcbc1dcd5ed5
- slug
- optimization-of-the-layout-of-bryant-parks-christmas-market-fcbc1dcd5ed5
- url
- https://medium.com/generative-design-course/optimization-of-the-layout-of-bryant-parks-christmas-market-fcbc1dcd5ed5
- canonical_url
- https://medium.com/generative-design-course/optimization-of-the-layout-of-bryant-parks-christmas-market-fcbc1dcd5ed5
- author_url
- https://medium.com/@jw4805
- status
- ok
- fetched_at
- 2026-06-15 20:49:13