Scaling Qlik Sense: What I Learned From Slow Dashboards
As a Qlik developer, I’ve noticed a recurring pattern. Not just in my own organization, but across the entire Qlik community.
Scaling Qlik Sense: What I Learned From Slow Dashboards
As a Qlik developer, I’ve noticed a recurring pattern. Not just in my own organization, but across the entire Qlik community.
In webinars. In forums. In discussions with other Qlik developers. The same complaint keeps coming up:
“Our dashboards are slow. They used to load in minutes, now they take 45–60 minutes. Users are frustrated with stale data. We can barely refresh twice a day.”
The root cause? A single Qlik application trying to do everything.
Most companies know about this pattern in data warehousing. Tools like Snowflake have separate layers bronze, silver, and gold for ingestion, transformation, and consumption. Data architects build pipelines this way by default.
But here’s what I realized:
Qlik Sense applications handle their own transformations. Most Qlik developers don’t break their load scripts into dedicated applications the way a data warehouse would.
I did. And it changed everything.
This article shares what I found: how implementing dedicated applications with partial reloads transformed a slow, monolithic dashboard into a fast, real-time analytics engine.
If you’re building Qlik applications and seeing similar slowdowns, this solution worked. It might work for you too.
The Problem
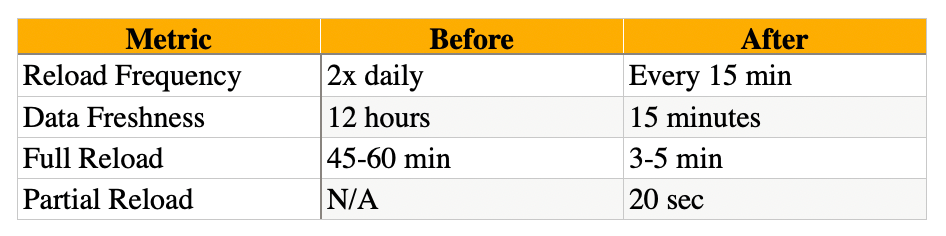
Qlik dashboard has 2+ years of data. Every reload, it processes everything from the start. Takes 45–60 minutes. You get 2 refreshes a day.
In a fast business, that’s too slow.
Why It Breaks
A single application does everything:
- Loop through all files
- Validate timestamps
- Load and transform all data
- Build the data model
- Display in dashboard
The bottleneck? Transformations on massive datasets.
Every reload, you retransform data that already exists. That’s the waste.
The Solution: Three Applications
Bronze: Grab today’s files using wildcards. Store raw data. Done in 2 minutes.
Silver: Load today’s raw data. Apply joins. Build dimensions. Store star schema QVDs and monthly transactional files. Done in 2 minutes.
Gold: Load pre-built QVDs.
- Full reload once daily at 6 AM (3–5 min)
- Partial reloads every 15 min (20 seconds) using REPLACE, ADD, MERGE loads
Each layer processes 1 day. Each layer stays fast.
The Impact
Single app: Processes 365+ days of data every reload.
Three apps: Each processes 1 day only.
Transformations don’t degrade as historical data grows. Bronze stays fast. Silver stays fast. Gold’s partial reloads stay fast.
When to Use This
- Dashboard with 2+ years of data
- Reload times 45+ minutes
- Need multiple refreshes per day
- Want faster development cycles
From 2 daily refreshes to 40+ per day. That’s the difference between batch reporting and real-time insights.
Hope this added value to your data journey!
If these insights resonated with you, consider sharing this post with a colleague or friend who is navigating the world of Qlik Sense.
We all know that while many people are eager to master practical data visualization and associative modeling, they often miss out on the hands-on tips that actually move the needle. By sharing, you’re helping bridge that gap for someone looking to level up their analytics game.
DataAnalyst #QlikSense #DataVisualization
메타데이터
- post_id
- fccb3716d49f
- slug
- scaling-qlik-sense-what-i-learned-from-slow-dashboards-fccb3716d49f
- url
- https://medium.com/@srujankalava/scaling-qlik-sense-what-i-learned-from-slow-dashboards-fccb3716d49f
- canonical_url
- https://medium.com/@srujankalava/scaling-qlik-sense-what-i-learned-from-slow-dashboards-fccb3716d49f
- author_url
- https://medium.com/@srujankalava
- status
- ok
- fetched_at
- 2026-06-21 07:44:09




