PowerWorld Simulator: Load Flow and Economic Dispatch — A Beginner’s Tutorial
By Binita Poudel
PowerWorld Simulator: Load Flow and Economic Dispatch — A Beginner’s Tutorial
By Binita Poudel
Let’s be honest: opening PowerWorld Simulator for the first time is a lot. I remember staring at that screen, a sea of menus, dialog boxes, and technical jargon, feeling a mix of excitement and total overwhelm. If you’ve ever looked at per-unit values and cost curves and just wondered, “Where do I even begin?” — you’re not alone.
But here’s the thing: getting comfortable with this tool is one of the most powerful skills we can have as electrical engineers. It’s our digital sandbox for the power grid. It’s how we test-drive new designs, hunt down voltage problems, and find the cheapest way to keep the lights on.
And the best part? It’s a playground. You can ask “what-if?” all day long. Add a transmission line, crank up a generator, or drop in a massive solar farm and watch the grid react in real-time. This isn’t just an academic exercise; it’s exactly what grid operators do to prevent blackouts and planners do to build a cleaner, more reliable future.
Once you get the hang of it, PowerWorld starts to feel less like a complex tool and more like a superpower.
My goal is to get you there without the headache. In this tutorial, we’ll walk through everything together, from drawing your first one-line diagram to running a full economic dispatch. Every step, every screenshot, with no confusing leaps.
By the end, you’ll feel right at home in PowerWorld, ready to take on your own power system challenges. Let’s dive in
!## Resources & Credits
This tutorial was inspired by PowerWorld Simulator Lecture Series by Al-Roomi Academy (YouTube), whose clear walkthrough helped shape these steps. https://www.youtube.com/playlist?list=PLQ5InjwnjHuWql4HisWzayY7bmTfWxLWB
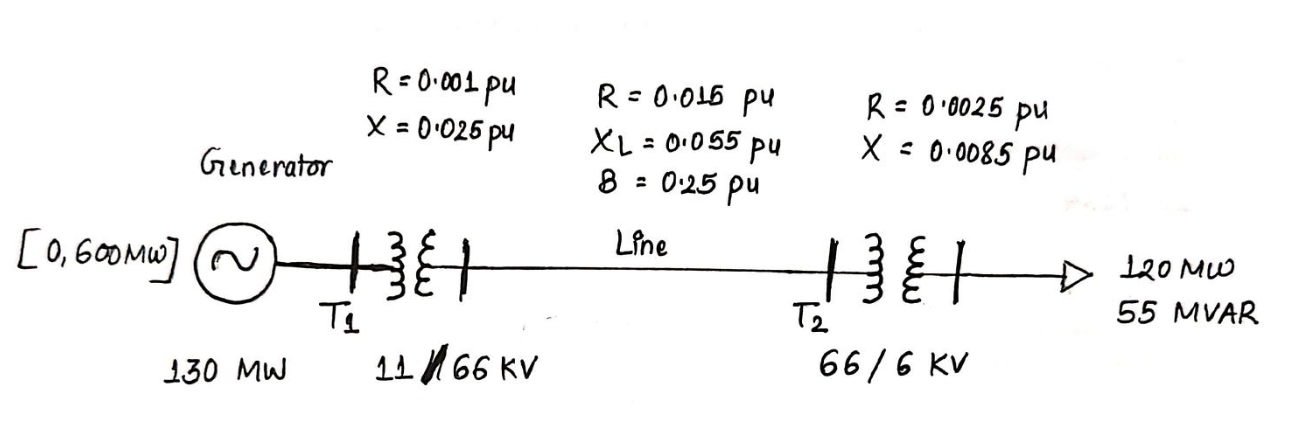
Simple Power System Network
This is the basic single-line diagram, showing a generator, transformers, transmission lines, and a load. Select the Edit Mode to begin creating your circuit in PowerWorld.
-
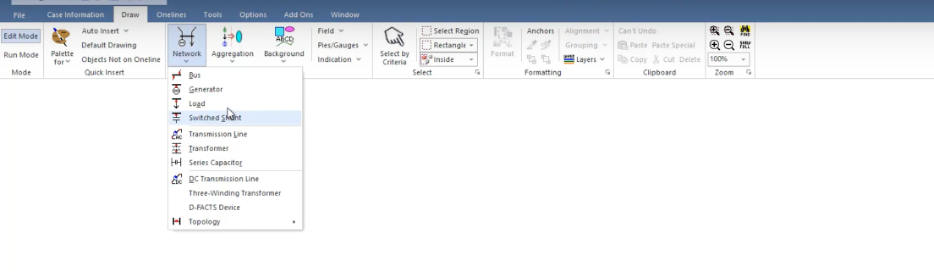
Go to File → New Case to start a fresh project.
-
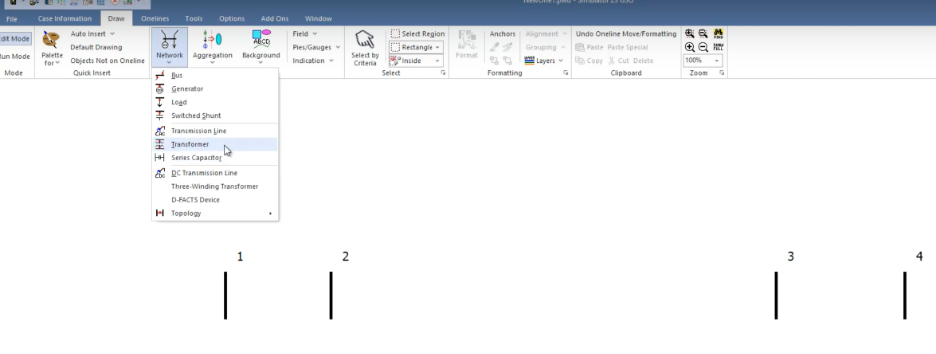
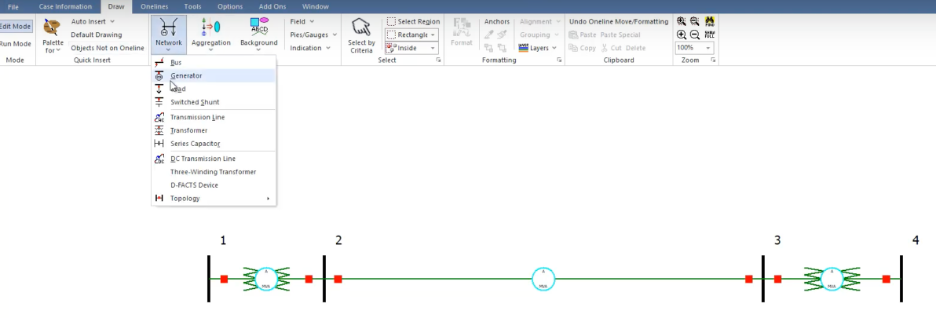
Select the Draw option, then navigate to Network to access various power system components.
-
Click on each required component and place them on the canvas to build your circuit.
- After all the buses are drawn, it looks something similar to this, as earlier nominal voltage for each bus is selected accordingly.
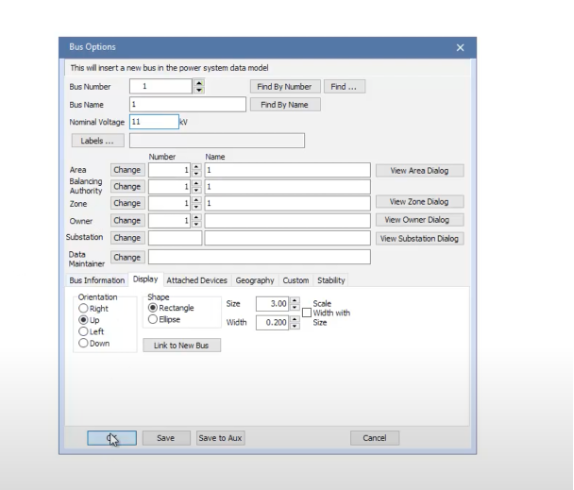
- Once all buses are placed, your layout should resemble a structured network. Make sure each bus is assigned its correct nominal voltage — for example: 11 kV, 66 kV, 66 kV, and 6 kV, respectively.
-
Next, add the transformer by selecting it from the Network menu and placing it between Bus 1 and Bus 2. Since the bus voltages have already been defined, you don’t need to specify the transformer’s voltage levels manually.
-
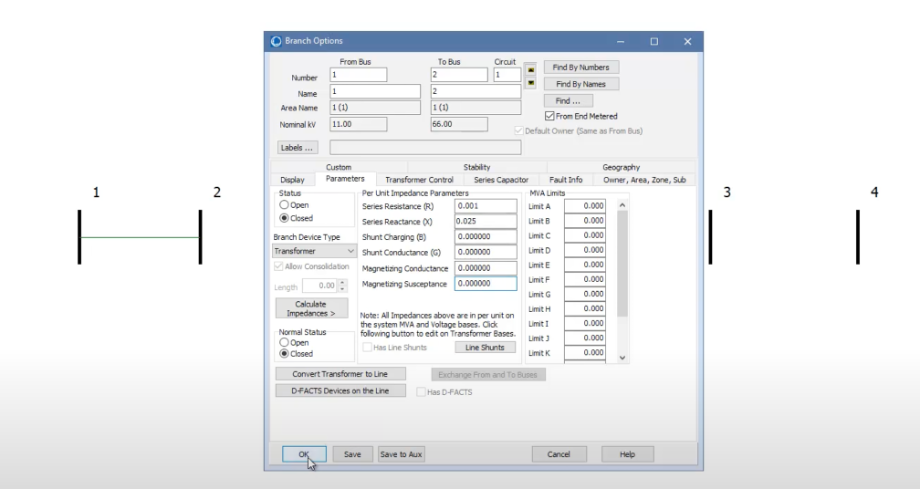
When you click on the transformer, a settings dialog box will appear. Enter the resistance (R) and reactance (X) values as specified (refer to the simple power system network), then click OK to apply the settings.
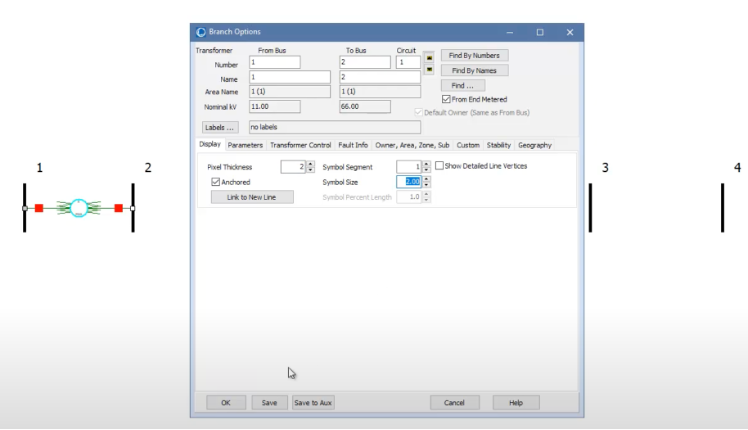
- To increase the visual size of the transformer, click on it, go to the Display tab, and adjust both the “Pixel Thickness”and “Symbol Size” settings to your preference.
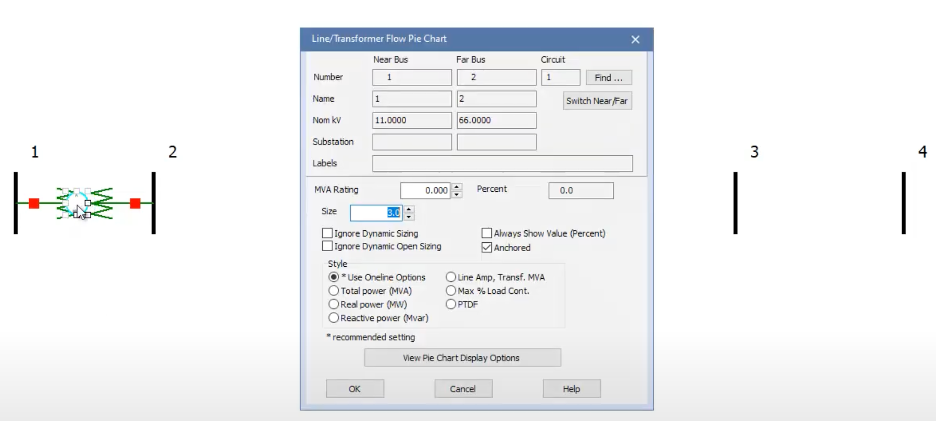
- Click on the center window of the transformer to open a dialog box where you can choose how data is displayed. Options include Total Power (MVA), Real Power (MW), and Reactive Power (Mvar). In this case, select Total Power (MVA)and set the font size to 4 for better visibility.
- Similarly, draw the transmission line and enter its specifications, including any shunt admittance if required. Then, click on the center circle of the line to open the display settings. Select Total Power (MVA) and set the font size to 4, just as you did for the transformer.
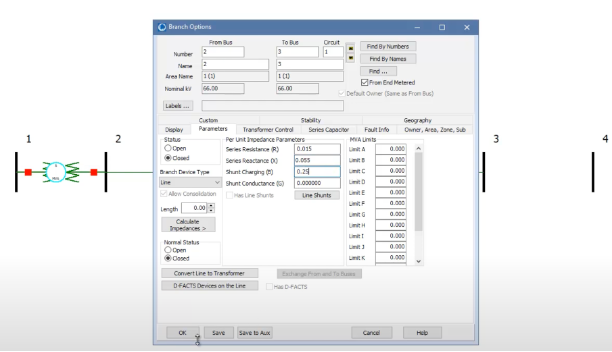
- At this stage, your circuit should resemble the layout shown below. Next, proceed to add the generator and load components.
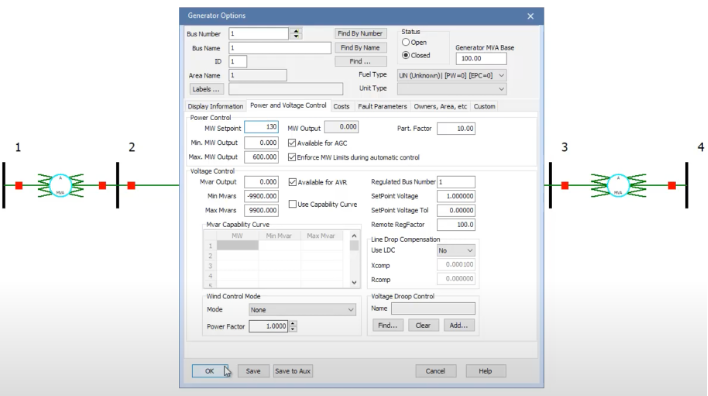
- Enter the generator specifications as (0, 600) MW, with a setpoint of 130 MW. To align the text to the left, go to Display Information and choose the “Left” alignment option. You can also adjust the font size from this menu as needed.
- Once the generator is set, add the load to the right side of the network. In the load’s properties dialog, enter its active power (120 MW) and reactive power (55 MVAr) ratings. After applying these settings, your one-line diagram should look like this:

- Switch to Run Mode, then click Solve. You’ll see several solution methods:
· For most power flow analyses, “Solve Power Flow — Newton” is the default and best choice. It balances accuracy and speed well.
· If the case is very large or requires very fast approximate results, Fast Decoupled Power Flow can be used.
· For troubleshooting convergence problems, Reset to Flat Start then solve again with Newton.
· Use Robust Solution Process only when Newton fails repeatedly.
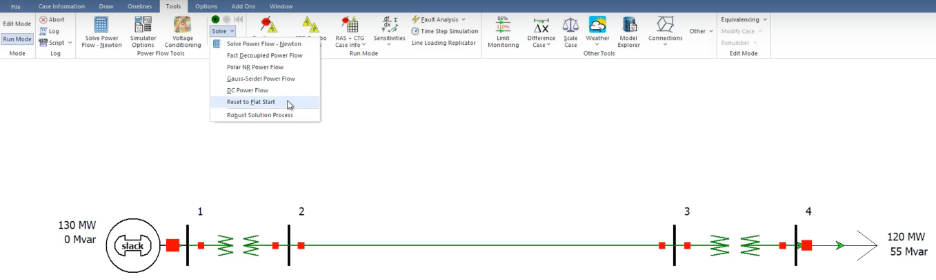
- For example, choose Polar Newton–Raphson Power Flow, then click the green Run/Solve icon. You’ll see the solver progress in the status bar as it iterates toward convergence.

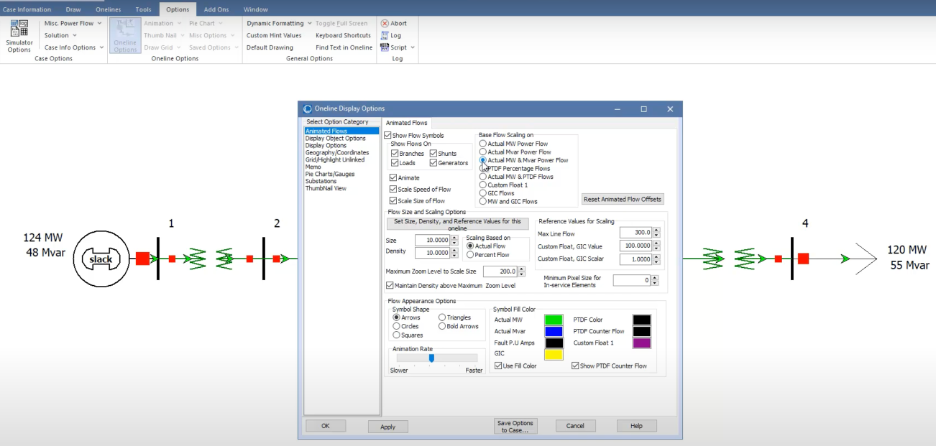
- Go to Options → Oneline Options → Animated Flows. Under Flow Type, choose “Actual MW and Mvar Power Flow.” Adjust the color scheme and animation style as desired. Once enabled, your one-line diagram will animate arrows showing both real (MW) and reactive (Mvar) power direction and magnitude.
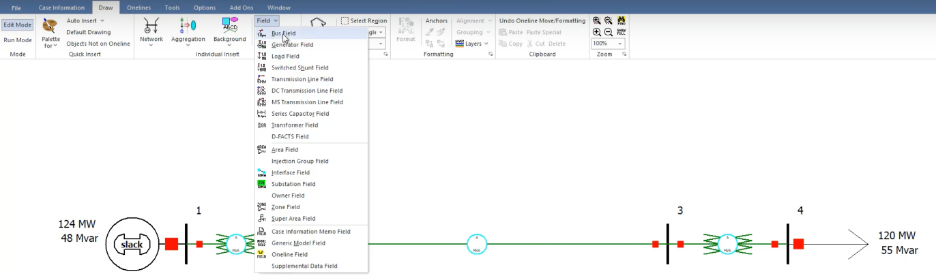
- To display voltages, angles, and losses, switch back to Edit Mode, select Draw → Field, choose the component type (Bus, Line, or Transformer), then click on the element in your one-line diagram; in the dialog that appears, tick the desired quantities, such as bus voltage (kV or pu), bus angle (°), line or transformer losses (MW/Mvar), and click OK to overlay those values directly on your network.
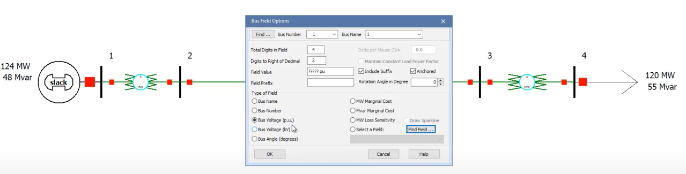
- For example, when you select the Bus Field option and click on Bus 1, a dialog box appears where you can choose to display the bus voltage in per unit (p.u.) or kilovolts (kV) as well as the bus angle in degrees (°), then click OK to overlay those values on your diagram.
- Similarly, for transmission lines and transformers you can choose the Line Field or Transformer Field option, click on the element in your one-line diagram, select to display losses in megawatts (MW losses) and megavars (Mvar losses), and then click OK to overlay those loss values.
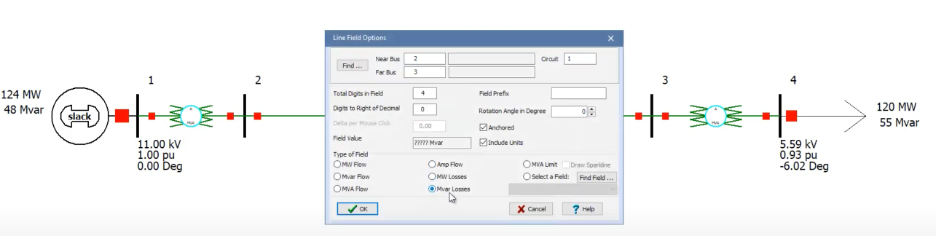
- After rerunning the power flow, observe the power arrows flowing from buses with higher phase angles to those with lower phase angles.

In second part, we’ll dive deeper into using PowerWorld’s Spinner tool for interactive value adjustments, show you how to fix under-voltage conditions with a shunt capacitor, and demonstrate how to extract the Y-bus admittance matrix.
메타데이터
- post_id
- fdaefd2dfc32
- slug
- powerworld-simulator-load-flow-and-economic-dispatch-a-beginners-tutorial-fdaefd2dfc32
- url
- https://medium.com/@binitapdl/powerworld-simulator-load-flow-and-economic-dispatch-a-beginners-tutorial-fdaefd2dfc32
- canonical_url
- https://medium.com/@binitapdl/powerworld-simulator-load-flow-and-economic-dispatch-a-beginners-tutorial-fdaefd2dfc32
- author_url
- https://medium.com/@binitapdl
- status
- ok
- fetched_at
- 2026-07-26 00:36:19



