Titanic’s Secrets Unveiled: What Would Jack and Rose Discover Through Data Science?
A serene evening on the deck of the RMS Titanic. Rose and Jack sit together, gazing at the starlit sky as the ocean whispers tales of the…
Titanic’s Secrets Unveiled: What Would Jack and Rose Discover Through Data Science?
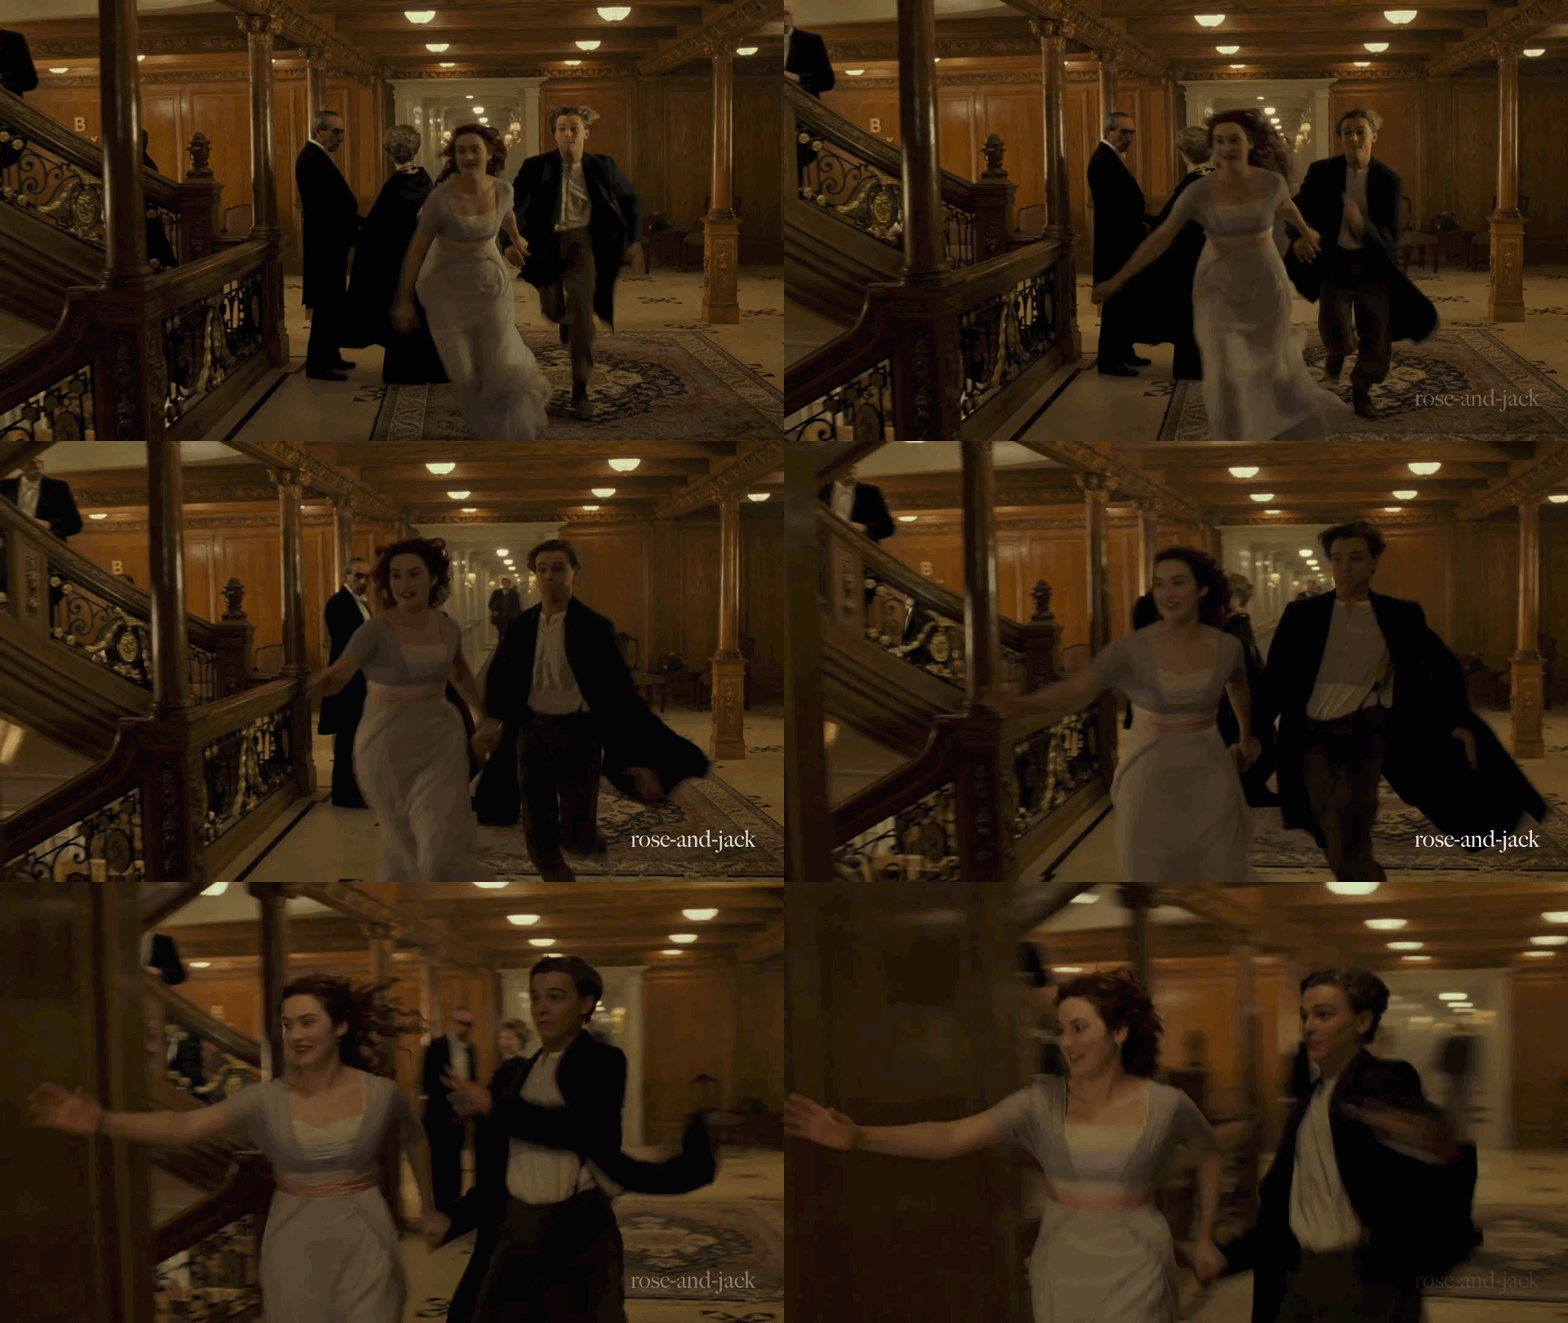
A serene evening on the deck of the RMS Titanic. Rose and Jack sit together, gazing at the starlit sky as the ocean whispers tales of the past.
Rose: Jack, do you ever wonder about the stories hidden within these waves?
Jack: Every ripple holds a tale, Rose. Just like each passenger aboard this ship carries their own narrative.
Rose: Speaking of narratives, have you heard about the Titanic dataset? It’s like a treasure trove of information, revealing the stories of those who sailed with us.
Jack: Ah yes, I’ve heard whispers about it. They say it holds the key to understanding who survived that dreadful night.
Rose: Exactly! Let’s delve into it together, shall we? Imagine if we could unravel the mysteries of survival using data science.
Jack: Sounds intriguing! How do we begin?
Rose: First, we load the dataset into our analysis. It’s like unfurling a map, guiding us through the passengers’ journeys.
import pandas as pd import matplotlib.pyplot as plt import seaborn as sns
Load the Titanic dataset
dataset = pd.read_csv(“Titanic-Dataset.csv”)
Jack: Fascinating! Each row must be like a chapter in a book, with features like age, gender, and class shaping the plot.
Rose: Precisely! Let’s visualize the survival story by gender, Jack. It’s a poignant reflection of the societal norms of our time.
Visualizing survival by gender
sns.countplot(data=dataset, x=”Sex”, hue=”Survived”) plt.xlabel(“Gender”) plt.ylabel(“Count”) plt.title(“Survival by Gender”) plt.show()
Jack: Remarkable. But what about missing values? Won’t they distort our narrative?
Rose: Ah, good point, Jack. We’ll fill those gaps with imputed values, ensuring our analysis remains steadfast like the North Star.
Imputing missing age values based on passenger class
def impute_age(cols): age = cols[0] pclass = cols[1] if pd.isnull(age): if pclass == 1: return 38 elif pclass == 2: return 30 elif pclass == 3: return 25 return age
dataset[‘Age’] = dataset[[‘Age’, ‘Pclass’]].apply(impute_age, axis=1) Make the indentation correct
Jack: Clever! Now, let’s weave our findings into a predictive model, like crafting a tale that foretells the future.
Rose: Agreed, Jack. With logistic regression, we’ll stitch together the threads of features to unveil the patterns hidden within the data.
from sklearn.model_selection import train_test_split from sklearn.linear_model import LogisticRegression from sklearn.metrics import confusion_matrix
Splitting data into training and testing sets
X_train, X_test, y_train, y_test = train_test_split(X, y, test_size=0.30, random_state=42)
Fitting logistic regression model
model = LogisticRegression() model.fit(X_train, y_train)
Making predictions
y_pred = model.predict(X_test)
Evaluating model performance
confusion_matrix(y_test, y_pred)
Jack: Rose, this journey has been enlightening. Who knew that beneath the waves of data lies the key to unlocking the mysteries of our past?
Rose: Indeed, Jack. Just like our love story, the Titanic saga continues to captivate hearts and minds, reminding us of the resilience of the human spirit.
Rose: Before we part ways, Jack, let me explain the confusion matrix. It’s like a compass that guides us through the wilderness of predictions.
Jack: Please do, Rose. I’m all ears.
Rose: The confusion matrix helps us evaluate the performance of our model. It consists of four components:
- True Positive (TP): These are the instances where our model correctly predicts survival.
- True Negative (TN): These are the instances where our model correctly predicts non-survival.
- False Positive (FP): Also known as Type I error, these are the instances where our model predicts survival when the passenger did not survive.
- False Negative (FN): Also known as Type II error, these are the instances where our model predicts non-survival when the passenger actually survived.
Jack: Ah, I see. So, the confusion matrix provides us with a clear picture of where our model excels and where it falls short.
Rose: Exactly, Jack. By analyzing these components, we can refine our model and uncover even deeper insights into the Titanic tragedy.
As Rose and Jack bid farewell, they carry with them not only the memories of their Titanic journey but also a newfound appreciation for the power of data science in unraveling historical mysteries.
메타데이터
- post_id
- fe36cddda15d
- slug
- titanics-secrets-unveiled-what-would-jack-and-rose-discover-through-data-science-fe36cddda15d
- url
- https://medium.com/@srivastavayushmaan1347/titanics-secrets-unveiled-what-would-jack-and-rose-discover-through-data-science-fe36cddda15d
- canonical_url
- https://medium.com/@srivastavayushmaan1347/titanics-secrets-unveiled-what-would-jack-and-rose-discover-through-data-science-fe36cddda15d
- author_url
- https://medium.com/@srivastavayushmaan1347
- status
- ok
- fetched_at
- 2026-07-24 06:21:58